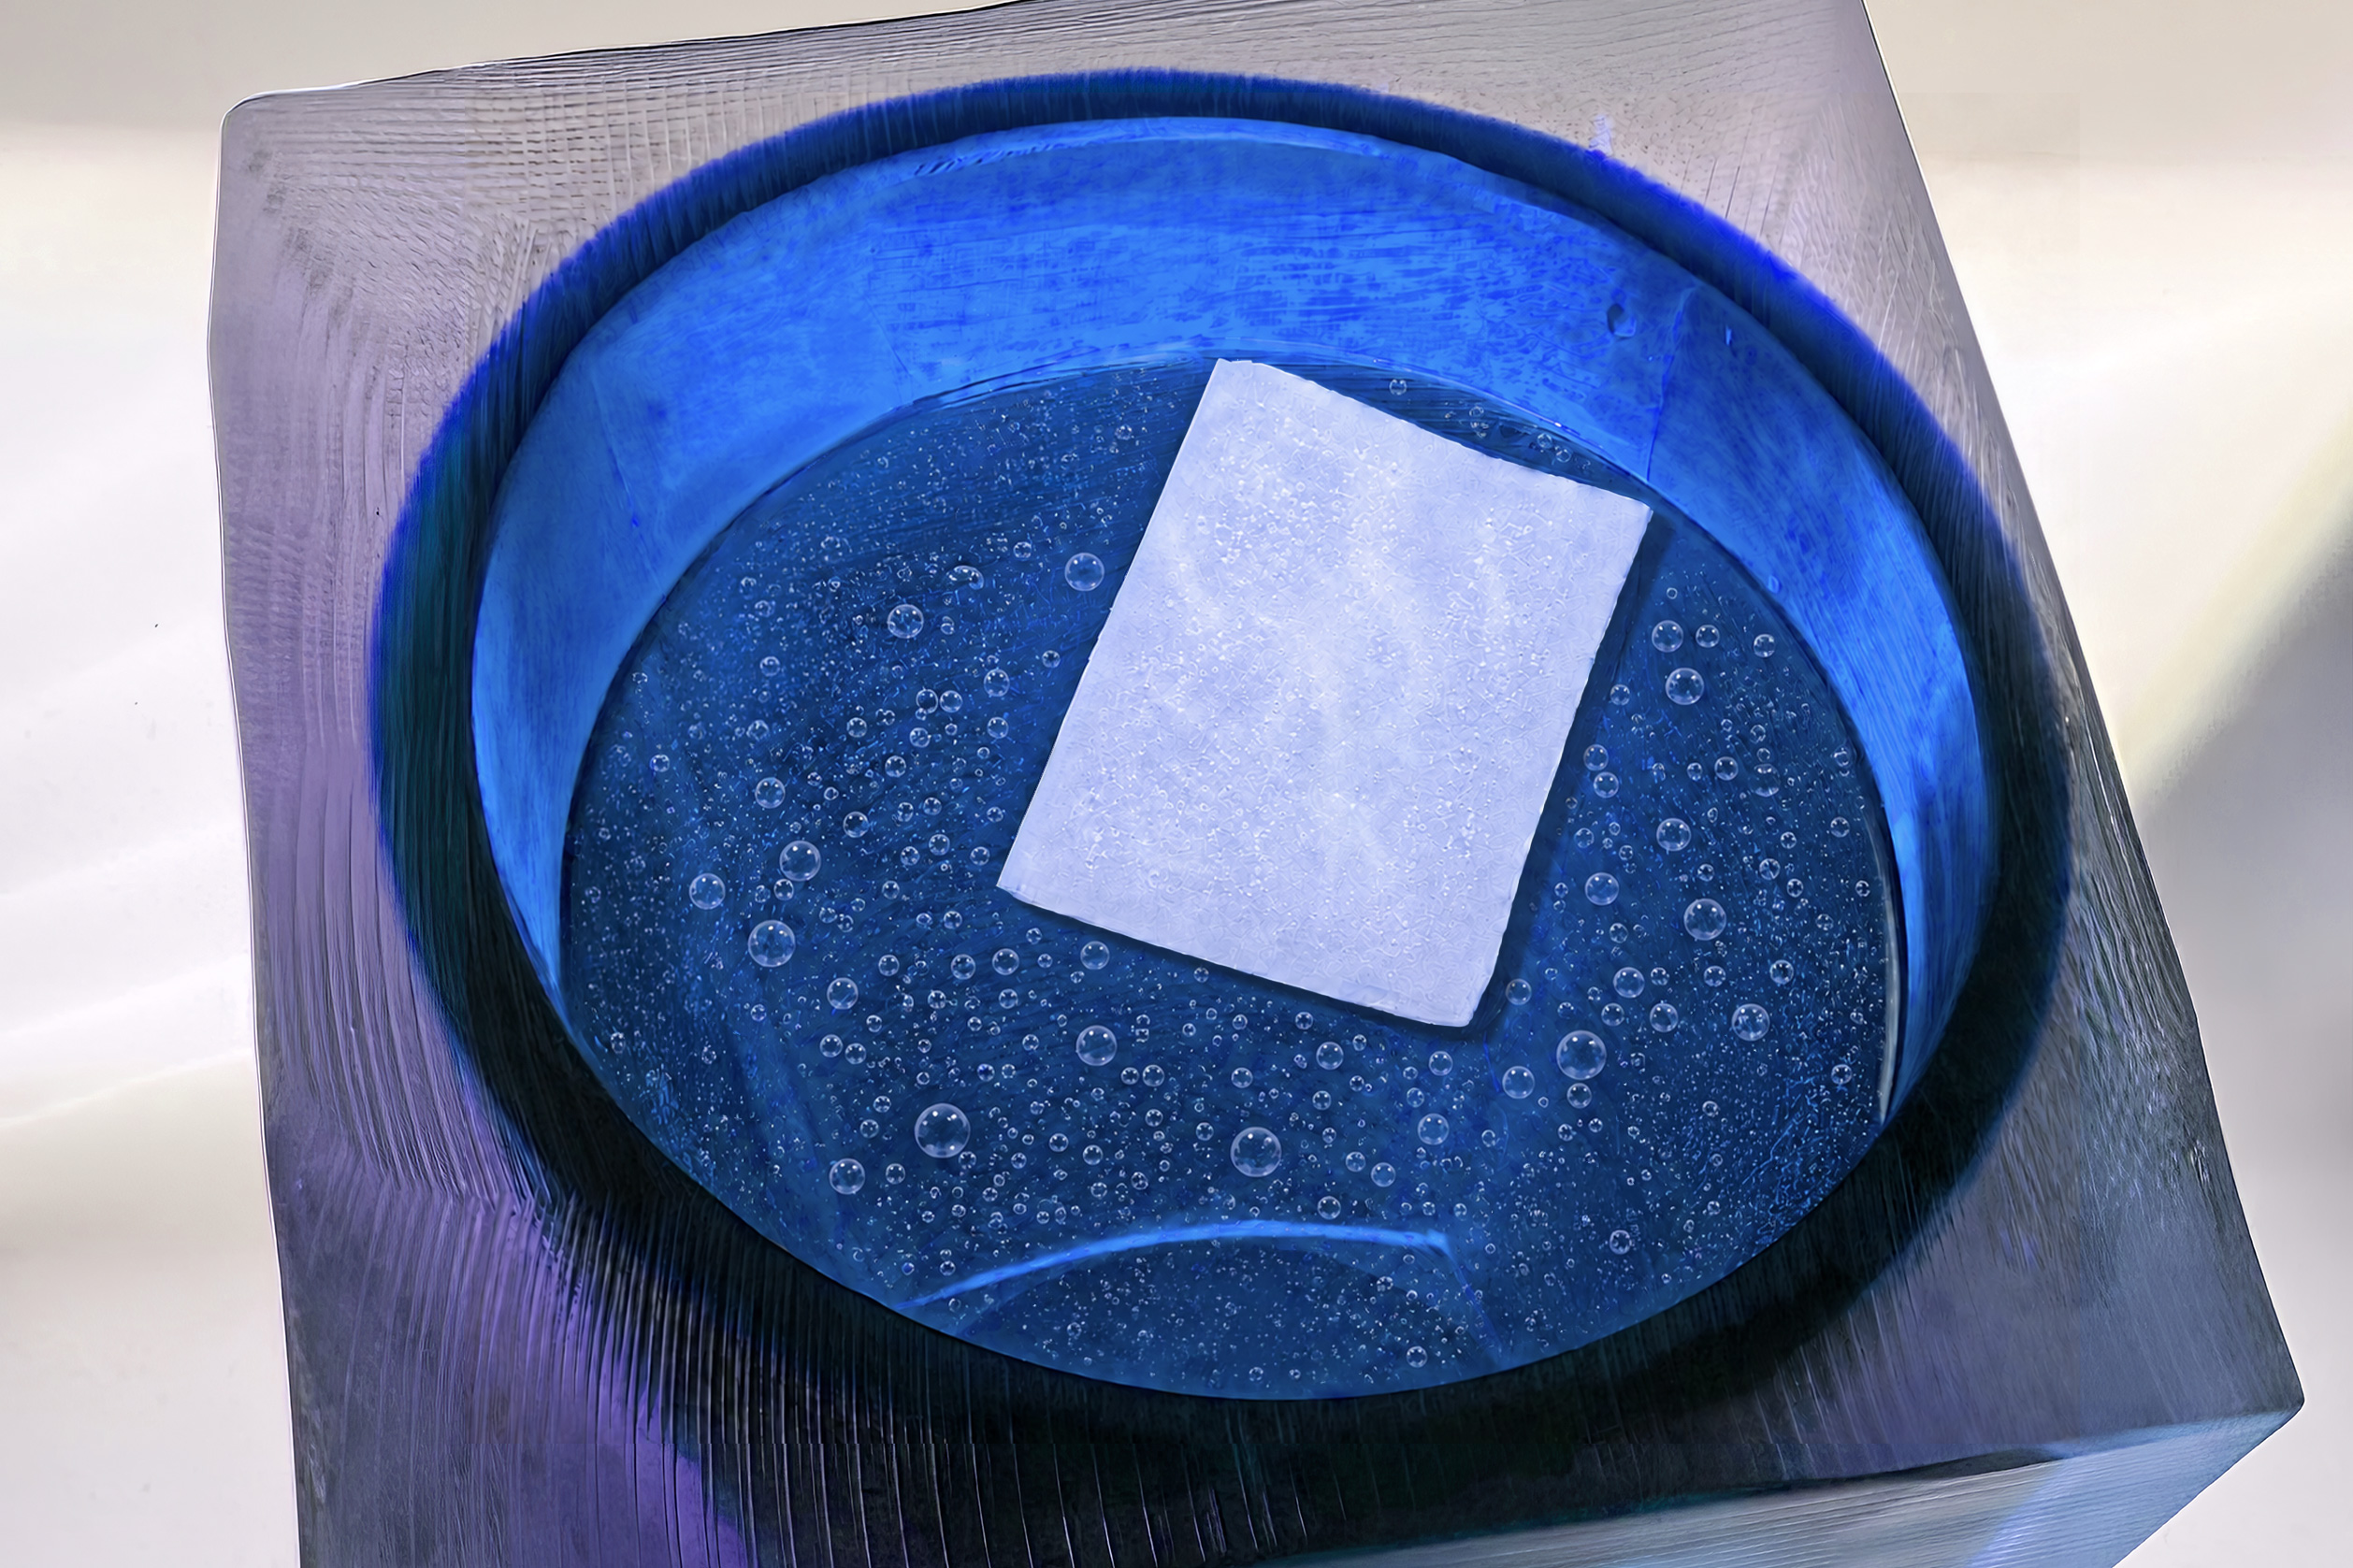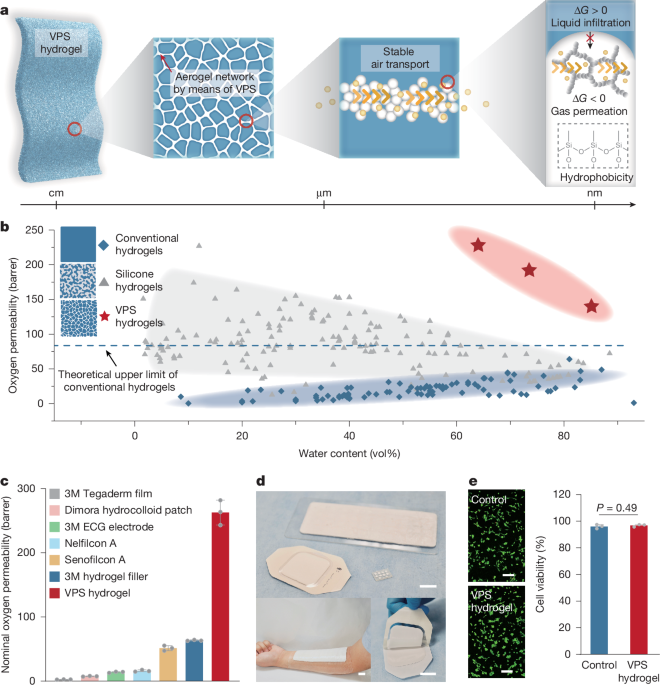
MainLiving tissues need to breathe. However, as hydrogels are increasingly used as interfaces between tissues and devices/environments18, such as dressings19, sealants20, electrodes21, lenses22, waveguides23 and couplants24, they typically exhibit low air permeability (<40 barrer; Supplementary Table 1).The low air permeability of hydrogels is inherently limited by the orders of magnitude lower gas concentration (C) and diffusivity (D) in water compared with those in the gas phase (as discussed in Supplementary Information section 1.1), as indicated by Fick’s law1. As a result, the air permeability of conventional single-phase hydrogels is capped by the theoretical limit of air permeability in pure water (Fig. 1b). To surpass this limit, a secondary phase—composed of either macroscale/mesoscale air pathways13,14,15 or materials with molecular-level free volumes16—must be introduced. Yet, these floppy air pathways in hydrogels tend to collapse or accumulate water, leading to a substantial reduction in air permeability during practical use (further discussed in Supplementary Information section 1.2). Moreover, achieving high air permeability requires a high volume fraction of the secondary phase, creating an intrinsic trade-off between air permeability and water content. This trade-off drives the state-of-the-art design of hydrogel-based materials towards low water content, ultrathin form factors25,26 or active oxygen-generating mechanisms27, for which efficient air exchange is required.Fig. 1: Design strategy and key features of air-permeable hydrogels.a, Hierarchical structures of VPS hydrogels. b, Evolution of air permeability with varying water content in conventional hydrogels (Supplementary Table 1), silicone hydrogels (Supplementary Table 2) and VPS hydrogels, as well as theoretical upper limit of air permeability in conventional hydrogels51. Schematics of the microstructures in each type of material are illustrated as insets, in which blue and grey regions represent the hydrophilic and hydrophobic parts, respectively. c, Comparison of nominal oxygen permeability between VPS hydrogels and commercial hydrogel/elastomer products for epidermal or ocular applications (Supplementary Table 3). d, Various form factors of VPS hydrogels. e, In vitro biocompatibility of the VPS hydrogel in a live/dead assay of NIH 3T3 fibroblast cell line after 24 h of culture. All bar heights indicate the mean of the data. All error bars indicate the standard deviation (±s.d.). n = 3 independent samples in c and e. Scale bars, 2 cm (d); 200 μm (e).To address these fundamental and technical limitations, we introduce a bottom-up phase-engineering strategy to develop a low-volume-fraction yet ultrastable (mechanically and thermodynamically) air-rich network within hydrogels, inspired by the architecture of human lungs. Despite the fact that lungs are composed of about 80% water, their tracheal system (for example, bronchioles with diameters of about 500 μm), mechanically supported by cartilage and chemically functionalized by a hydrophobic layer28, enables litres of air exchange per minute29. To emulate this structure, we first stabilized air-rich aerogel particles in a water medium to provide a sufficiently high air concentration (C). We then induced VPS17 to form a percolated network of aerogel particles, ensuring high diffusivity (D) even at very low volume fractions (less than 15 vol%). This design enables the engineered VPS hydrogel to achieve up to a tenfold increase in air permeability compared with conventional hydrogels, surpassing the performance of state-of-the-art silicone hydrogels despite its much higher water content (Fig. 1b). Furthermore, the strategy is compatible with various hydrogel materials, including synthetic, protein-based and polysaccharide-based hydrogels.The prepared VPS hydrogels offer great potential in biomedical applications owing to their high air permeability, ease of fabrication and biocompatibility. Compared with commercial products for epidermal or ocular purposes, such as 3M Tegaderm film, DynaDerm hydrocolloid patch, 3M ECG electrode, nelfilcon A, senofilcon A and 3M hydrogel filler, the VPS hydrogels exhibit more than four times higher nominal oxygen permeability (Fig. 1c; calculation method detailed in Methods). Meanwhile, the bottom-up VPS strategy enables easy integration with various processing methods and form factors, allowing for versatile fabrication into large flat sheets, encapsulated patches and micro-textured films (Fig. 1d). Furthermore, the in vitro biocompatibility of the VPS-hydrogel-conditioned medium is comparable with that of the control medium, showing no observable decrease in viability of both NIH 3T3 (Fig. 1e) fibroblast cell line after 24-h culture and BALB/c 3T3 (Supplementary Fig. 1) mouse embryonic fibroblast cell line after 7-day culture.Phase engineering for air-permeable hydrogelsTo address the key challenges of inefficient air permeation (low C and D) in water-rich hydrogels, our phase-engineering approach focuses on two aspects: (1) mechanically and thermodynamically stabilizing the air phase by encapsulating it within aerogel particles and (2) creating a percolated network of these aerogel particles at low volume fractions by kinetically manipulating VPS.To enhance the gas fraction in an aqueous environment, we used silica aerogel particles with an average diameter of 8 μm and 90% porosity (Supplementary Fig. 2; the size effects of the particles are simulated and discussed in Supplementary Information section 1.3). These aerogel particles serve as a low-cost porous species for creating ‘microporous water’30,31. They are characterized by (trimethylsilyl)oxy-functionalized nanotunnels (right panel in Fig. 1a), exhibiting superhydrophobicity (key specifications are presented in Supplementary Table 4). Mechanically, the rigid silica framework prevents the gas phase from collapsing. Thermodynamically, water infusion into these tunnels is disfavoured owing to the enthalpic penalty incurred when water molecules contact the hydrophobic surface, at the cost of disrupting the water molecule network. To enhance the compatibility between the air-rich particles and the water-rich environment, we used macromolecular surfactants, including Pluronic F-127, poly(vinyl alcohol) (PVA) and poly(acrylic acid) (PAA) (the sample preparation is presented in Methods). These macromolecules have high molecular weights (>12 kDa), preventing them from clogging the air tunnels. Furthermore, the high viscosity of the suspension effectively suppresses particle buoyancy resulting from the marked density disparity between the aerogel particles (0.13 g ml−1) and water (1 g ml−1). As shown in Supplementary Fig. 3, no macroscopic phase separation was observed two weeks after the suspension had been prepared. The preservation of the porous structure was further verified through ethanol-induced collapse experiments: immersing VPS hydrogels in less polar solvents, such as ethanol, resulted in the collapse of the nanoscale tunnels, releasing the captured air (Supplementary Video 1).To facilitate the gas-phase transport to the largest extent, it is critical to form a percolated network of aerogel particles without compromising the water content of the hydrogel. In conventional phase separation of two incompatible components (such as water–oil or hydrophilic–hydrophobic polymer systems), achieving a percolated morphology typically requires a substantial volume fraction of either component, generally close to 50 vol% (ref. 32). If the volume fraction of either component is much lower, the minor component usually forms isolated, island-like structures (Fig. 2a, (1)). Conversely, our design makes use of VPS, which occurs when the two components—water (major component) and aerogel particles stabilized by polymers (minor component)—exhibit substantial difference in mobility or response to deformation, that is, dynamic asymmetry. Such asymmetry in dynamics originates from the different particle sizes of the components involved and is also seen in polymer solutions33, biological fluids34 and other particle suspensions35 (Supplementary Fig. 4a–d). During VPS, the characteristic timescale for component movement, τt, is given by τt ≈ a2/Da ≈ 6πηa3/kBT, with the diffusion constant Da = kBT/6πηa, in which a is the particle size, kB is the Boltzmann constant, T is the absolute temperature and η is the viscosity of the medium. A difference in particle size of 102 to 104 times results in pronounced dynamic discrepancies. As such, the aerogel-rich phase cannot keep pace with the deformation rate of the water-rich phase, causing the aerogel-rich phase to behave like an elastic body and form a percolated network before settling into disconnected island-like structures36 (Fig. 2a, (2)). In the present aerogel suspension, such an intermediate percolated network chained by aerogel particle, that is, ‘VPS aerogel network’, mainly contributes to air permeation.Fig. 2: Preparation and characteristics of VPS aerogel networks.a, Kinetic features of phase separation between dynamically (1) symmetric and (2) asymmetric compositions. b, Optical microscope images showing the phase transition structure over time. c, Cross-section images and reconstructed aerogel networks obtained by micro-CT, highlighted in different colours based on their sizes: the largest to the fourth largest are shown in red, yellow, blue and green, respectively. Other smaller networks are shown in grey. d, Quantitative analysis of the evolution of the volume ratios of the top eight largest percolated networks over time. Error bars reflect the volume ratios of several selected regions (details on the characterization are presented in Methods). e, Topological analysis of network percolation using Euler characteristic numbers. f, Evolution of oxygen permeability in VPS aerogel networks over time. All bar heights indicate the mean of the data. All error bars indicate the standard deviation (±s.d.). n = 3 independent samples in d, e and f. Scale bars, 100 μm. a.u., arbitrary units.Temporal evolution of VPS aerogel networksBy inducing VPS, we simulated (Supplementary Information section 1.4) and experimentally observed the temporal evolution of the aerogel-ensemble morphology at 2 wt% (11 vol%; Supplementary Table 5) aerogel content. Notably, this stringently low volume fraction was selected because, without VPS, conventional blending would typically yield isolated domains (Fig. 2a, (1)) rather than a percolated network of air channels (Fig. 2a, (2)). Optical images (Fig. 2b) showed the phase behaviour within a thin-film chamber. Initially, aerogel particles were uniformly distributed throughout the material (left panel in Fig. 2b). As phase separation progressed, these particles formed a network-like structure (VPS aerogel network; middle panel in Fig. 2b), eventually evolving into a disconnected state (right panel in Fig. 2b, with the full series of morphological evolution in Supplementary Fig. 5 and further discussion in Supplementary Information section 1.5). Even though the particle volume fraction is about 11 vol%, well below the percolation threshold (about 29 vol%)37 for spherical objects in a 3D space, the intermediate networks provide a desirable morphology for air permeation. Furthermore, geometrically38 or magnetically39 anisotropic particles could further reduce the percolation threshold, allowing for lower particle volume fractions to achieve high permeability; however, this is beyond the scope of the present study.To gain deeper insights into the phase behaviour, we conducted micro-computed tomography (micro-CT) on bulk hydrogel samples. This technique enables the analysis of the position of each aerogel particle and the spatial relationships, focusing on metrics such as the percolation fraction (fp), Euler characteristic number (χ) and pore-size distribution (Supplementary Fig. 6 and Supplementary Information section 1.6). The structural evolution of the material was first explained through percolation analysis. Using micro-CT, we identified voxels that belonged to aerogel particles, that is, ‘aerogel voxels’. We then evaluated the percolation of aerogel voxels and classified all aerogel particles based on their parent percolated network. This allowed us to quantify the size of a connected aerogel network throughout the bulk sample using a percolation ratio fp = np/n, in which np and n are the number of voxels in a percolated network and the total number of aerogel voxels, respectively (the characterization method is presented in Methods). Micro-CT cross-sections of bulk samples at different development times highlighted several of the largest percolated networks within a representative 3D region, with colour-coding for clarity (Fig. 2c, Supplementary Fig. 7 and Supplementary Video 2). As the structure developed, the red-highlighted (largest) region became predominant. As quantified in Fig. 2d, the proportion of the largest network initially increased, peaked at 8 h (fp = 0.84) and then decreased, whereas smaller networks showed the opposite trend. This trend aligns with the predicted network development in VPS, featuring an initial coalescence into a network followed by subsequent disintegration (right panel of Fig. 2a, (2)).The topology of the VPS aerogel network was also quantified by the Euler characteristic number (χ), defined for a 3D object as the integral of the Gaussian curvature (K) over the surface area (M): \(\chi =\frac{1}{2{\rm{\pi }}}{\int }_{M}K{\rm{d}}A\). Qualitatively, the χ evaluates the degree of looping, connectivity and overall complexity of a network-like structure. Numerical simulations have shown that χ values evolve from positive, plunge to negative minima and then rise towards zero during the VPS process, representing the transition from isolated spheres to a saddle-shaped surface and finally to a thinning network40. This progression was well replicated in our aerogel system, as demonstrated by the χ values in Fig. 2e, indicating that VPS occurred. Notably, the thinning stage was achieved at around 8 h.To achieve optimal air permeability, hydrogels with the largest percolated network of aerogel particles are desirable. We induced the crosslinking of macromolecules to freeze the motion of the slower phase to arrest the optimal morphology during VPS (details on oxygen permeability characterization are presented in Methods). With a 2 wt% aerogel content (red trace in Fig. 2f), as the sample evolved into a network-like structure from 0 to 8 h, oxygen permeability increased by 40%, peaking at 141 barrer. Beyond this optimal point, the permeability began to decrease. We performed further micro-CT analysis to verify the structural uniformity of the network (Supplementary Information section 1.7) and our mass-transport modelling further supports that the morphology at 8 h is optimal for air permeability (Supplementary Information section 1.8). Similarly, with a 4 wt% aerogel content (blue trace in Fig. 2f), the permeability peaked at 8 h, reaching up to 193 barrer and remained nearly unchanged after 24 h. This nearly constant air permeability is probably because of the slowing of particle motion when particles are highly concentrated. A higher aerogel content (for example, 6 wt%) would further enhance the air permeability (229 barrer; Fig. 1b); however, we do not explore this regime here, as our focus is mainly on the high-water-content region.Preparation and properties of VPS hydrogelsTo endow hydrogels with exceptional air permeability, we prepared the VPS hydrogels by filling the VPS aerogel network with a pregel solution of various types of hydrogel (Fig. 3a,b). For instance, with similar water content (about 70 vol%), the VPS PVA hydrogel achieves an oxygen permeability of 153 barrer (Fig. 3c), an almost tenfold increase compared with the permeability of pristine PVA hydrogel (15.5 barrer). The VPS PVA hydrogel was prepared by filling PVA solution to replace the water portion in the VPS aerogel network (Fig. 3a; the sample preparation is presented in Methods). The successful filling is verified by the absence of squeezed-out liquid (Fig. 3b) and an increased proportion of residual carbon, as evidenced by thermogravimetric analysis (Supplementary Fig. 8, Supplementary Table 5 and Supplementary Information section 1.9).Fig. 3: Preparation and properties of VPS hydrogels.a, Schematic illustration of VPS network formation and filling polymers into the VPS network to prepare VPS hydrogel. b, Squeezing tests of samples before and after polymer filling. c, Comparison of air permeability between various VPS hydrogels (4 wt% aerogel content) and their corresponding counterpart hydrogels. d, WVTRs of VPS hydrogels (4 wt% aerogel content) compared with other commercial products for epidermal applications. e, Comparison of Young’s modulus between the VPS PVA hydrogel and the pristine PVA hydrogel. 1Samples with 2 wt% (11 vol%) aerogel content. 2Samples with 4 wt% (23 vol%) aerogel content. f, VPS hydrogels undergo various types of deformation, including (1) bending, (2) folding, (3) rolling and (4) stretching. g, Oxygen permeability of VPS hydrogel measured at the initial state and after 10, 100 and 10,000 tensile cycles at 20% strain. h, Stable VPS hydrogel compared with non-porous hydrogel and conventional porous hydrogel in water. i, Comparison of air permeability and conductivity (with ions as the primary charge carriers) in conventional ionic hydrogels and VPS ionic hydrogels (2 wt% aerogel content). References and key parameters are presented in Supplementary Table 6. j, Comparison of air permeability and conductivity (with electrons as the primary charge carriers) in polymer-based, metal-based, carbon-based and VPS conductive hydrogels (2 wt% aerogel content). References and key parameters are presented in Supplementary Table 7. k, Comparison of conductivity in PEDOT:PSS-based hydrogels prepared by the VPS process and by random mixing. l, Comparison of conductivity in silver-flake-based hydrogels prepared by the VPS process and by random mixing. All bar heights indicate the mean of the data. All error bars indicate the standard deviation (±s.d.). n = 3 independent samples in panels c, d, e, g, k and l. Scale bars, 1 cm.We then demonstrate the broad material applicability of the VPS strategy for enhancing air permeability across different hydrogels, including alginate, agarose, chitosan and gelatin (Fig. 3c). The material scope covered protein-based, polysaccharide-based and synthetic polymers, encompassing a broad range of hydrogels for diverse biomedical applications. These VPS hydrogels demonstrated an oxygen permeability up to 185 barrer (Fig. 3c), much higher than their counterparts, which ranged from 15 to 69 barrer (sample preparation presented in Supplementary Information section 3.1). Furthermore, VPS hydrogels also showed enhanced vapour permeability compared with many other materials (Fig. 3d; method presented in Methods). Notably, VPS hydrogels exhibited a water vapour transmission rate (WVTR) that is 10–100 times higher than silicone and polyurethane patches.The VPS hydrogels exhibit excellent softness and robustness. Owing to the low aerogel content, the VPS hydrogels retained their mechanical flexibility and softness: with a 2 wt% aerogel content, the VPS PVA hydrogel exhibited a Young’s modulus close to that of PVA hydrogel (50–100 kPa; Fig. 3e; method presented in Methods), comparable with that of biological tissues (for example, 10–100 kPa for forearm skin41). As illustrated in Fig. 3f, the material can be bent, rolled, folded and stretched without damage. The mechanical stability was further confirmed by cyclic tensile tests at 20% strain for 10,000 cycles: after cycling, the air permeability decreased by only about 5% (Fig. 3g) and the Young’s modulus decreased by 12.8% compared with the first cycle (Supplementary Fig. 9 and Supplementary Information section 1.10). Water immersion also does not compromise the robust air tunnels (Fig. 3h). Distinct from non-porous and conventional porous hydrogels, the VPS hydrogel can float on the water surface (Supplementary Video 3) and remain afloat for 10 days (Supplementary Video 4), indicating the high stability of the air tunnels in the VPS hydrogel.The VPS strategy is compatible with functional additives of diverse forms to achieve multifunctionality. Here we demonstrate the integration of bioelectric functions into VPS hydrogels (sample preparation presented in Supplementary Information section 3.2, biocompatibility verified in Supplementary Fig. 10, further discussion presented in Supplementary Information section 1.11). By incorporating electrolytes (for example, sodium chloride), conductive nanofibres (for example, PEDOT:PSS (ref. 42)) or conductive microparticles (for example, silver flakes), VPS hydrogels can be easily modified to achieve ionic (Fig. 3i; 70.8 mS cm−1 for electrolyte-based hydrogels) and/or electrical conductivity (Fig. 3j; 4.42 S cm−1 for nanofibre-based hydrogels and 471 S cm−1 for microparticle-based hydrogels). The structure of the VPS aerogel network was confirmed by optical microscopy (Supplementary Fig. 4e–h) and its percolated architecture contributes to the enhanced conductivity (Fig. 3k,l). Overall, VPS hydrogels achieve both high ionic/electronic conductivity and air permeability simultaneously.Potential applications of VPS hydrogelsFor epidermal applications, low oxygen and water vapour permeability in materials often leads to heat and humidity build-up, causing discomfort and even severe skin conditions during wear43,44. The exceptional air and vapour permeability of VPS hydrogels provides superior comfort, making them suitable for applications such as wearable devices25 and epidermal dressings45. To demonstrate this, we compared the comfort of wearing VPS hydrogel patches with that of commercially available silicone patches during and after physical activity (Fig. 4a; method presented in Methods). Infrared imaging after a 20-min workout on an elliptical machine showed that the skin temperature under the silicone patch increased by 6.5 °C, whereas it decreased by about 1 °C under the VPS hydrogel patch, probably because of better heat dissipation (Fig. 4b,c). Furthermore, substantial sweat accumulation was noted under the silicone patch (top panels in Fig. 4d,e), in contrast to the VPS hydrogel-covered skin, which remained similar to bare skin (bottom panels in Fig. 4d,e). We also attached VPS hydrogels to the chest of ten subjects during a 1-h moderate workout. All participants reported no adverse skin reactions (for example, itchiness or irritation). For comparison, we performed similar tests on control samples, including commercial silicone patches (DynaDerm hydrocolloid patch), hydrogel patches (PVA hydrogel) and hydrogel wound filler (3M hydrogel filler). Subjects rated the comfort level using a visual analogue scale, with VPS hydrogels scoring the highest in comfort (Fig. 4f).Fig. 4: Physiological responses after wearing VPS hydrogel (4 wt% aerogel content).a, Areas of interest in sweat accumulation tests. b, Infrared images showing skin condition at rest (before patch application; temperature scale: 17.4–32.8 °C) and 2 min post-exercise (after patch removal; temperature scale: 16.3–32.9 °C). c, Temperature profiles along the solid (pre-workout state) and dashed (post-workout state) lines in panel b. Blue and red shading correspond to the locations of control and VPS hydrogel patches, respectively. d, Tested areas of interest before (top) and after (bottom) workout. e, Zoom-in images and schematic illustration of sweat permeation in areas covered by silicone patch (top) and VPS hydrogel (bottom). f, Participant wear discomfort evaluation using a visual analogue scale, with scores ranging from 0 (most comfortable) to 10 (most uncomfortable). n = 8 or 10 volunteers, each with one test conducted. g, Representative evolution of TEWL after applying VPS and PVA hydrogels on skin for 24 h. The grey-shaded area indicates the TEWL range for healthy skin. h, Representative evolution of hydration levels after wearing VPS and PVA hydrogels for 24 h. The grey-shaded area indicates the range of hydration level for healthy skin. i, Percentage deviation from the healthy state (0%) for both TEWL and hydration levels after wearing VPS and PVA hydrogels for 24 h, respectively. n = 2 volunteers, each with three independent tests. j, Photographs of a commercial ECG electrode (top) and a VPS-hydrogel-based ECG electrode (bottom). k, Sweat accumulation test during cycling exercise using a wearable ECG monitoring system (inset). l, ECG signals acquired with commercial hydrogel electrodes during a 20-min workout: (1) continuous trace and 10-s segments taken (2) before, (3) during and (4) after exercise. m, ECG signals acquired with VPS-hydrogel electrodes. Insets: (1) heart-rate (HR) profile and (2) Q–T interval (QT) profile extracted from VPS-hydrogel-based ECG data; (3) 20-min workout segment; (4)–(6) 10-s ECG segments before, during and after exercise, respectively. n, Complete ECG signal series (top) and HR profile (bottom) recorded on day 10. o, Representative 12-s ECG signal segments corresponding to specific time zones highlighted in panel n during sleep (grey), work (blue), walking (yellow) and workout (red), respectively. All bar heights indicate the mean of the data. All error bars indicate the standard deviation (±s.d.). Scale bars, 1 cm (d,e,j); 1 min (m). a.u., arbitrary units.We then evaluate the physiological responses after adhesion. Long-term use of impermeable materials can adversely affect skin barrier performance, often characterized by high levels of transepidermal water loss (TEWL) and reduced skin hydration46. To assess the impact of air permeability on skin health, we compared the evolution of TEWL and hydration levels over 24 h with VPS patches and original hydrogel patches (method presented in Methods). As illustrated, both TEWL (Fig. 4g) and hydration levels (Fig. 4h) initially decreased and then stabilized within the first 6 h after removing the patches. However, VPS hydrogels showed a more favourable recovery to a healthy skin state, as indicated by the grey-shaded areas. Further measurements, as shown in Fig. 4i, demonstrated that VPS hydrogels facilitated recovery in terms of TEWL and hydration levels compared with the original hydrogels. Given that both hydrogels are based on PVA, these results indicate that the enhanced air permeability introduced by the VPS strategy effectively mitigates the negative impact on skin health typically associated with prolonged wear.As well as skin comfort and health, VPS hydrogels show potential for bioelectronic applications, such as electrocardiogram (ECG) monitoring systems (Fig. 4j,k). Traditional ECG recording requires minimal movement for accurate data collection, but continuous monitoring must accommodate human activity, for which sweat accumulation can compromise signal quality owing to electrode detachment and changes in skin–electrode impedance. Recent efforts47,48,49 introduced a micro-tunnel system as an elegant solution for sweat permeability. However, a material with intrinsic high permeability to both air and liquids offers a more straightforward and efficient approach to simultaneously meet the critical demands of electrophysiological signal transmission and mass exchange. By replacing the hydrogel layer on commercial Ag/AgCl electrodes with ionically conductive VPS hydrogels (Fig. 4j; method presented in Supplementary Information section 3.4), we integrated this material into an ECG monitoring system for testing during cycling activity (Fig. 4k; method presented in Methods). Overall, ECG electrodes with conductive VPS hydrogels demonstrated better signal quality during workout tests. Notably, although the VPS-hydrogel-based electrodes delivered signal quality comparable with commercial electrodes under resting conditions (Fig. 4l), they exhibited greatly improved stability during and after a 10-min cycling test (Fig. 4m and Supplementary Fig. 11), maintaining a high-quality ECG profile suitable for detailed physiological analyses, including heart rate and Q–T interval measurements. This improvement is probably the result of the efficient air and water exchange of VPS hydrogels, which effectively mitigates signal instability caused by sweat build-up.To further evaluate the potential of VPS hydrogels for long-term biomedical applications, we conducted extended ECG monitoring over 10 days. The results demonstrated that, owing to their low skin contact impedance (Supplementary Fig. 12), low skin irritation (Supplementary Figs. 13 and 14), good anti-dehydration capability (Supplementary Fig. 15) and stable air permeability during prolonged on-skin use (Supplementary Fig. 16; method presented in Methods), VPS-hydrogel-based electrodes consistently provided reliable ECG signals throughout the entire duration, even with several workout periods involved (Supplementary Figs. 17–19, Supplementary Videos 5–7 and further discussion in Supplementary Information section 1.12). Specifically, Fig. 4n presents the ECG signal and corresponding heart rate profile on day 10, confirming the stable performance of the VPS-hydrogel electrode after 10 days of use. To assess signal quality, we analysed four activities: sleep, walking, workout and working (Fig. 4o). The ECG signals remained clear, with distinct T waves, QRS complexes and P waves, demonstrating the reliability of the patch for long-term electrophysiological monitoring without activity-related interference. With the combination of breathability, long-term comfort, consistent signal quality and cost-effectiveness, VPS-hydrogel-based electrodes offer distinct advantages over existing technologies, in both commercial products and laboratory research (further details provided in Supplementary Information section 1.13 and Supplementary Table 8).As well as epidermal applications, the unique, stable coexistence of air-rich and water-rich soft domains in VPS hydrogels enables a set of functionalities that are inaccessible to conventional hydrogels. For instance, conventional hydrogels show minimum ultrasound contrast in water (Supplementary Fig. 20a,b; method presented in Methods), whereas VPS hydrogels give clear ultrasound images owing to their strong impedance mismatch with water enabled by the stable aerogel networks. Furthermore, the stable aerogel networks also enable remote and pronounced actuation of the VPS hydrogels in water under applied acoustic stimulation (Supplementary Fig. 20c–e; method presented in Methods; Supplementary Video 8). By contrast, common hydrogels in water demonstrate negligible deformation under identical acoustic stimulation.DiscussionThe VPS hydrogel presents a general and effective strategy for converting hydrogels into a highly air-permeable form while maintaining high water content. This unique combination of high water content and air permeability makes it an ideal candidate for diverse biomedical applications, particularly those requiring efficient air exchange and a moist environment. The superior wear comfort demonstrated in our user study promises to shift the model of healthcare monitoring wearables from daily to continuous weekly monitoring.Although the present VPS hydrogel is not intrinsically adhesive, future iterations could incorporate wet-adhesion mechanisms, such as supramolecular interactions and interfacial reactive groups50, enabling adhesive air-permeable hydrogels. The air permeability of VPS hydrogels can be further increased by incorporating higher aerogel contents, which may expand their use in breathability-driven hydrogel interfaces, particularly for wound care8,9 and living materials10,11,12. Overall, we foresee VPS hydrogels as transformative materials across various healthcare applications, particularly because of their ready integration with a wide range of biomaterials/bioelectronics fabrication techniques and scalable production methods.MethodsSample preparation of VPS hydrogelsA typical sample preparation process involves two key stages: (1) preparing a stable suspension of aerogel particles and (2) inducing VPS and filling with hydrogels.Stage 1: to suspend the aerogel particles in water and facilitate VPS in subsequent steps, amphiphilic triblock-copolymer Pluronic F-127 (surfactant, Mw approximately 12 kDa), hydrophilic PAA (non-adsorbing polymer, Mw approximately 4,000 kDa) and hydrophilic PVA (suspension thickener, Mw approximately 146 kDa) were added while mixing superhydrophobic aerogel particles with water. In a typical procedure, 3.2 g of 10 wt% PVA solution, 3.2 g of 1 wt% PAA solution, 48 mg of 20 wt% F-127 solution and either 240 mg (denoted as 2 wt% aerogel content; Supplementary Table 5) or 480 mg (denoted as 4 wt% aerogel content; Supplementary Table 5) of aerogel particles were combined in a Thinky AR-100 mixer and mixed for 2 min. Subsequently, an extra 5.4 g of 1 wt% PAA solution was added, followed by another 2-min mixing. The resulting aerogel particle suspension is a white, viscous emulsion with low fluidity.Stage 2: to induce VPS for the aerogel network, the aerogel suspension was poured into a customized acrylic mould sandwiched between two rigid acrylic plates with holes and a layer of dialysis tubing (molecular weight cut-off = 12–14 kDa). The VPS was triggered by immersing the samples into a 26 wt% NaCl solution at 60 °C. After varying immersion times, the samples were frozen at −5 °C for 3 h to induce physical crosslinking and then rinsed in deionized water three times (2 h per rinse). This process yielded a soft yet elastic VPS aerogel network. To fill the VPS aerogel network with polymers to yield VPS hydrogels, the dialysis tubing was replaced with new tubing (molecular weight cut-off ≈ 300 kDa), much higher than the molecular weight of the polymer used for filling. The encapsulated samples were then immersed in pre-gel solutions of PVA, gelatin, alginate, agarose or chitosan for 12 h. Finally, gelation was induced as described in Supplementary Information section 3.1, yielding VPS PVA, gelatin, alginate, agarose or chitosan hydrogels. After preparation, all samples were swollen in PBS solution three times before use. The detailed set-ups for VPS and filling have are illustrated in Supplementary Fig. 21. All samples used for the air-permeability measurements (including VPS gelatin, alginate, agarose and chitosan hydrogels in Fig. 3c) were prepared with a 4 wt% aerogel content.Oxygen permeability testsThe oxygen permeability of hydrogels was tested with the polarographic method following the instructions of ISO 18369-4:2017 with a Rehder single-chamber system. Before the tests, the hydrogels were swollen in PBS buffer for 12 h. During the test, to keep the hydrogels moistened, the tests were carried out at 95% relative humidity throughout. Also, the testing sample was sandwiched by lens cleaning paper, which serves as the ‘aqueous bridge’ between the sample and electrode. The signal measured by the polarographic method is the current generated by an oxygen sensor over time I(t), in which t is time in minutes. The current at a steady state Is is defined as the I(t) at t (min) when \(\frac{I(t)}{I(t+5)} < 0.995\). As such, the preliminary oxygen permeability Dkpre is defined as$${{Dk}}_{{\rm{pre}}}=\frac{0.278T({I}_{{\rm{s}}}-{I}_{{\rm{d}}})}{A}$$in which T is the thickness of hydrogel (mm), Id is the dark current generated by the oxygen sensor when the oxygen level is zero (A) and A is the area of the cathode (cm2).To obtain the corrected oxygen permeability of hydrogel samples, two more effects are required to be considered, including edge effects and boundary effect. The edge effects originate from the geometry of the electrode and hydrogel sample. For flat cathode and hydrogel samples, the oxygen permeability after considering edge effects Dkedge is expressed as:$${{Dk}}_{{\rm{edge}}}=\frac{{DT}}{D+1.89T}{{Dk}}_{{\rm{pre}}}$$in which D and T are the diameter and thickness of the hydrogel, respectively.To eliminate the boundary effects raised from the inhomogeneity at the sample–air and sample–electrode boundary, we would plot the reciprocal transmissibility \(\frac{T}{{{Dk}}_{{\rm{edge}}}}\) against T and the slope of the least squares regression line is \(\frac{1}{{{Dk}}_{{\rm{corr}}}}\), in which Dkcorr represents the oxygen permeability after ruling out the edge and boundary effects.Because the sample thickness of commercial products are determined, the oxygen permeability of these products (Fig. 1c) cannot eliminate the boundary condition by thickness extrapolation. Therefore, to compare the oxygen permeability between the VPS hydrogel and commercial products, we used the nominal oxygen permeability, which corresponds to the value after edge correction. The oxygen permeability together with sample thickness are presented in Supplementary Table 3.Micro-CT characterizationThe VPS hydrogel with 2 wt% aerogel content was selected for micro-CT characterization, performed using the ZEISS Xradia 620 Versa X-ray microscope. The VPS hydrogels were punched into 3-mm-diameter rounds and encased in a Kapton tube, sealed at both ends with epoxy resin, for micro-CT sampling. These samples were left stationary for 12 h to allow for the relaxation and stabilization of their elastic microstructures. We performed data analysis using the Dragonfly software package. For detailed network analysis, for each structure-development time, three regions of interest (volume equal to 750 × 750 × 750 μm3) were selected. Given the lower density of aerogels relative to water, aerogel particles manifest as dark spots in micro-CT scans. To accurately delineate areas occupied by these particles, the darkest 5% of voxels were initially selected and subsequently dilated to cover roughly 20% of the volume, minimizing the impact of noise on microstructure reconstruction. Connectivity and Euler characteristic numbers were derived from the domains of selected voxels. The OpenPNM module in Dragonfly facilitated the analysis of pore structures, emphasizing pores wider than 10 μm, approximating the size of aerogel particles. Unless specified otherwise, default settings were used throughout the analysis.WVTR measurementThe WVTR was measured following the ASTM standard E96M-16 water method. Samples of polyurethane tapes, silicone tapes, hydrocolloid patches, pristine PVA hydrogel and VPS PVA hydrogel (4 wt% aerogel content) were first cut into round shapes with a diameter of 2 cm. These samples were then attached to the window of a diffusion cell containing 6 ml of deionized water, leaving a 1-mm air gap from the sample surface. The diffusion cells were stored in laboratory ambient environment with stable, controlled humidity at 67% and 21 °C for a duration of 72 h. The weight of the diffusion cells was recorded hourly. To isolate the true water vapour transmission through the sample from any intrinsic water loss of the hydrogel, we measured the mass of the hydrogel before and after the test and corrected the total chamber mass change accordingly. WVTR was calculated using the equation \({\rm{WVTR}}=\frac{({w}_{2}-{w}_{1})}{{At}}\), in which t represents the sample thickness, w1 and w2 represent the initial and final corrected masses of the diffusion cell, respectively, and A denotes the area available for water vapour transmission. Note that, because the WVTR test was conducted under the ambient environment, the oxygen conditions and pressure closely reflect performance in practical application environments.Mechanical testsTensile testMechanical tests were conducted using a UStretch apparatus (CellScale) equipped with an 8.9-N load cell, operating at room temperature (22 °C). Samples were of approximate dimensions 15 mm × 6 mm × 0.8 mm and the loading rate was set at 0.1 s−1. During loading, force (F) and gauge displacement (ΔL) were recorded by the testing machine. Nominal stress (σ) was calculated using the formula \(\sigma =\frac{F}{{Wt}}\), in which W represents the undeformed sample width and t denotes the sample thickness. Strain (ε) was determined as \(\varepsilon =\frac{\Delta L}{{L}_{{\rm{i}}}}\), with Li representing the undeformed sample initial length. The Young’s modulus of the tested sample was calculated by \(E=\frac{\sigma }{\varepsilon }\).The free-standing samples, including the VPS aerogel network (before filling with PVA), VPS PVA (after filling with PVA) and pristine PVA, were used for mechanical tests. To secure the samples during testing, they were clamped between grooved jaw clamps under mechanical pressure. Furthermore, images were captured during loading to verify stretch measurements and ensure that no slipping occurred.Cyclic tensile fatigue testCyclic tensile fatigue tests were performed at 20% strain and 0.24 Hz for 10,000 cycles using the Instron 5944 materials testing system equipped with a 50-N load cell. Samples were of approximate in-plane dimensions 15 mm × 6 mm and the thickness of each sample was measured individually for stress calculation. Force–displacement data were continuously recorded to assess tensile mechanical stability (Supplementary Fig. 9a). To maintain the hydrogel in a stable hydrated state, all tests were conducted inside a custom-built plastic humidity chamber connected to a humidifier and an Inkbird Digital Humidity Controller IHC-200 humidistat. The relative humidity was maintained above 95% throughout the entire 11.5-h test.Cyclic compression fatigue testCyclic compression fatigue tests were performed at 20% compressive strain and 0.46 Hz for 10,000 cycles using an Instron 5944 materials testing system equipped with a 50-N load cell. Samples had a disc geometry of 20 mm in diameter and 1.54 mm in thickness. Force–displacement data were continuously recorded to assess compressive mechanical stability (Supplementary Fig. 9b). To keep the hydrogel in a stable hydrated state, all tests were conducted inside the same custom-built plastic humidity chamber throughout the entire 6-h test.Cyclic shear rheological testCyclic shear rheological tests were conducted on a TA Instruments Discovery HR-2 rheometer using a parallel-plate geometry with a gap of 1,320 µm. Measurements were performed in time-sweep mode under oscillatory shear at 2% strain and 1 Hz for 10,000 cycles. Samples had a disc geometry with a diameter of 20 mm and an initial thickness of about 1.4 mm. The evolution of the storage modulus was monitored to assess shear fatigue resistance (Supplementary Fig. 9c). To keep the hydrogel in a stable hydrated state, the sample was enclosed with the rheometer solvent-trap cover. A small amount of deionized water was added to the solvent reservoir/enclosed chamber, without direct contact with the sample, to generate a water-saturated humid environment around the sample. The cover remained sealed throughout the 2.8-h measurement.Human testsAll human experiments were conducted by protocols approved by the Committee on the Use of Humans as Experimental Subjects, Massachusetts Institute of Technology (protocol number 2302000873R001) and guidelines were followed. Informed consent from all participants was obtained before inclusion in this study. Unless otherwise specified, the VPS hydrogel used for the human tests was the anti-dehydration VPS hydrogel described in Supplementary Information section 3.2.Wear tests and skin physiological measurementsWear tests were performed to evaluate skin conditions after prolonged contact with the VPS hydrogel and pristine PVA hydrogel (Supplementary Fig. 23). Hydrogel patches were attached to the forearm of each participant and worn for 24 h. After patch removal, skin hydration and TEWL were measured at 0, 5, 10, 15, 20, 25, 30, 35, 40, 45, 50, 55, 60, 120 and 180 min post-removal. At each time point, three readings were taken from different sites within the treated skin area. Skin hydration was measured using a Bio-Therapeutic bt-analyze skin moisture analyser and TEWL was measured using a Delfin VapoMeter. Before applying the hydrogel patches, ten measurements were collected from different sites on untreated forearm skin to establish the baseline range of healthy skin conditions. This baseline enabled comparison of post-wear skin responses while accounting for participant-specific differences in natural skin physiology. A total of n = 2 participants were included in the skin physiological tests, with three independent measurements of skin hydration and TEWL collected for each participant.To evaluate changes in the air permeability of the VPS hydrogel during prolonged wear, a 7-day wear test was performed and the nominal air permeability was measured on days 1, 3, 5 and 7 (Supplementary Fig. 16). A total of n = 1 participant was included in this wear test, with three independent measurements conducted. To evaluate potential long-term skin irritation caused by the VPS hydrogel, an extra 10-day wear test was performed (Supplementary Fig. 13).ECG recording and exercise protocolsVPS-hydrogel electrodes were prepared according to the procedure described in Supplementary Information section 3.4. A commercial breathable fabric-backed electrode (LEPU Medical disposable medical-grade ECG monitoring electrode) was used as the control. Fabric backing was intentionally used in both groups to isolate and emphasize the role of the hydrogel in maintaining stable skin contact, enabling reliable bioelectrical signal acquisition and improving wearing comfort, particularly under challenging conditions such as heavy perspiration. All ECG data were recorded using a Wellue ER1-LW wireless ECG event recorder.Volunteer experiments were conducted to evaluate the effect of sweat accumulation on ECG signal quality. To ensure consistency, participants were instructed to maintain a similar workout intensity across all tests. The workout protocol was as follows: participants rested for 5 min, cycled for 10 min at a constant intensity of 80 rpm and ramp level 6 and then rested for an extra 5 min. ECG signals were recorded continuously throughout the 20-min test period. A total of n = 3 participants were included in these tests, with two independent tests conducted for each participant.To evaluate the effect of prolonged wear on ECG signal quality, three 10-day ECG tests were conducted. Participants performed indoor cycling on days 4, 7 and 10. All workout tests followed a standardized protocol: participants cycled for 15 min at a consistent intensity of >80 rpm and then rested for an extra 5 min. No restrictions were imposed on the participants’ daily activities, including sleep, social interactions or exercise, with respect to activity type, timing or duration. In each test, the same pair of VPS-hydrogel electrodes was used throughout the entire 10-day period. ECG data were continuously recorded each day over the 10-day period. Data collection was paused for approximately 30 min each day to allow data retrieval and device charging. During these interruptions, the ECG patch, including the VPS-hydrogel electrodes and adhesive backing, remained attached to the skin and the same patch was used continuously throughout the 10-day test. Throughout the test, the device and the two VPS-hydrogel electrodes were exposed to ambient air, except during showering, when the device was protected with 3M Tegaderm film to prevent water ingress. ECG data were first processed using the ECG Analysis System provided by Wellue and further analysed in MATLAB.Electrical testsTo measure electrical conductivity, hydrogel samples were prepared with dimensions 50 mm length, 5 mm width and 1 mm thickness. A 34450A multimeter (Keysight Technologies) was used for four-wire resistivity measurements. Gold-plated copper electrodes were attached to the surface of the hydrogel sample. To ensure good contact, two glass plates were gently pressed against the hydrogel and electrodes. The electrical conductivity (σ) was calculated using the formula \(\sigma =\frac{{IL}}{V{WT}}\), in which I represents the current through the sample, L is the spacing between the voltage-measuring electrodes, V is the measured voltage, W is the sample width and T is the sample thickness.For electrochemical impedance measurements, hydrogel samples with dimensions 10 mm length, 10 mm width and 1 mm thickness were used. An Autolab PGSTAT204 (Metrohm) was used for impedance potentiostatic measurements. The tests were conducted in an electrochemical cell configured with the hydrogel sample as the working electrode, a Pt sheet as the counter electrode, an Ag/AgCl electrode as the reference electrode and PBS as the electrolyte. The impedance was measured over a frequency range 10−1 Hz to 105 Hz, applying a sine wave voltage with an amplitude of 0.01 VRMS.Skin contact impedance was measured using the same VPS-hydrogel electrodes (fabrication presented in Supplementary Information section 3.4) as those used in the ECG test. The two electrodes were attached to the forearm skin with a centre-to-centre distance of 5 cm for 10 days. Throughout the test, the VPS-hydrogel electrodes were exposed to ambient air, except during showering, when the device was protected using 3M Tegaderm film to prevent water ingress. An Autolab PGSTAT204 (Metrohm) was used for impedance potentiostatic measurements over a frequency range 1 Hz to 106 Hz, applying a sine wave voltage with an amplitude of 0.1 VRMS.Acoustic testsThe ultrasound transducer used for actuation was a custom device fabricated from modified PZT4 ceramic, featuring a 20-mm aperture and a focal length of 13-mm. Hydrophone measurements (HGL-0400, Onda) were performed to characterize the acoustic output before the actuation experiments. During actuation, the transducer was fixed in position and the hydrogel-based acoustic actuator (5 cm length × 2 cm width × 1.5 mm thickness) was placed at the acoustic focus under hydrophone guidance. The applied acoustic pressure was varied from 1.82 MPa to 10.94 MPa by varying the AC voltage amplitude applied on the ultrasound transducer.The imaging experiments were carried out using a Vantage 256 system (Verasonics) equipped with an L22-14vXLF linear array transducer. Compound plane-wave imaging with nine angles was used as the imaging method. For imaging, hydrogel samples were prepared in circular, triangular and square geometries, in which the circular samples had a diameter of 6 mm and both the triangular and square samples had side lengths of 6 mm. These samples were placed in the elevation focal region of the transducer array.
Air-permeable hydrogels through viscoelastic phase separation of aerogels - Nature
Viscoelastic phase separation is used to fabricate non-collapsible, air-rich networks in high-water-content hydrogels containing silica aerogel beads, allowing air to permeate through the material and enabling a tenfold increase in oxygen permeability over pristine hydrogels.
9,484 words~43 min read