Short answer
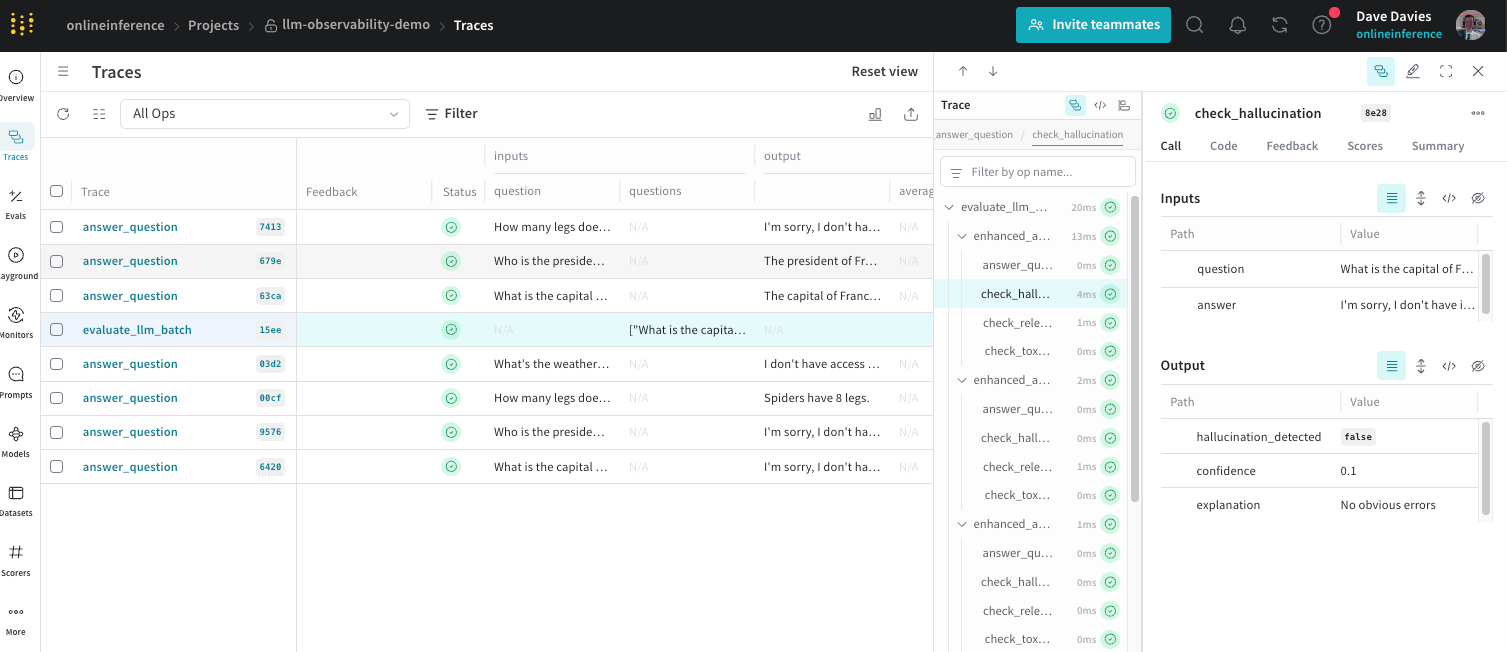
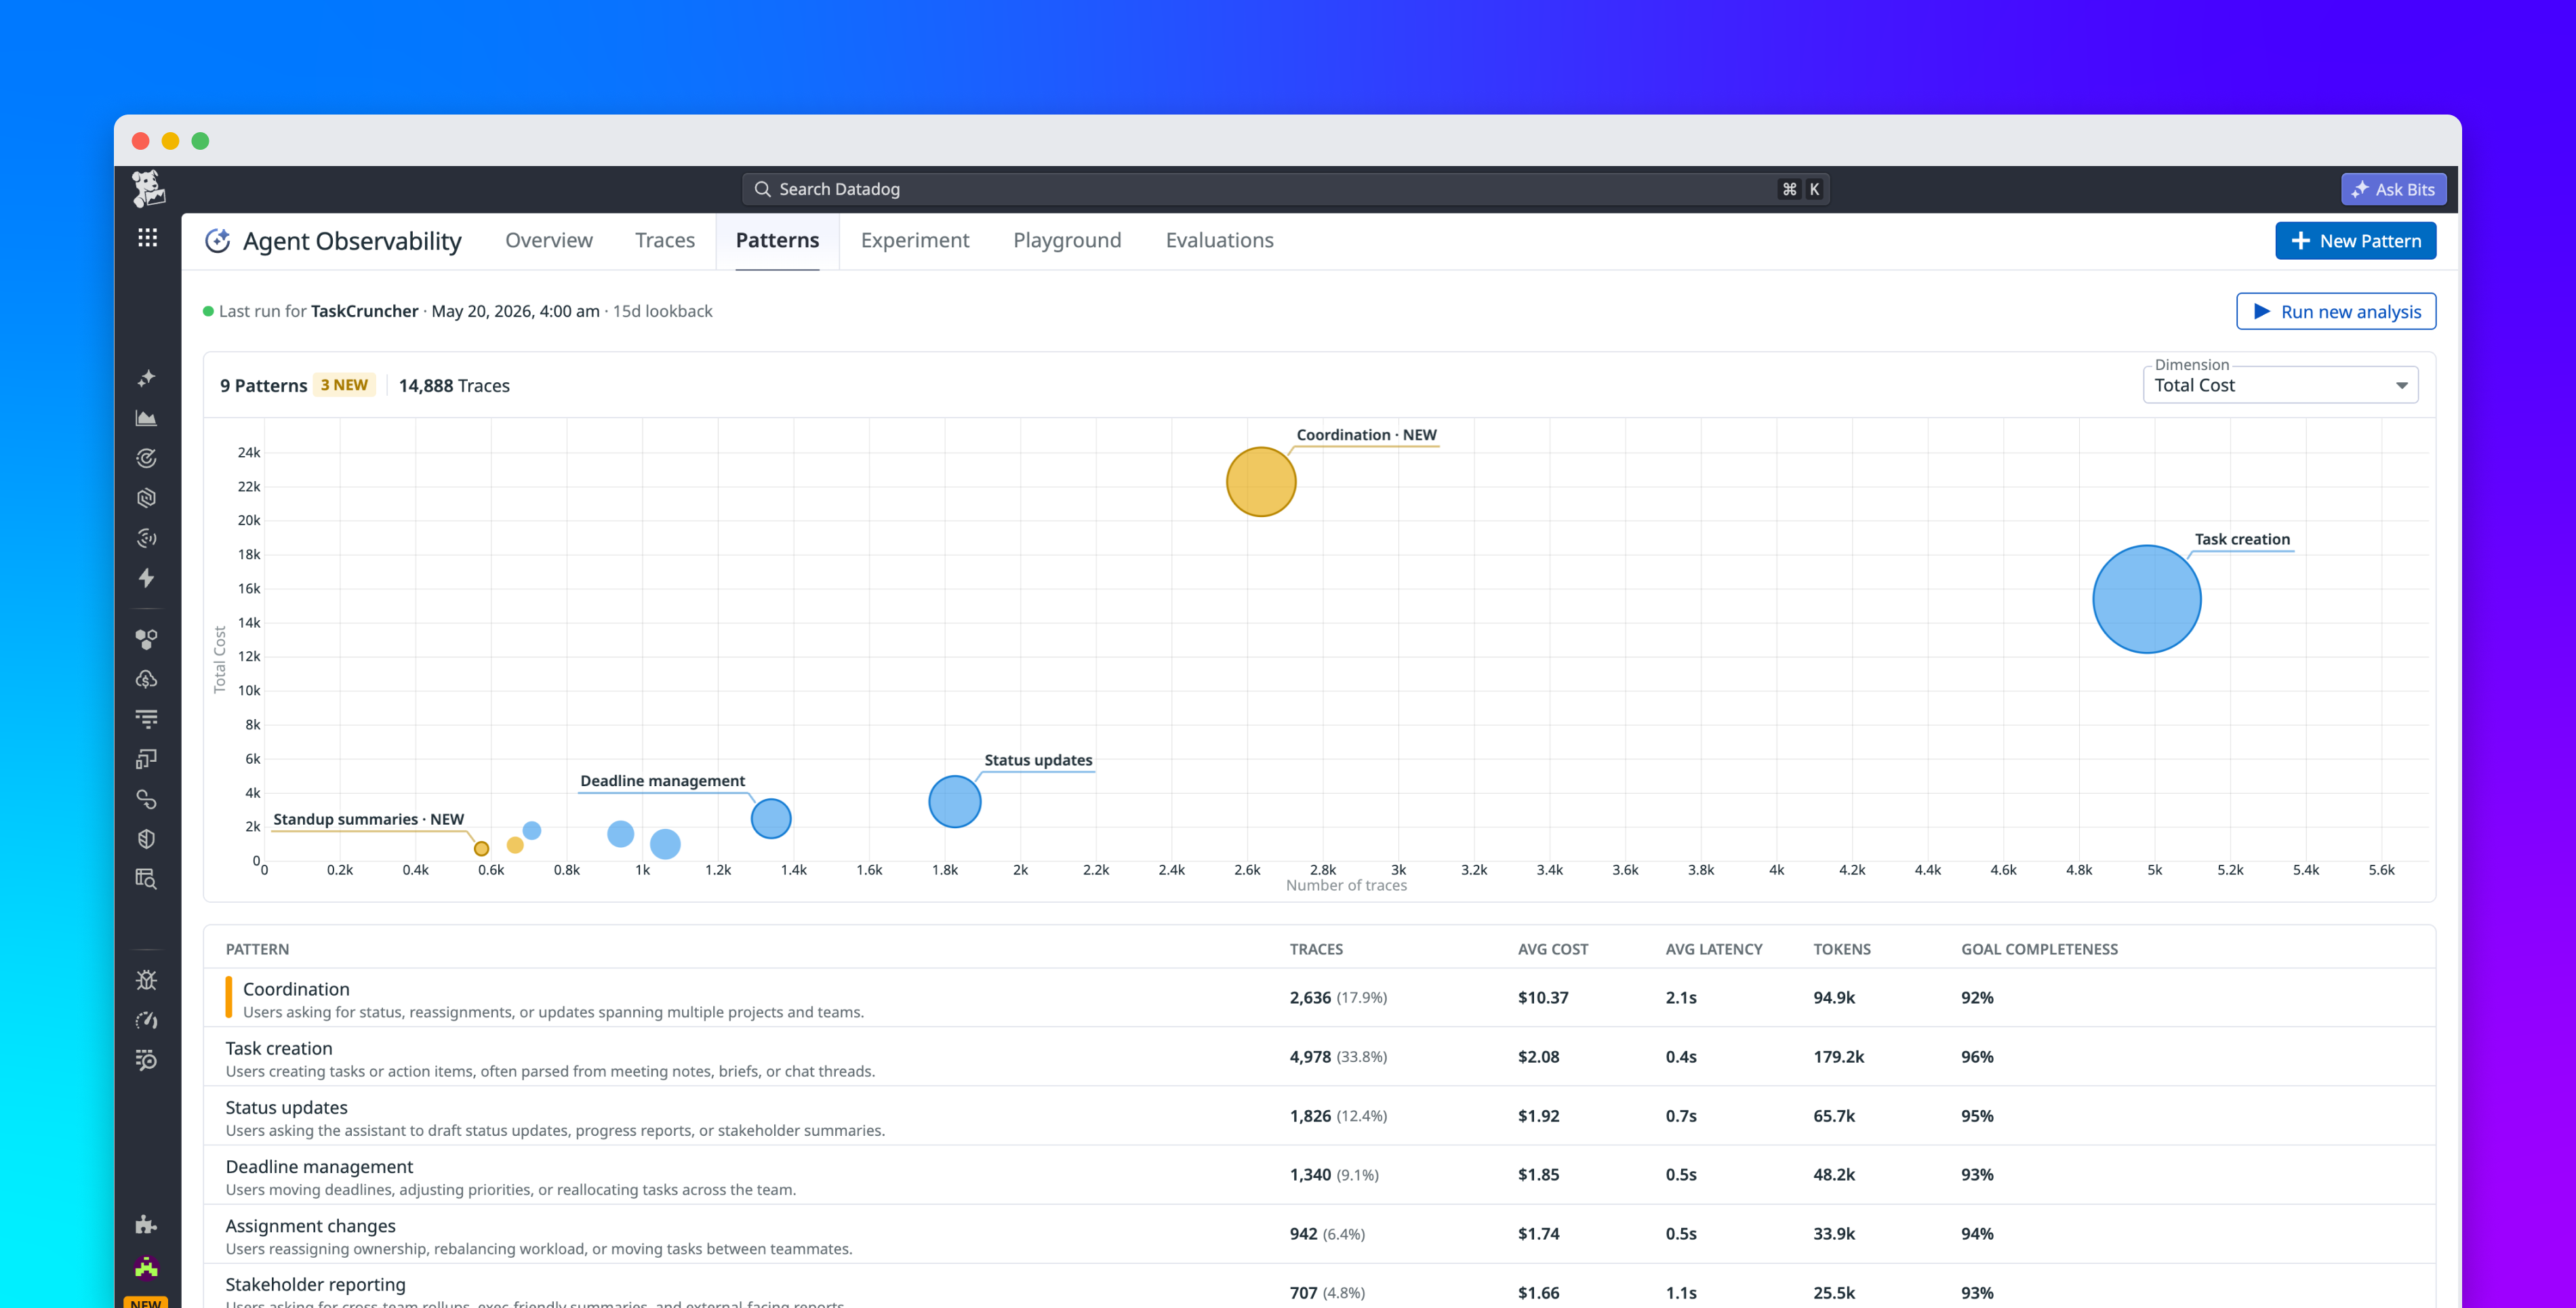
LLM observability is runtime visibility into an LLM or agent system: the traces, metrics, and logs that let you see what a model and its agent loop actually did on a given request, so failures are diagnosable in production rather than mysterious. A trace records each step — every model call, tool call, and retrieval — with its inputs, outputs, tokens, latency, and cost. It answers what happened on this run.
This is not the same as evaluation, which measures whether outputs are correct across a dataset. Observability tells you what the system did; evaluation tells you whether it was good. You need both, and this page covers the first.
The trace of one production run — every model call, tool call, and retrieval it made — is what layer 8 of the AI quality stack adds: observability. Evals and guardrails only tell you whether a run should have passed or been blocked; when one didn't, the trace is what shows you why, catching failures your eval set never sampled and your guardrails never flagged.
Part of the AI quality stack — the layered gate chain for knowing your LLM is delivering quality.