When you deploy an LLM-powered application, you make assumptions about how users will interact with it. In practice, production traffic rarely matches those assumptions. Users ask questions outside the intended scope, shift goals mid-conversation, and develop workflows the application was never designed to support. At the same time, patterns that worked well at launch can quietly degrade: Costs creep up in specific interaction categories, evaluation scores drop for a subset of requests, or a cluster of behavior that was once predictable starts growing faster than everything else.
Individual trace review can surface that something is wrong, but it can’t tell you which behaviors—including what types of questions users are asking, and what kinds of outputs your agents generate—are associated with the regression, or reveal interaction patterns you didn’t know existed in the first place. The result is that teams end up investigating symptoms without a clear view of the underlying user behavior driving them.
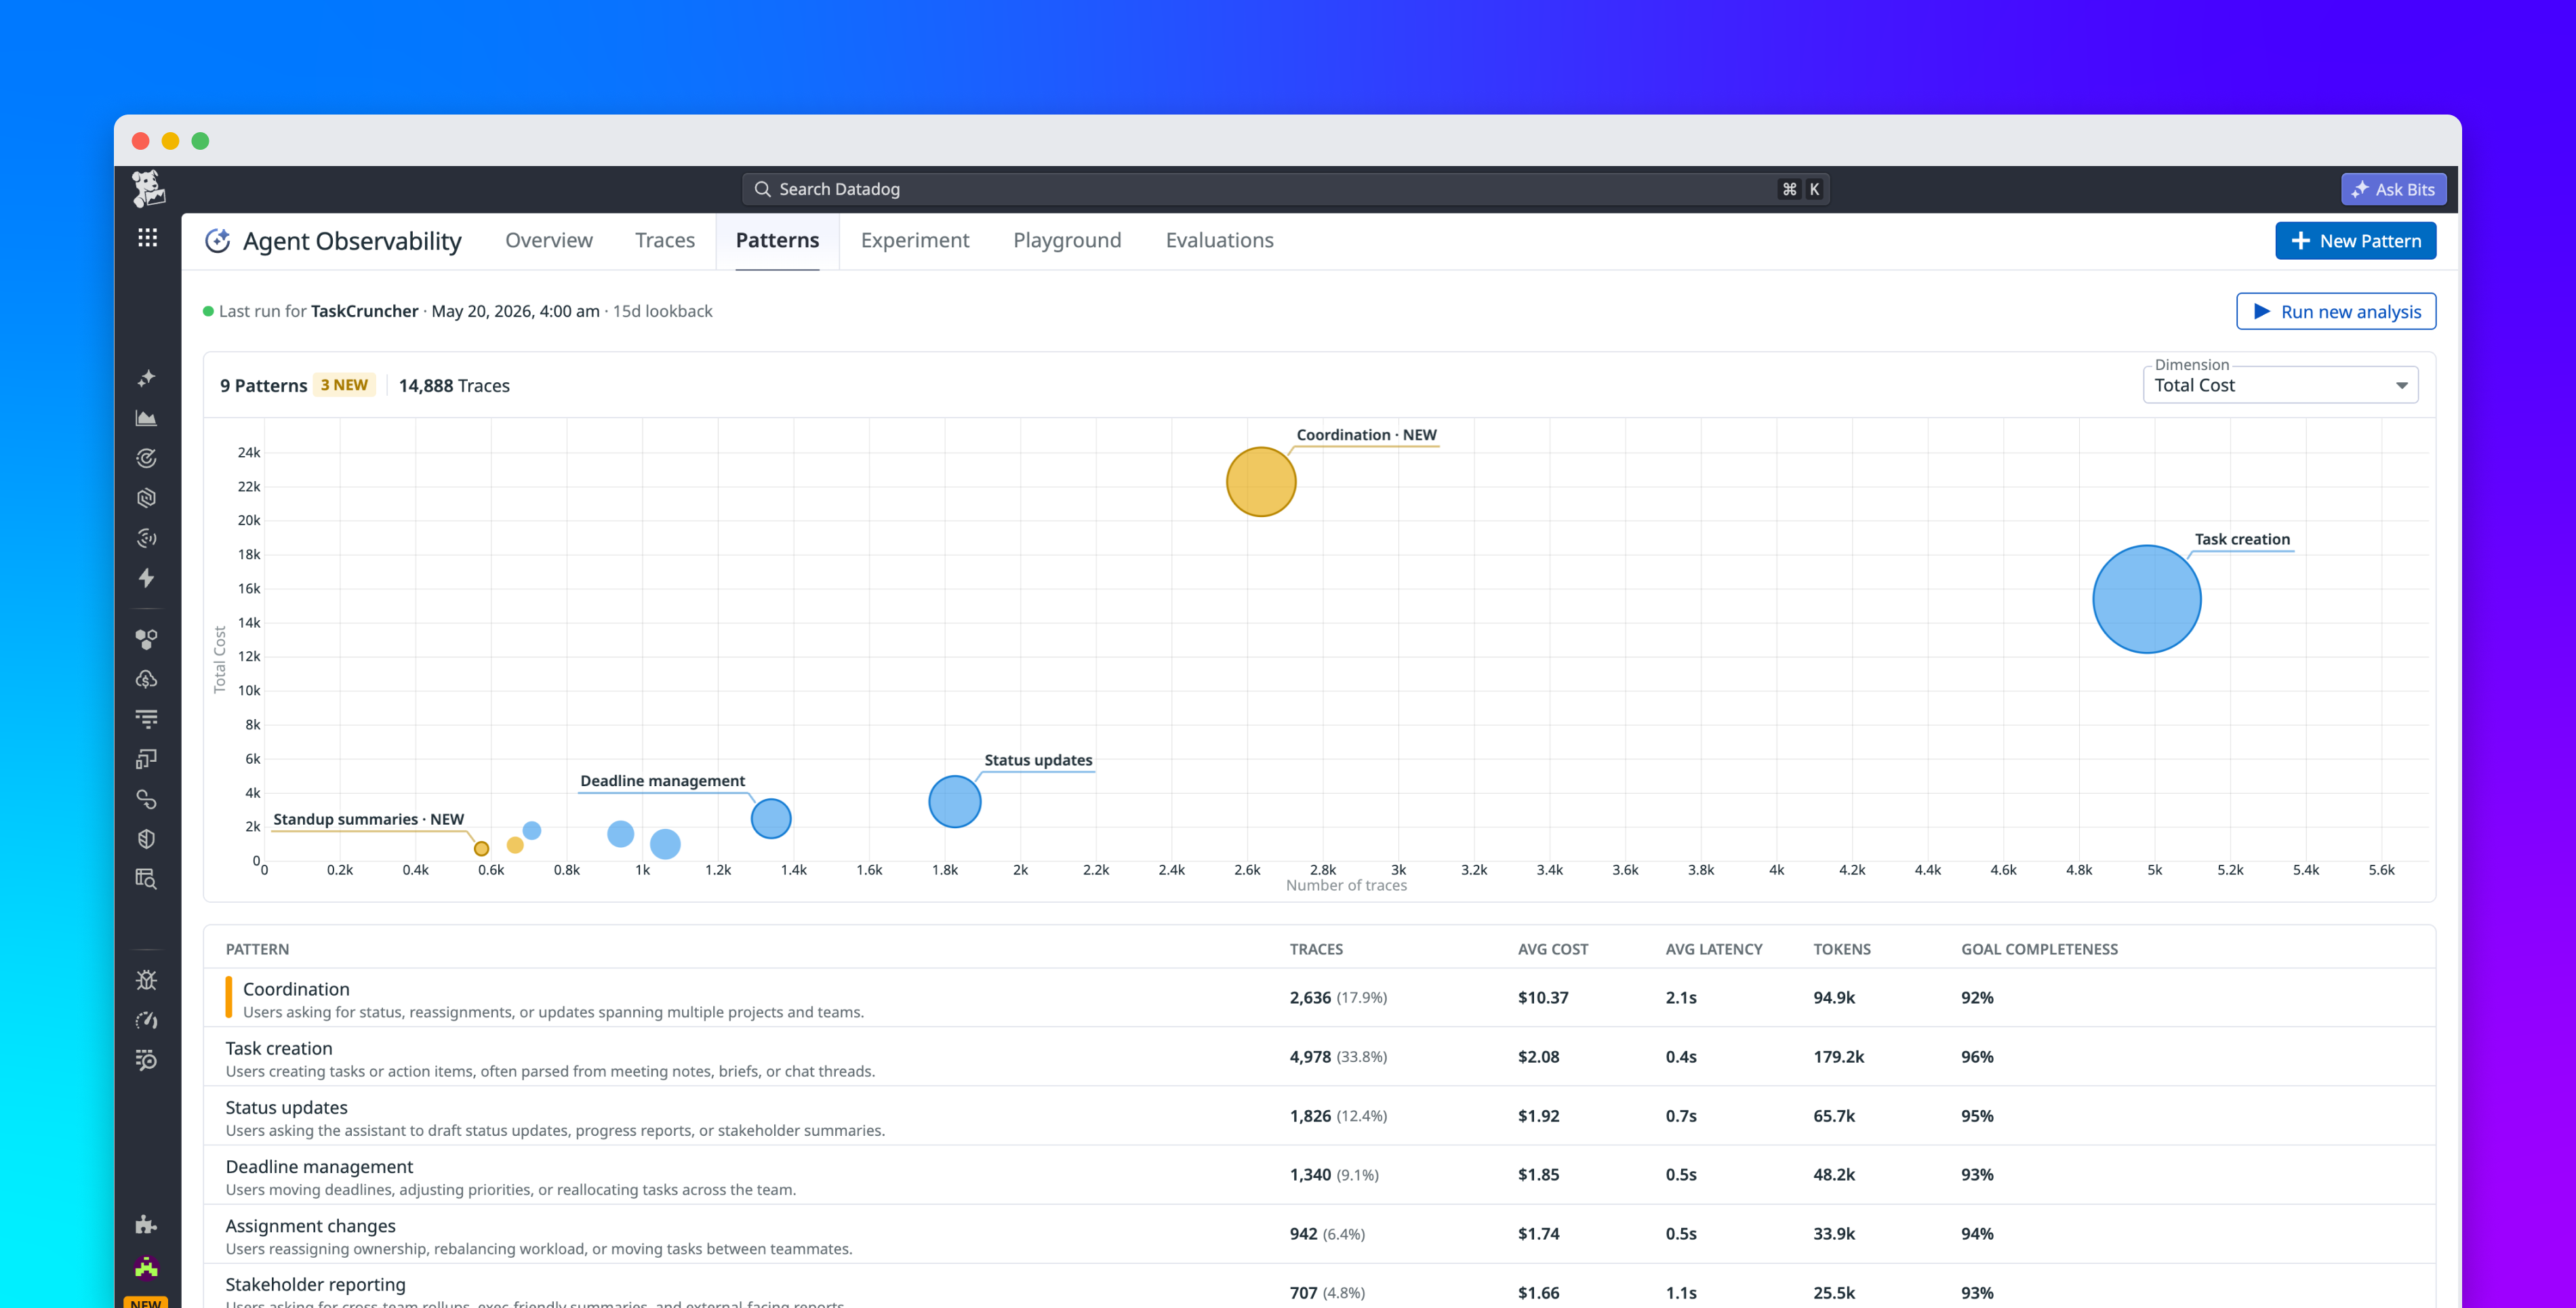
Patterns in Datadog Agent Observability gives you that view, helping you answer two important questions about production traffic: What are users trying to do that the application was not designed for, and what behaviors have meaningfully changed over time? Patterns automatically clusters production interactions into hierarchical topics that give you an interpretable view of your agents’ production behavior, including user input and agent responses, without requiring predefined categories or manual labeling. This enables you to see actual trends in how users are engaging with your application and how your agents are behaving, including workflows, tool calls, and other behaviors you didn’t anticipate. Each cluster surfaces cost, latency, error rate, and evaluation coverage benchmarked against your other patterns, so the interactions driving quality and cost issues are immediately visible.