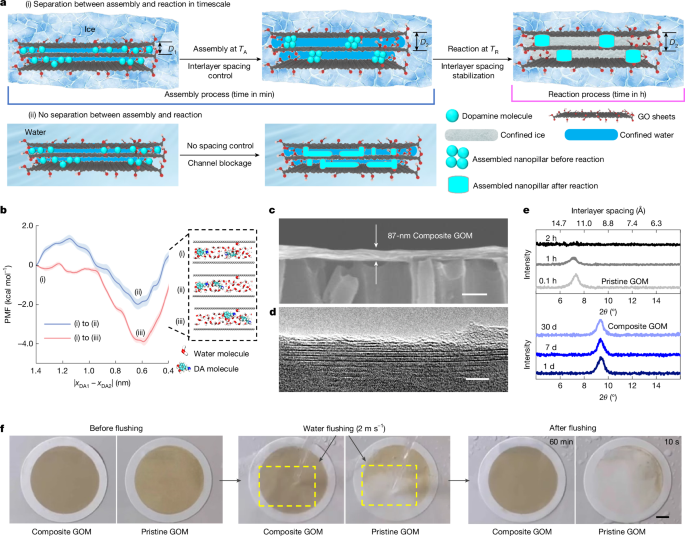
MainStacked graphene oxide membranes (GOMs), with their unique structures of carbon-based channels that allow highly efficient water transport and tunable subnanometre interlayer spacing4,7,8, have emerged as nature-inspired materials for applications in nanofluidics and environmental sciences7,8,10,11. To emulate biological subnanopores and to achieve both high water throughput and selective ion sieving12, it is crucial to maintain the structural stability and accuracy of the interlayer spacing of GOMs in aqueous environments13,14. Over the past decades, various methods have been explored to modulate and stabilize the interlayer spacing of GOMs7,8,13,15. Notably, covalently crosslinking the oxygen-containing functional groups on adjacent graphene oxide (GO) sheets with intercalated molecules or nanomaterials has effectively stabilized the interlayer spacing of stacked GOM structures, which nevertheless results in a single fixed spacing determined by the geometry of the specific crosslinker6,16. Furthermore, the π–cation interaction between metal ions and GO sheets has been used to tune the interlayer spacing of GOMs by altering the types of cation, but the distinct sizes of the metal ions lead to discrete spacing values7. Therefore, achieving continuous and robust spacing regulation of GOMs at the subangstrom scale for universal ion sieving remains a big challenge, which has hindered the development of highly efficient water–salt separation and accurate cation-ion-sieving systems1,7.Here we report a dopamine (DA) molecular assembly and reaction timescale separation strategy, in which the assembly process (occurring within minutes) yields DA nanopillars for regulating the interlayer spacing while the reaction process (occurring over hours) yields the polydopamine (PDA) nanopillars bonded with GOs for stabilizing the interlayer spacing of the composite GOMs. Specifically, a key step in the GOM fabrication is controlling the experimental temperature to freeze bulk water into ice while maintaining the nanoconfined water between GO sheets in a liquid state as illustrated in Fig. 1a. The retained mobility of nanoconfined liquid water facilitates the assembly of DA molecules within the interlayer space, where the assemblies act as DA nanopillars to finely adjust the interlayer spacing (D). After impregnating the interlayer space of the pristine GOM with the DA molecules (details in Supplementary Fig. 1), the processed GOM containing the DA molecules is then kept at a controlled temperature for assembly, TA (for example, −10 °C) (left-top panel of Fig. 1a). During this assembly process, bulk ice forms around the GOM to prevent swelling (details in Supplementary Fig. 2), while the nanoconfined water between GO sheets remains mobile as the melting temperature of the bulk ice is higher than that of the nanoconfined ice. The diffusion of nanoconfined liquid water promotes the assembly of DA molecules into DA nanopillars of a targeted height to achieve the desired interlayer spacing within minutes, thereby tuning the GOM interlayer spacing (centre-top panel of Fig. 1a). Afterwards, the system is rapidly cooled to a lower reaction temperature TR (below −30 °C) to convert the nanoconfined liquid water into nano-ice (detailed in Extended Data Fig. 1 and Supplementary Figs. 3 and 4), halting water molecule diffusion and the assembly process. Meanwhile, the polymerization of the DA molecules and covalent bonding between the polymerized DA and functional groups on GO surfaces continue in the nanoconfined-ice environment over hours, fixing the interlayer spacing (right-top panel of Fig. 1a). Note that without temporal separation of the DA assembly and DA polymerization reactions—whether relying solely on reactions or allowing assembly and reaction to occur simultaneously—the interlayer spacing would be difficult to control or tune. In either case, the reacted DA molecules would be more likely to obstruct the spacing channels, as illustrated in the bottom panel of Fig. 1a.Fig. 1: Timescale separated assembly and reaction strategy for preparing composite GOMs and characterizations of the GOMs.a, Scheme of modulating and stabilizing the composite-GOM interlayer spacing (D1 to D2). The DA molecules are marked as light-blue balls. The light-blue cylinders represent the postreaction PDA nanopillars. The grey-black sheet-like images represent GO sheets. The blue strips represent confined water. The grey cracked strips represent confined ice. The blue blocks with fragmented cracks represent bulk ice, and the blue blocks without fragmented cracks represent bulk water. b, The relationship between the computed potential of mean force and the collective variable (the distance between two DA molecules, |xDA1 − xDA2|). In (i), one DA is near an oxygen-containing group. From (i) to (ii) (blue line), the DA near the oxygen-containing group is pulled towards the other DA. From (i) to (iii) (red line), the distant DA is pulled towards the oxygen-containing group. The right panel provides the schematic representation of configurations (i), (ii) and (iii). c,d, Cross-sectional scanning electron microscopy (c) and TEM (d) images of selected area of the composite GOM. e, Comparison of anti-swelling properties of pristine GOMs (top panel) and composite GOMs (bottom panel) by XRD patterns. Time of immersion with water: composite GOMs: 1 d (units of days) (dark blue), 7 d (blue), 30 d (light blue); pristine GOMs: 0.1 h (units of hours) (light grey), 1 h (grey), 2 h (black). f, Photographs of pristine GOM and composite GOMs under water flushing at 2 m s−1. PMF, potential of mean force. Scale bars, 200 nm (c), 5 nm (d), 10 mm (f).Source dataMolecular dynamics simulations were performed to demonstrate the assembly of DA molecules within nanoconfined water and characterize their aggregation behaviour within GO sheets. Free-energy profiles reveal that DA molecules preferentially aggregate near oxygen-containing functional groups on GO (shown in Fig. 1b), and this trend remains valid across different interlayer spacings (Supplementary Fig. 5). Next, using density functional theory calculations (Extended Data Fig. 2), we found that the reactions between functional groups of DA molecules and those on GO, as well as the reaction between two DA molecules, involve relatively high energy barriers compared with DA assembly and aggregation, further showing that the DA molecules tend to aggregate near the oxygen-containing groups on GO surface first before reacting with the oxygen-containing groups or undergoing self-polymerization, achieving the timescale separation of DA assembly process and reaction process as illustrated in Fig. 1a. In addition to primarily using DA as the model molecule for tuning interlayer spacing, we also found that other reaction pathways can serve as alternatives (Supplementary Fig. 6). During composite-GOM fabrication, the GOMs with thicknesses ranging from roughly 30 nm to several micrometres can be obtained. The GOMs that are too thin show poor mechanical strength and high defect density, whereas those that are too thick fail to effectively regulate the interlayer spacing. Therefore, a thickness range of 65–150 nm was selected in this study to ensure both structural integrity and spacing tunability (Fig. 1c). A transmission electron microscopy (TEM) image further reveals the well-controlled layer-by-layer stacking structure of the GO sheets (Fig. 1d). Furthermore, water immersion tests show that the GOMs retain their X-ray diffraction (XRD) characteristic peaks even after 30 days of immersion (bottom panel of Fig. 1e), confirming stable interlayer spacing in aqueous environment. By contrast, the XRD peak for the pristine GOM almost completely disappeared within 2 hours (upper panel of Fig. 1e), revealing structural instability induced by severe swelling. Moreover, the robustness of the composite GOM was verified by means of water flushing at a flow rate of 2 m s−1 (Fig. 1f). The composite GOM remained intact after 60 min of flushing, whereas the pristine GOM was easily washed away after only 10 s.Tuning and stabilizing the GOM interlayer spacingTo systematically verify the controllability of the interlayer spacing in the GOMs, we performed large-scale fabrication under varied conditions, preparing more than 50 independent membrane samples for each set of parameters. All membrane samples were analysed using XRD, with interlayer spacing determined from the diffraction peak positions (2θ)8. As summarized in Fig. 2a, the interlayer spacing can be continuously adjusted across a range of 5.9–10.2 Å. For example, under conditions of 0.03-mM DA and 60-min assembly, the membranes showed a narrow interlayer spacing distribution between 6.32 Å and 6.64 Å across 50 tested samples made under identical fabrication conditions, with a standard deviation (s.d.) of 0.05 Å (inset of Fig. 2a). Similarly, for membranes with a target interlayer spacing of 10.0 Å, the calculated s.d. was 0.09 Å (Supplementary Fig. 7). These findings demonstrate that by controlling specific macroscopic preparation parameters, batches of composite GOMs with highly uniform interlayer spacing (s.d. less than 0.1 Å).Fig. 2: Regulating and stabilizing the interlayer spacing of the GOMs.a, XRD-derived interlayer spacing can be continuously tuned by varying DA concentration and assembly time. The blue violin plot shows the distribution range of interlayer spacings for several samples fabricated under the same conditions. The black dot within the light-blue region denotes the mean interlayer spacing under the given condition. The distribution was obtained from statistical analysis of more than 50 independently prepared membranes under each condition. The top-left inset shows a representative distribution of interlayer spacing with a DA concentration of 0.03 mM and an assembly time of 60 min. b, Time-dependent growth of DA assemblies in composite GOMs prepared with 0.06 mM DA. Assembly size was statistically determined from top-view TEM images collected over several independent experiments. The error bars represent the s.d. The red dashed line represents the fitted trend line. Insets show TEM images after 10 min and 60 min of assembly. c, The cartoon illustration shows that both dimensions (top view and side view) increase simultaneously with extended assembly time. The light-blue spheres represent reactive molecules, and the grey-black hexagonal grids represent GO sheets. d, Attenuated total reflection-Fourier transform infrared spectroscopy analysis of the reaction between DA assemblies and oxygen-containing functional groups on GO surface (forming amido bond) in composite GOM with different reaction times. The black curve represents pristine GOM. The blue-to-purple curves correspond to reaction times of 0 h, 1 h, 6 h, 24 h and 48 h. Scale bars, 20 nm. a.u., arbitrary units.Source dataWhereas increasing the DA concentration (Supplementary Fig. 8) and extending assembly time (Fig. 2a) can enlarge the interlayer spacing, interlayer spacing beyond roughly 9 Å exceeds the diameters of hydrated ions in common salts8, making it less relevant for ion sieving and desalination applications. Therefore, we focus on a controlled interlayer spacing range of 5.9 Å to 10.2 Å. To demonstrate the DA assembly between the GO sheets for adjusting the interlayer spacing, Fig. 2b presents the size evolution of assembled DA nanopillars over time, obtained from TEM images at a DA concentration of 0.06 mM as an example. Within 30 min, the lateral size of the assembled DA nanopillars increases to roughly 3.5 nm, corresponding to an interlayer spacing of 6.7 Å (Fig. 2a). After 60 min of assembly, the lateral size expands to roughly 5 nm, with a corresponding interlayer spacing of 7.0 Å (Fig. 2a). The representative TEM images in the insets visually depict DA assembly within GOMs at 10 min and 60 min, with further details provided in Supplementary Fig. 9. Although the top-view lateral size does not directly represent the height of the assembled DA nanopillars, both the lateral size and the nanopillar height (side view) increase simultaneously with extended assembly time, with the nanopillar height playing a key role in establishing well-defined interlayer spacing, as illustrated in Fig. 2c. Moreover, our molecular dynamics simulations demonstrate that when maintaining a constant density of assembled DA nanopillars, the average interlayer spacing increases with the number of DA molecules (Extended Data Fig. 3). Our DA assembly strategy also ensures a highly uniform interlayer spacing in the GOMs, as confirmed by conventional XRD and synchrotron-based grazing-incidence wide-angle X-ray scattering17, as well as by measuring the spatial homogeneity of interlayer spacing for the GOMs (Extended Data Fig. 4 and Supplementary Fig. 10).After achieving the desired assembly, the temperature is lowered to freeze the confined water into ice, allowing the subsequent slow reactions to fix the interlayer spacing and stabilize the structure. As shown in Fig. 2d, the attenuated total reflection-Fourier transform infrared spectroscopy reveals the reactions between PDA and GO, which stabilize the interlayer spacing and enhances the structural strength of composite GOMs. The formation of amido bonds (–NHOC–) increases progressively over 24 hours, indicating continuing reactions between the amine groups (–NH2) in DA molecules and the carboxyl groups (–COOH) on the GO surface. This reaction plays a crucial role in strengthening the interactions between the GO sheets6. In addition, the self-polymerization of DA is indicated by the GOM turning dark brown, signalling the formation of PDA18, as shown in Supplementary Fig. 11. This polymerization process requires more than 24 hours to complete under low-temperature conditions.Mechanism of interlayer spacing regulationFigure 3 illustrates the detailed mechanism underlying the nanoconfined water-induced DA assembly at the molecular level. To elucidate the intrinsic mechanism, we analysed the radial distribution function (RDF) for Owater of water molecules (Fig. 3a), and the RDF for nitrogen atoms of the NH2 group on DA and Hwater of water molecules (Fig. 3b), within both GO nanoconfinement and bulk solution. The intensity of RDF peaks serves as a quantitative measure of the interaction strength between a molecule (either water or DA) and its surrounding water molecules. In comparison to DA in bulk water, the H atoms of the NH2 group on DA within the nanoconfinement show weaker interactions with water molecules (Supplementary Fig. 12). Conversely, the RDFs of Owater···Owater in confined water and bulk water are nearly identical, indicating that water–water interactions in the nanoconfinement are comparable in strength to those in bulk water. As shown in Fig. 3c, water–DA interactions in the nanoconfinement are weaker than in bulk water, whereas water–water interactions remain similar. This weaker interaction in the nanoconfinement promotes the aggregation of DA molecules, thereby lowering the system’s overall energy. In other words, the nanoconfinement induces DA molecule assembly, which promotes the formation of the PDA structure that controls the interlayer spacing. This diffusion and reaction pathway is key to effectively tuning molecular aggregation and membrane properties.Fig. 3: Mechanism of assembly of reactive molecules in nanoconfinement.a, RDF for O atoms of water molecules in the nanoconfined environment (pink line) and in bulk solution (blue line). g(r) denotes the RDF, which describes the local atomic density at a distance, r, from a reference atom for an ideal uniform distribution. b, RDF for N atoms (of NH2 group on DA molecules) and H atoms (of water molecules) in the nanoconfined environment (pink line) and in bulk solution (blue line). c, Schematic illustration of the hydration of DA in bulk solution (left-hand side of the panel) and in the nanoconfined environment (right-hand side of the panel), where the confined environment weakens the interactions between DA molecules and water. The red, white and blue spheres represent oxygen, hydrogen and nitrogen atoms, respectively, and the cyan and grey spheres represent carbon atoms in the DA molecules and GO nanosheets. The blue dashed lines represent hydrogen bonds.Source dataPractical applicability of fabricated GOM devicesWe constructed a cross-flow filtration apparatus (Fig. 4a,b) using the composite GOMs for desalination and ion sieving from pretreated seawater (Methods). Using this setup, we systematically examined water permeance and NaCl rejection as a function of prepressurization pressure, membrane thickness and interlayer spacing of the GOMs with a 2,000 ppm NaCl solution (Fig. 4d–f). As shown in Fig. 4d, before water permeance and NaCl rejection tests, we prepressurized the membrane with water hydraulic pressure to compact the GOM and evaluate its pressure resistance (Supplementary Fig. 13). Note that the pressure on the x axis of Fig. 4d corresponds to this prepressurization stage, not the operating pressure during desalination. After 10-bar prepressurization, the GOM maintained a NaCl rejection rate of 98.5% under an operating pressure of 5 bar (Fig. 4d).Fig. 4: The composite-GOM cross-flow filtration device for water permeation, NaCl rejection and cation-sieving performance.a, Schematic of the GOM cross-flow filtration device. b, Photograph of the filtration device with the integrated composite GOM. c, Scanning electron microscopy image of the GOM on an anodic alumina membrane. d–f, Water permeance and NaCl rejection as functions of prepressurization pressure (d), membrane thickness (e) and interlayer spacing (f) in aqueous environments. Black and red sphere symbols denote water permeance and NaCl rejection, respectively. Data are means from more than ten measurements; error bars indicate s.d. g, The NaCl rejection plotted against operation time for the GOMs (red spheres) and pristine GOMs (black spheres) under cross-flow conditions. Every data point is averaged over five measurements, and error bars indicate the s.d. h,i, For sieving Li+ (h) and Rb+ (i), red bars with black diagonal stripes denote the Li+ and Rb+ ion fractions. In h, the composite GOMs have interlayer spacings of Dlarger = 8.7 Å (blue dashed line) and Dsmaller = 7.9 Å (light-blue dashed line), respectively. In i, the composite GOMs have interlayer spacings of Dlarger = 7.0 Å (blue dashed line) and Dsmaller = 6.8 Å (light-blue dashed line), respectively. For h and i, the bar height represents the mean of more than ten independent measurements, and error bars show the s.d. AAO, anodic aluminium oxide. Scale bars, 1 cm (b); 1 µm (c).Source dataIn addition, the thickness of the GOMs influences both the water permeance and NaCl rejection (Fig. 4e). An optimal thickness of roughly 90 nm (Figs. 1c and 4e) balances structural strength, water permeance and salt rejection (details in Supplementary Fig. 14). As the interlayer spacing increases from 6.5 Å to 9.0 Å (measured in aqueous environment), water permeance rises from 49.1 l m−2 h−1 bar−1 to 104.3 l m−2 h−1 bar−1, whereas NaCl rejection drops from 99.8% to 65.2% (Fig. 4f). Notably, the GOMs show a stable NaCl rejection as high as 99.0% over 700 hours (red-ball markers in Fig. 4g). By contrast, the pristine GOMs show a rapid decline from 65.3% to 15.1%, due to uncontrollable swelling (black-ball markers in Fig. 4g). These results demonstrate the long-term desalination applicability of the composite GOMs. To meet seawater desalination requirements9,13,19,20,21,22, the GOM showed a NaCl rejection rate of 99.4% over 16 days, and after 30 days of continuous operation, the rejection remained 99.0%, with a roughly 0.4% decline, demonstrating stable performance (Fig. 4g). A water permeance of 67.9 l m−2 h−1 bar−1 was maintained throughout the 30-day test. The efficient water transport arises from the formation of PDA nanopillars at oxidized regions on the GO surface, while leaving abundant graphene-based channels for water permeation (Extended Data Fig. 5 and Supplementary Fig. 15). Furthermore, the membranes show robust separation performance under high-salinity conditions, suggesting potential for ion separation and water recovery from highly concentrated saline solutions (Supplementary Fig. 16).Next, we used the designed filtration device and operational setup (Fig. 4a–c and Supplementary Fig. 13) to evaluate the ion-sieving performance of the composite GOMs. Extended Data Fig. 6 shows the permeation rates of various salts (RbCl, KCl, NaCl, LiCl, CaCl2 and MgCl2) with different hydrated ionic diameters. Extended Data Fig. 7 shows that ion hydration-size and hydration-energy differences can guide the selection of suitable interlayer spacings for selective ion separation. By matching the hydrated diameter of Li+, the GOMs with interlayer spacing of Dlarger = 8.7 Å and Dsmaller = 7.9 Å efficiently separate Li+ from pretreated seawater (Fig. 4h), increasing its molar ratio from 5.3% to 90.8%. In lithium-ion battery production, both Li+ and Mg2+ can form precipitates with carbonate (CO32−)23,24,25,26, whereas high-concentration Na+ may also coprecipitate with Li+27,28,29. Therefore, effective separation of Li+ from Mg2+ and Na+ is crucial. The GOMs achieve selectivity factors of Li+/Mg2+ = 631 and Na+/Li+ = 148, respectively, significantly enhancing the purity of the recovered Li+. Rubidium (Rb+) is essential in various high-tech applications, yet membrane separation of Rb+ is extremely challenging due to its minimal hydrated diameter difference (less than 0.1 Å) with potassium (K+)30. Using a dual-membrane configuration: first, the GOM with Dlarger = 7.0 Å preferentially transports Rb+ while suppressing K+ permeation, balancing enrichment and flux (Extended Data Fig. 8); then, the GOM with Dsmaller = 6.8 Å selectively rejects K+, yielding highly enriched Rb+ in the permeate solution (Fig. 4i). As a result, the Rb+ concentration increases from 0.1% to 85.1%, achieving a Rb+/K+ selectivity factor of 5,320, significantly outperforming conventional precipitation and adsorption-based extraction methods30.Although the hydrated diameters of K+, Li+ and Rb+ all exceed the corresponding channel sizes of the GOMs (interlayer spacing minus the thickness of the carbon layer) as shown in Fig. 4h,i and Extended Data Fig. 7, the prevailing consensus of ion permeation is that ions undergo partial dehydration when traversing the subnanochannels8,31,32,33. To validate this mechanism, we performed molecular dynamics simulations using K+ permeating through a membrane with an interlayer spacing of 7.0 Å (channel sizes roughly 3.6 Å) as a representative case. The results show that on entering the subnanochannels, K+ partially sheds its hydration shells, leading to a notable reduction in hydration number and effectively lowering its apparent hydrated size (Extended Data Fig. 9). Structural snapshots (Extended Data Fig. 9c) visually demonstrate this partial dehydration process, explaining how hydrated ions can permeate even when their apparent hydrated diameters exceed the channel size8,31,34,35,36. Furthermore, the order of dehydration energies for different ions passing through the GOMs with the same interlayer spacing, as obtained from theoretical calculations, is closely aligned with the experimentally observed trend in ion selectivity8,32.DiscussionIn summary, we report a new synthetic method for making a new class of PDA-pillared GOMs with tunable and stable interlayer spacing, featuring controllable interlayer spacings down to 5.9 Å in the dry state, and the capacity to separate the hydrated metal ions differing in size by less than 0.1 Å in aqueous environments. The interlayer spacing remains highly stable over long periods under aqueous conditions, enabling sustained seawater desalination and ion separation. Such a control is achieved by implementing an assembly and/or reaction time-separation strategy. During the assembly, DA molecules form nanopillar structures at the sites of oxygen-containing functional groups on the GO surface, enabling the subnanoscale adjustment of the interlayer spacing while minimally occupying carbon-rich regions for fast water and/or ion transport. Further, the self-polymerized DA nanopillar array bonding with GO sheets within the membrane stabilizes both the interlayer spacing and composite-GOM structure. The tunability of the interlayer spacing allows us to select a specific interlayer spacing for sieving of target ions. The theoretical calculations provide a mechanistic understanding on how the composite GOMs can achieve the ion selectivity by taking advantage of different degrees of partial dehydration for ions with different hydration diameters. Overall, this joint experimental and theoretical study not only extends the field of nanoconfined water solutions from fundamental scientific research to practical engineering applications, but also offers a feasible path towards scaling-up applications for generic ion selection and desalination.MethodsPreparation of GO sheets with controllable lateral sizesAqueous dispersions of GO with broad size distributions, synthesized by means of a modified Hummer’s method37, were purchased from Nanjing XFNANO Materials Tech Co., Ltd. Temperature-controlled fractionated centrifugation was used to separate the polydisperse GO dispersions into several distinct size groups. To measure the lateral size of the GO nanosheets, droplets of the GO dispersion were deposited on silicon wafers and air dried. Lateral size distributions were determined from atomic force microscopy images (Supplementary Fig. 17) by analysing more than 500 nanosheets per sample. The average lateral size of irregularly shaped GO nanosheets was calculated as the mean of their largest and smallest transverse widths. The sorted GO fractions were immersed in water and stored at 4 °C to prevent aggregation. For this study, the roughly 2-μm GO size fraction was selected on the basis of its optimal performance characteristics (Supplementary Fig. 18).Preparation of GO with varying oxidation degreesGOs with different oxidation levels were prepared using a modified Hummer’s method37. Four GO samples with varying degrees of oxidation, covering a wide range of oxygen content, were synthesized by adjusting the amount of oxidant (KMnO4) and oxidation time during the preparation process. It was observed that freshly prepared GO samples showed non-uniform sizes, with smaller GO sheets generally having higher oxidation degree. A patchwork GOM with fewer oxygen-containing functional groups showed higher permeability at the same interlayer spacing, whereas membranes with strong binding pillars required appropriate oxidation to provide robust linking and support, preventing swelling and collapse. On the basis of these characteristics, membranes with 25.4% oxygen content oxidation showed optimal performance in composite GOMs, compared with the typical 30.6% oxygen content (Supplementary Fig. 19). Furthermore, the GOs with varying oxidation degrees were subjected to fractionated centrifugation before membrane preparation to ensure optimal performance in composite GOMs.Preparation of GOMsThe prepared size-graded GO sheets were diluted to a concentration of 2 μg ml−1. The diluted suspension was then filtered under a vacuum pressure of roughly 0.01–0.02 MPa through microporous substrates (cellulose, nylon, polyethersulfone or anodized aluminium oxide and so on) or alumina ceramic tubes, all with a pore size of roughly 0.22 μm, to form GO films. In the experiment, the operation with lower concentration and lower vacuum pressure provided sufficient time for the GO sheets to spread uniformly, resulting in flat and consistent membrane. The GOMs were subsequently freeze dried using a freeze dryer (LGJ-10E, Sihuankeyi Co., Ltd).Preparation of the composite GOMsThe freeze-dried GOMs were immersed in aqueous solutions of reactive molecules (for example, DA) at various concentrations (0.03 mM, 0.06 mM, 0.13 mM, 0.33 mM, 0.65 mM and 1.3 mM, pH 7.5) for 1–3 min (Supplementary Fig. 1). The solution volume was carefully controlled to infiltrate the membrane sufficiently while preventing rapid swelling into disordered, stacked GO sheets. The membranes were then frozen at temperatures below −50 °C. Unlike traditional immersion strategies that result in uncontrolled swelling, the frozen surrounding bulk ice extracted some liquid water in confinement from the GOM interlayers, thereby minimizing the initial interlayer spacing. This process was followed by annealing below the bulk ice freezing point (for example, −10 °C) for various annealing times to achieve the desired GOM interlayer spacing. Then, the GOMs were cooled to below −30 °C for the reaction process. The GOMs were subsequently freeze dried to obtain the PDA-crosslinked GOM (composite GOM).Building on this approach, the mixed solution of benzene-1,2,4,5-tetramine (P) and benzene-1,3,5-tricarboxylic acid (A) in a 3:2 ratio was used to fabricate the poly-PA-crosslinked GOM. During the reaction, the P and A molecules underwent copolymerization. For freeze-dried GOM treated with aqueous acrylamide solutions, the membrane was further exposed to ultraviolet light for 1 h, yielding poly-AM-crosslinked GOM membranes (Supplementary Fig. 6). In our approach, we introduced this mechanism to achieve the separation of reactive molecular assembly and subsequent reactions. It prevented the imprecise spacing regulation and channel blockage from excessive reacted molecules to flux reduction, which can possibly arise from simultaneous assembly and reaction or from relying solely on chemical reactions for interlayer stabilization6.PVA-modified anodic aluminium oxide ceramic tube surfacePolyvinyl alcohol (PVA) was dissolved in water and heated to 95 °C to prepare a 1 wt% aqueous solution. Ceramic tubes were immersed in the PVA solution for 1 h to deposit the PVA on the substrate surface. The tubes were then rinsed with deionized water and left to dry naturally at room temperature for 12 h, resulting in PVA-modified ceramic tubes. This modification improved the adhesion between the ceramic substrate and the GO-based membrane.Configuration of filtration device with the GOMsThe filtration device consisted of a flexible, flat and reinforced composite GOM securely adhered to a cylindrical hydrophilic-modified ceramic tube for mechanical stability of composite GOMs. The feed solution was pumped through the composite-GOM filtration system, with the retentate being recycled while the permeate water was collected, as shown in Fig. 4a.Low-temperature differential scanning calorimetry measurementsWe conducted low-temperature differential scanning calorimetry measurements on membrane-GOMs with different interlayer spacings to determine the freezing behaviour of nanoconfined water. As shown in Extended Data Fig. 1, differential scanning calorimetry thermograms showed distinct crystallization peaks as the temperature decreased from −10 °C to −30 °C. On the basis of the precedent set in the literature38, the higher-temperature peak was attributed to bulk-like water freezing, whereas the lower-temperature peak corresponded to the freezing of confined water. Compared with the exothermic peak of bulk water freezing, the exothermic peak of confined water freezing was much smaller, with a reduced peak area. Therefore, to better show the freezing temperature of confined water in membranes with different interlayer spacings, we have amplified the confined water crystallization peak (Extended Data Fig. 1a). The freezing temperature of confined water decreased as the interlayer spacing decreased, as shown in Extended Data Fig. 1b. Moreover, in some cases (for example, between −5 °C and −15 °C), only a single broad peak was observed, which we attributed to the overlap of bulk and confined water crystallization transitions (not shown here). In addition, the limited exothermic heat released during the crystallization of confined water resulted in a melting process that was much smaller compared with bulk ice melting. As a result, the melting peak of confined ice was overshadowed by the melting peak of bulk ice.In situ XRD for frozen samplesThe frozen GOMs were placed in a sealed temperature-controlled system integrated with XRD apparatus (PANalytical) for analysis. The interlayer spacing was measured by using powder XRD with the angular range of 3–80° (2θ) at a scanning speed of 10° min−1 with the Cu Kα radiation (wavelength λ = 1.54056 Å).Measurement of the interlayer spacing of GOMsThe interlayer spacing was measured by using powder XRD with the angular range of 3–30° (2θ) at a scanning speed of 5° min−1 by using an X-ray diffractometer (PANalytical) and the wavelength of the Cu Kα radiation (λ = 1.54056 Å). The Bragg equation 2dsinθ = nλ was used to calculate the interlayer spacing.Synchrotron radiation source for testing GOMs in dry stateThe synchrotron grazing-incidence wide-angle X-ray scattering two-dimensional (2D) patterns were collected on the BL14B1 and BL16B1 beamlines at Shanghai Synchrotron Radiation Facility, using a fixed wavelength of 1.2398 Å (10 keV), an exposure time of 200 s and an incident angle of 0.2°. The relationship between the 2θ and interlayer spacing was calculated from the grazing-incidence wide-angle X-ray scattering 2D patterns through the open access software of FIT2D.Electron microscopy characterizationGO dispersions were deposited onto TEM grids on a filter paper. DA solutions at varying concentrations (0.03 mM, 0.06 mM, 0.13 mM, 0.33 mM, 0.65 mM and 1.3 mM) were subsequently added to infiltrate the GO layer on the grids. Then we followed the method of preparing composite-GOM samples to first rapidly freeze the GOMs, followed by annealing to obtain the target composite GOMs for TEM imaging. High-resolution TEM images were obtained at the acceleration voltage of 200 kV on a JEM-2100F electron microscope.Moreover, some morphologies images were examined at 5 kV using a field-emission scanning electron microscope instrument (Hitachi S-4800).Evaluation of membrane performanceThe performance of the GOMs was evaluated using a cylinder-shaped filtration cell for testing the composite GOM supported by ceramic substrates with an effective membrane area of 10.6 cm2 shown in Supplementary Figs. 13 and 20. For the cylinder-shaped filtration cell, taking permeation tests of 2,000 ppm NaCl as an example, the composite GOM was placed on the cylindrical ceramic substrate, with the composite-GOM layer facing the feed NaCl solution. The NaCl aqueous solution was pumped into the cell through the inlet as the feed solution and exited through the outlet as the retentate. After the system reaching steady-state, the permeates were collected after passing through the composite GOM was recorded as the permeate solution for subsequent analysis. The process was conducted at room temperature, with an operating pressure of 5 bar and a cross-flow rate of 50 l h−1.The water permeance (Jw) was determined by means of the equation:$${J}_{{\rm{w}}}=\frac{\Delta V}{\Delta t\times A\times \Delta P}$$where Jw is the water permeance (l m−2 h−1 bar−1), ΔV is the volume of permeate solution (in l), Δt is the test time (h), A is the effective membrane area (m2) and ΔP is the transmembrane pressure difference (bar).The single salt rejection (R) was calculated by using the equation7,39:$$R=1-\frac{{C}_{{\rm{permeate}}}}{{C}_{{\rm{feed}}}}\times 100{\rm{ \% }}$$where Cpermeate is the concentration of a specific target salt in the permeate solution and Cfeed is the concentration of the same target salt in the feed solution. The conductivity of the permeate solution was measured using a conductivity meter (Mettler-Toledo), and ion chromatography (Thermo Fisher Scientific).The salt concentration can be calculated using the equation:$$C=\frac{\kappa }{{\varLambda }_{{\rm{m}}}}$$where C is the salt concentration, κ is the measured conductivity and Λm is the molar conductivity. Within the salt concentration range tested in this work, the conductivity showed a linear relationship with concentration, thus allowing the salt rejection to be determined from conductivity measurements.The selectivity coefficient, SA,B, for ion A over ion B was quantitatively determined using equation:$${S}_{{\rm{A}},{\rm{B}}}=\frac{\frac{{C}_{{\rm{permeate}},{\rm{A}}}}{{C}_{{\rm{feed}},{\rm{A}}}}}{\frac{{C}_{{\rm{permeate}},{\rm{B}}}}{{C}_{{\rm{feed}},{\rm{B}}}}}$$where, Cfeed,A and Cfeed,B correspond to the concentrations of ion A and ion B in the feed solution, whereas Cpermeate,A and Cpermeate,B represent the concentrations of ion A and ion B in the permeate. Specifically, In Fig. 4h,i, only the main metal-ion species are presented for clarity. The total ion fraction does not sum to unity because Ca2+ are not shown. Metal-ion concentrations were measured using inductively coupled plasma spectroscopy (iCAP RQ, Thermo Fisher Scientific). At the same time, anion concentrations were determined by ion chromatography (Thermo Fisher Scientific).The ion permeation rate (Ji) was calculated according to the equation:$${J}_{{\rm{i}}}=\frac{V\times {C}_{\mathrm{ion}}}{A\times \Delta t}$$where V is the effective volume of the permeate solution, Cion is the ion concentration in the permeate side, A is the effective membrane area and Δt is the permeation time.In addition, we conducted ion-sieving and permeation tests of pretreated seawater (as a feed solution, seawater was obtained from China Bohai). In this work, after pretreatment, the Li+ concentration reached roughly 0.3 ppm and the treated seawater was used as the feed solution in Fig. 4h. Also, when the Rb+ concentration reached roughly 0.03 ppm, it was used as the feed solution in Fig. 4i. Therefore, the membrane performance discussed in this work was evaluated from a defined feed solution obtained after pretreatment, rather than directly from raw seawater.Surface zeta potential measurementsZeta potentials of the membrane surface were calculated by streaming potential measurements by an electrokinetic analyser (Anton Paar, SurPASS), in which 1 mM of KCl solution under neutral conditions was passed over the membrane surface.To systematically evaluate the role of surface charge in ion separation within composite GOMs, we measured the surface zeta potentials of composite GOMs with different interlayer spacings40. As shown in Extended Data Fig. 10, despite significant variations in interlayer spacing, the zeta potential values remained largely consistent across all membranes, indicating that the confinement-driven molecular assembly does not alter the membrane surface charge characteristics. The key finding was that despite similar surface charge states, membranes with different interlayer spacings showed distinct metal-ion separation performance (Extended Data Fig. 6). This comparative result confirmed that surface charge did not play a dominant role in the ion-sieving process within composite GOM.Atomic force microscopy characterizationsThe Multimode 8 (Bruker) was used to characterize the morphology and size of GO sheets.Optical characterizationDigital photographs were taken with a Nikon eclipse LVDIA-N microscope equipped with a CCD (DS-Ri2).Molecular dynamics simulationsThe simulation system contained 2 GO sheets, 4 DA molecules and about 1,800 water molecules in a box with the dimensions 50.92 × 50.40 × 30.00 Å3 (Supplementary Fig. 21). The periodic boundary conditions were applied to all three dimensions in the simulation. To simulate the original graphene region and the GO region, we reduced the oxidation degree of GO sheets with a formula of C20O1(OH)1, which contained 39 hydroxyl groups (–OH) and 39 epoxy groups (–O–). In the simulation, the C atoms were fixed in the y direction to keep the interlayer spacing at 10 Å. The simulation was carried out in the constant-temperature-volume (NVT) ensemble with a time step of 1 fs. The temperature was kept at 260 K by a velocity-rescale thermostat41. Each simulation was run for 40 ns, with the last 30 ns being used for data analysis. An all-atom optimized potential for liquid simulations was used for GO sheets and DA molecules42, and the TIP4P/2005 water model was applied for water molecules43. Lennard–Jones and Coulomb potentials were used to simulate non-bonding interactions, with the electrostatic interactions being calculated using the particle mesh Ewald summation method44 and a 10-Å real-space cut-off for non-bonding interactions. The LINCS algorithm was used to constrain covalent bonds and angles45. The free-energy profile of DA molecules confined in GO nanosheets was computed using the umbrella sampling method. Free energies were estimated using the weighted histogram analysis method46. All classical molecular dynamics simulations were conducted using the GROMACS package47. The program VMD was used for data analysis and molecular graphics48.Density functional theory calculationsAll density functional theory calculations were performed using Gaussian 09 software49. The electronic structural optimization and reaction barrier calculation were performed based on an implicit water solvent model at the B3LYP/6-311++G** level50 with Grimme’s dispersion corrections51. The hydration energies of ion-water clusters (ion-(H2O)6) for Rb+, K+, Na+ and Li+ were further calculated at the B3LYP level with a mixed basis set: the Stuttgart/Dresden effective core potential (SDD) pseudopotential for the cations and the 6-311++G** basis set for water molecules. Basis set superposition error corrections were applied to the hydration-energy calculations.
Graphene oxide-polydopamine membranes with controlled interlayer spacing - Nature
Polydopamine-pillared composite graphene oxide membranes with tunable and stable interlayer spacing, featuring controllable interlayer spacing, are capable of sieving hydrated rubidium and potassium ions and delivering continuous freshwater production at high levels.
10,082 words~46 min read