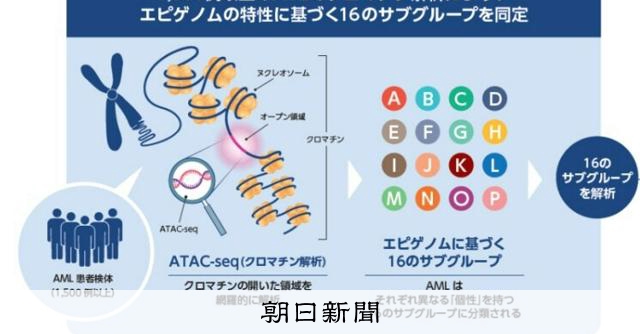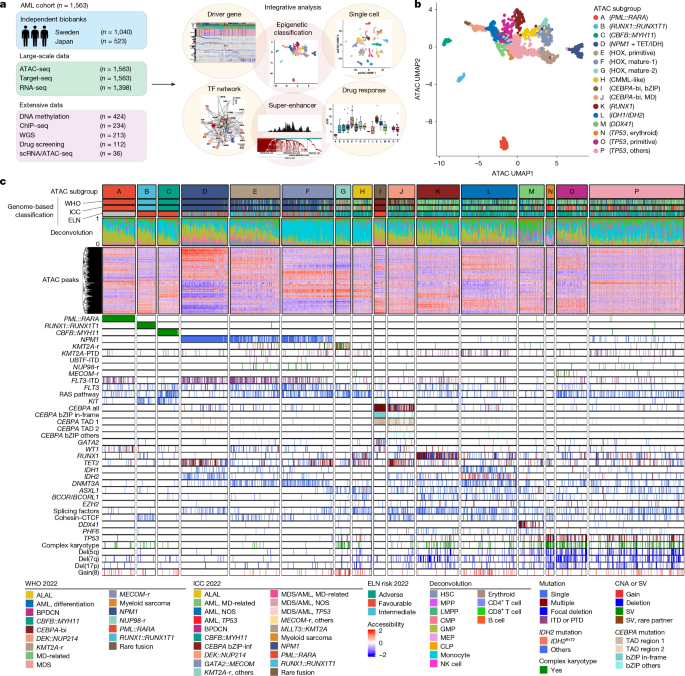
MainAML encompasses a heterogeneous group of myeloid neoplasms characterized by the uncontrolled proliferation of immature myeloblasts owing to dysregulated haematopoietic programs1. Over the past few decades, advanced genomics studies have provided a comprehensive registry of major driver mutations and structural variations that are involved in these dysregulated programs2,3,4, contributing to an improved understanding of the molecular pathogenesis and heterogeneity of AML. This improved knowledge has been incorporated into the latest AML classifications, proposed by the World Health Organization (WHO), the International Consensus Classification (ICC) group and the European LeukemiaNet (ELN), which are widely used for molecular diagnosis, risk stratification, drug discovery and therapeutic decision-making, including the selection of molecularly targeted therapies5,6,7,8. However, accumulating evidence suggests that genetic alterations do not fully explain AML pathophysiology and heterogeneity9,10.The epigenome is a non-genetic mechanism of cellular inheritance and often undergoes extensive alterations in cancer, through aberrant DNA methylation, chromatin modifications and higher-order chromatin structure11,12. In fact, the altered epigenome is a hallmark of cancer and serves as another layer of oncogenic mechanism alongside gene mutations11,12. Frequent mutations in epigenetic regulators also underscore the key role of the altered epigenome in cancer11. However, the cancer epigenome could also be shaped by non-genetic mechanisms, such as the cell of origin12, stem-cell ageing13, chronic inflammation14, infections15 and metabolic insults16, highlighting the importance of the altered epigenome in AML.In previous studies, the cancer epigenome has been studied mainly through DNA methylation17,18,19 with less focus on altered chromatin, even though the chromatin represents another layer of the epigenome and, together with DNA methylation, has a pivotal role in gene-expression regulation and differentiation11. By integrating regulation from both genetic and epigenetic components, chromatin accessibility provides more information on epigenetic regulation of the transcriptional machinery—including transcription factor (TF) binding and gene-expression states—than can be obtained from DNA methylation data alone11,20. Moreover, chromatin accessibility can be assessed using a simple and scalable method: ATAC-seq20,21. Thus, systematic profiling of chromatin accessibility using ATAC-seq is a suitable approach for analysing the AML epigenome in a large cohort of patients, although its application has been mostly limited to a small number of cases in previous studies9,21,22,23.In this study, we reveal the integrated chromatin landscape of AML on the basis of large-scale ATAC-seq data combined with multi-layered sequencing data (Fig. 1a). We determine the role of the epigenome in AML pathogenesis and heterogeneity, and investigate its effect on clinical presentation and drug sensitivity.Fig. 1: Epigenetic subgroups of AML defined by chromatin accessibility.a, Study design and summary of obtained data. Target-seq, targeted-capture sequencing. b, Uniform manifold approximation and projection (UMAP) plot based on ATAC-seq profiles. Each dot represents one patient, and colours indicate ATAC subgroups. ATAC subgroups are annotated with representative genetic alterations and/or differentiation states (for example, A (PML::RARA)) to aid interpretability. Labels were assigned on the basis of enriched and relatively specific features within each subgroup, including mutation patterns and differentiation signatures, but do not indicate that subgroup identity is defined solely by these alterations. bi-, biallelic; bZIP, basic leucine zipper; CMML, chronic myelomonocytic leukaemia; MD, myelodysplasia. c, Summary of ATAC subgroups with AML diagnosis; differentiation status inferred by CIBERSORTx software27 using ATAC-seq data (deconvolution); scaled ATAC intensities on 3,000 variable ATAC peaks; and genetic abnormalities. Each column represents one patient. Mutations affecting the RAS pathway, splicing factors and the cohesin complex are grouped in this panel; gene-level mutation profiles are provided in Supplementary Fig. 10. ALAL, acute leukaemia of ambiguous lineage; BPDCN, blastic plasmacytoid dendritic cell neoplasm; CLP, common lymphoid progenitor; CMP, common myeloid progenitor; CNA, copy-number alteration; GMP, granulocyte–monocyte progenitor; -inf, in-frame; HSC, haematopoietic stem cell; ITD, internal tandem duplication; LMPP, lymphoid-primed multipotent progenitor; MDS, myelodysplastic syndromes; MEP, megakaryocyte–erythrocyte progenitor; MPP, multipotent progenitor; NK, natural killer; NOS, not otherwise specified; PTD, partial tandem duplication; -r, rearrangement; SV, structural variation; TAD, transactivation domain.Subgroups based on chromatin accessibilityWe enrolled 1,563 patients with AML from independent Swedish and Japanese cohorts (referred to as the Encyclopaedia of Chromatin in AML (eCHROMA) cohort). All patients underwent targeted-capture sequencing of 331 known or candidate driver genes and single-nucleotide polymorphism (SNP) loci for copy-number analysis. RNA sequencing (RNA-seq), whole-genome sequencing (WGS), DNA methylation, chromatin immunoprecipitation followed by sequencing (ChIP–seq) and single-cell RNA and ATAC sequencing (scRNA/ATAC-seq) were also performed in varying subsets of patients (Fig. 1a and Supplementary Tables 1–4). Targeted-capture sequencing, complemented with RNA-seq and WGS, reproduced the genomic profile of AML reported in previous studies2,3,4, including common driver mutations, gene fusions and copy-number alterations (CNAs) (Extended Data Fig. 1a and Supplementary Fig. 1). Less common driver mutations, including those reported more recently, were also identified, such as MED12, PHIP (ref. 24), MYB (ref. 25) and UBTF (ref. 26).ATAC-seq identified a total of 176,853 recurrent peaks shared between Japanese and Swedish cohorts. Predominantly located in non-promoter elements, these peaks included many newly identified peaks, together with those previously reported21 in AML (Extended Data Fig. 1b). Most ATAC peaks overlapped with one or more ChIP peaks for H3K27ac, SMC1, CTCF, RNA polymerase II and H3K27me3 that were recurrently detected in around 200 AML samples (Extended Data Fig. 1c and Supplementary Fig. 2), confirming the well-established link between chromatin accessibility and various elements in epigenetic regulation, including promoters, enhancers and insulators. Although ATAC signals in non-promoter regions were weaker than were those in promoters, they showed greater variance between samples (Extended Data Fig. 1d,e), suggesting that chromatin accessibility in non-promoter elements—such as enhancers—could provide a clue to understanding epigenetic heterogeneity in AML. This prompted us to perform ATAC-based clustering analysis on our 1,563 cases.In the clustering analysis, we identified 16 subgroups with unique ATAC profiles (Fig. 1b,c). DNA methylation profiling in 424 samples revealed a distinct methylation pattern in each ATAC subgroup (Supplementary Fig. 3a), in which chromatin accessibility and DNA methylation levels were significantly and inversely correlated across all subgroups (Supplementary Fig. 3b,c). The reproducibility of our clustering was benchmarked by high adjusted Rand index (mean = 0.79) and co-clustering accuracy (mean = 0.97) in a resampling analysis, although the consistency was lower in subgroups O and P (Supplementary Fig. 4). A higher-resolution clustering revealed finer structures but resulted in reduced stability (Supplementary Figs. 5 and 6). Therefore, we retained the original 16-subgroup framework. Reflecting the close link between the epigenome and differentiation state21, each subgroup showed characteristic patterns of lineage bias, which was revealed by deconvolution analysis of bulk ATAC-seq data21,27 (Extended Data Fig. 2a–d) and supported by their close correlation with the French–American–British (FAB) classification system (Extended Data Fig. 2e,f). These ‘epigenetic’ subgroups showed a distinctive enrichment of gene mutations and other genetic alterations (Fig. 1c) and substantially overlapped with known genetic subtypes of AML in the WHO and ICC classifications5,6, indicating a strong link between ATAC subgroups and genetic abnormalities (Extended Data Fig. 2g–i). However, except for four subgroups (A, B, C and I; defined by common gene fusions (PML::RARA, RUNX1::RUNX1T1 and CBFB::MYH11) and by CEBPA in-frame basic leucine zipper (bZIP) mutations, respectively), they were not perfectly aligned with existing genetic subgroups but showed a complex mapping pattern, in which a single epigenetic subgroup was projected onto multiple genetic subgroups in the WHO and ICC classifications, and vice versa (Extended Data Fig. 2h,i). In fact, even after systematic and exhaustive decision-tree analyses using known driver lesions, we failed to identify drivers or their combinations that could uniquely define ATAC subgroups, except for subgroups A–C (and partially subgroup I) (Supplementary Fig. 7). Such drivers or combinations thereof were not identified by rigorously interrogating previously unknown drivers using WGS, even within a subset (n = 213) of our cases, as demonstrated in detail in subgroups J and K (Supplementary Fig. 8).Notably, these ATAC-defined subgroups showed stronger correlations with leukaemia phenotypes than did gene-mutation-based subgroups in WHO and ICC classifications, with regard to gene expression, white blood cell count (WBC), blast percentage and deconvolution-inferred differentiation profiles (Extended Data Fig. 2j). We also performed RNA-based clustering, which has conventionally been used to understand the heterogeneity of AML10. It revealed 18 distinct subgroups (clusters 1–18), in which significant correlations with known driver mutations were evident but less conspicuous (Supplementary Fig. 9a). Although half of the subgroups in both clustering approaches were highly concordant, the remaining subgroups were poorly correlated and unique to each clustering (Supplementary Fig. 9b), suggesting that chromatin accessibility and gene expression are similar but distinct measures of cell states revealing complementary layers of AML heterogeneity.Characterization of ATAC subgroupsThe unique features of ATAC-based classification are highlighted in many newly identified subgroups. For example, NPM1-mutated or KMT2A-rearranged (KMT2A-r) AML in the conventional genomic classifications were mostly re-organized into four subgroups with HOX gene overexpression (D–G) by combining other HOX-related alterations, including NUP98 and KAT6A rearrangements, DEK::NUP214 rearrangements, KMT2A partial tandem duplication and UBTF internal tandem duplication (ITD)26,28 (Extended Data Fig. 3a–c). These ATAC subgroups showed unique mutation patterns and cellular differentiation. NPM1 and FLT3-ITD mutations were highly condensed in subgroups D–F, but almost absent in subgroup G, which was instead enriched for KMT2A rearrangement together with complex karyotype and gain of chromosome 8. Cases in subgroup D were characterized by the presence of mutually exclusive TET2, IDH1 and IDH2 mutations in virtually all cases, frequent SRSF2 mutations and a paucity of the DNMT3AR882 hotspot mutations (Extended Data Fig. 3d–f and Supplementary Fig. 10). Subgroup E frequently had WT1 and cohesin mutations. Subgroups D and E exhibited immature phenotypes with an increased haematopoietic stem and progenitor cell (HSPC) component, whereas subgroups F and G, mostly classified as FAB M4 and M5 subtypes, had markedly increased monocytic components, irrespective of the type of associated HOX-related drivers (Extended Data Fig. 2a,b,e). Marked monocytic differentiation was also seen in subgroup H. Notably, this subgroup had a characteristic co-mutation pattern reminiscent of that seen in chronic myelomonocytic leukaemia (CMML), with frequent mutations in TET2, RUNX1, ASXL1 and SRSF2, as well as RAS-pathway mutations, suggesting that it might represent a continuum of CMML29 (Extended Data Fig. 3a and Supplementary Fig. 10).Subgroups I and J were characterized by an enrichment of biallelic CEBPA mutations. Of these, corresponding mostly to the CEBPA-mutated ICC subtype5, subgroup I was characterized by the combination of bZIP and transactivation domain (TAD) region I mutations in most cases, along with common mutations in GATA2 and WT1 (Extended Data Fig. 3a,g,h). By contrast, the enrichment of biallelic CEBPA mutations in subgroup J was less conspicuous, accounting for only 59% of the cases, in which the biallelic CEBPA mutations appeared in combinations other than the typical bZIP and TAD region I mutations (Extended Data Fig. 3g,h). Other features of subgroup J included frequent biallelic TET2 mutations and other MDS-related mutations involving ASXL1, cohesin and splicing factors (Extended Data Fig. 3a and Supplementary Fig. 10).Subgroup K exhibited a strong enrichment of RUNX1 mutations (77.5%), together with MDS-related alterations, particularly splicing-factor mutations, as well as del(7q) and complex karyotype. Subgroup L was characterized by mutually exclusive IDH1 and IDH2 mutations with frequent IDH2R172 variants (Extended Data Fig. 3i). Subgroup M exhibited an enrichment of DDX41 mutations and erythroid differentiation (Extended Data Figs. 2a and 3a). The remaining subgroups (N–P) were enriched for TP53 mutations (Extended Data Fig. 3a), of which subgroups N and O were highly skewed to erythroid and megakaryocyte–erythrocyte progenitor lineages and HSPCs, respectively (Extended Data Fig. 2a,d,e), whereas subgroup P showed balanced contributions from various lineages.Gene expression and super-enhancersWe next investigated the molecular features of epigenetic subgroups by integrating RNA-seq, ATAC-seq and ChIP–seq. Each epigenetic subgroup exhibited unique patterns of gene expression and enrichment in specific biological pathways (Fig. 2a,b). For example, subgroups D–G were characterized by the overexpression of HOXA genes, but each showed subgroup-specific gene expression and pathway enrichment, such as downregulation of the cell cycle and DNA replication (D) and of TGFβ signalling (E), and upregulation of the inflammatory response (F) and of neutrophil degranulation (F and G) (Fig. 2b and Supplementary Fig. 11). Subgroups C, F and H, all showing prominent monocytic differentiation, shared upregulated TNF signalling, IFNγ response and inflammatory response, which were absent in subgroup G. Subgroups I and J had upregulated expression of genes related to MYC and E2F targets, haem metabolism and oxidative phosphorylation, whereas other pathways, such as inflammatory responses and hypoxia, were selectively downregulated in subgroup I.Fig. 2: Distinct gene-expression and SE profiles across subgroups.a, Heat map showing the scaled expression of marker genes that were defined by the ClaNC algorithm (Extended Data Fig. 4a) according to ATAC subgroups. Each column represents a sample, and each row represents a gene with annotations for representative marker genes. b, Gene set enrichment analysis (GSEA) based on bulk RNA-seq, showing upregulated and downregulated gene sets in each subgroup. FDR, false discovery rate; NES, normalized enrichment score. c, Classification and distribution of non-redundant SEs across ATAC subgroups. A total of 1,718 non-redundant SEs were identified by merging the top 750 H3K27ac-ranked enhancers defined independently within each ATAC subgroup. SEs were classified as common (detected in 12 or more subgroups), partially shared (2–11 subgroups) or unique (one subgroup). Rows represent ATAC subgroups; columns represent individual SE loci. The presence of a SE in each subgroup is indicated in red. The top line graph shows the mean H3K27ac signal ranking across all samples. Representative oncogenes associated with selected SEs are labelled at the top, with TFs highlighted in red. d, Enriched gene ontologies for identified common and subgroup-specific SEs. Curated gene sets used in b,d are described in Supplementary Table 10. TKD, tyrosine kinase domain.Given the distinct gene-expression profiles that we observed across subgroups, we built an expression-based prediction model for the ATAC subgroups using the classification to nearest centroids (ClaNC) algorithm30 (Extended Data Fig. 4a), which achieved high accuracy, with the exception of subgroups O and P, which showed lower cluster stability (Supplementary Fig. 6e). Using this model, we predicted ATAC subgroups in a total of 1,079 samples from four external cohorts of adults with AML2,4,10,31,32. The predictions captured the overall patterns of gene mutation enrichment and clinical features—such as age, WBC and blast percentage—characteristic of each subgroup, despite some deviations, thereby supporting the robustness and validity of our ATAC-based classification (Extended Data Fig. 4b and Supplementary Figs. 12 and 13).To further understand the molecular basis of the unique gene expression in ATAC subgroups, we next analysed subgroup-specific super-enhancers (SEs), because SEs are known to define cellular identity and drive oncogene expression33,34. We first identified all enhancers that were recurrently found in 234 AML samples using H3K27ac ChIP–seq, ranked them by average H3K27ac signals within each subgroup and identified the top 750 as SEs within each subgroup. After merging the SEs identified across all subgroups, a total of 1,718 non-redundant SE loci were obtained, which were classified as common (n = 498; found in 12 or more subgroups), partially shared (n = 833; found in 2–11 subgroups) or unique (n = 387; found in a single subgroup) (Fig. 2c and Supplementary Table 6). Common SEs showed a greater overlap with SEs detected across various tissues and cell types34, particularly in haematopoietic cells, whereas subgroup-specific SEs were more AML specific (Supplementary Fig. 14). Common and subgroup-specific SEs were linked to different sets of genes. Common SEs were implicated in the regulation of oncogenic TFs, such as ETV6, TP53 and RUNX1; partially shared SEs were mapped to ERG, FLT3, HOXA9, CEBPA and SPI1; and unique SEs targeted oncogenes, such as RFX8 and HGF in subgroup A, FOXC1 in subgroup D, PRDM16 in subgroup E, IRF8 in subgroup G, KLF1 and NFIA in subgroup N and CD34 in subgroup O (Fig. 2c and Extended Data Fig. 5a–d). Gene ontology analysis revealed distinct associations of genes regulated by common and subgroup-specific SEs (Fig. 2d). Common SEs were associated with genes enriched for TNF signalling, MYC targets, G2M checkpoint and mRNA splicing, whereas subgroup-specific SEs often showed an enrichment for the gene sets reported for the related AML subtypes, with PML::RARA, RUNX1::RUNX1T1, NPM1 mutation and KMT2A rearrangement corresponding to subgroups A, B, D–E and F–G, respectively. Other gene sets enriched for subgroup-specific SEs included those implicated in neutrophil degranulation and TNF signalling (C and F–H), aligning with the overexpression of these genes in the corresponding subgroups (Fig. 2b). To understand the role of these SEs in subgroup-specific AML pathogenesis, we evaluated their association with lineage-specific gene expression (Extended Data Fig. 5e). As expected, these subgroup-specific SEs were less associated with lymphoid differentiation. SEs in the M–N and F–H subgroups were associated with high expression of genes in erythroid and myelomonocytic cells, respectively, which is consistent with their lineage contributions from the corresponding cell lineages (Fig. 2a). By contrast, in subgroups D and O, SEs were associated with gene expression related to haematopoietic stem cells (HSCs). Together, these results suggest that each ATAC subgroup is characterized by a unique SE profile that is tightly correlated with gene expression and cell differentiation programs.Gene-regulatory mechanismsBecause TFs are key regulators of gene expression and are frequently deregulated in AML, we analysed the TF-centred gene-regulatory networks (GRNs) characteristic of each ATAC subgroup using ANANSE35. This software integrates chromatin accessibility and gene expression to construct TF networks, linking a TF to its potential targets when binding motifs are predicted at accessible regulatory regions, and reporting the overall influence of each TF on gene expression (influence score) (Methods and Extended Data Fig. 6a). This analysis revealed that each ATAC subgroup was associated with a distinct GRN architecture, driven by a unique combination of TFs (Fig. 3a and Extended Data Fig. 6b).Fig. 3: Subgroup-specific GRNs driven by SE-regulated TFs.a, GRNs centred on TFs specific to the indicated subgroups, generated using ANANSE software35 (Extended Data Fig. 6a). The top 20 TFs that contribute most significantly to subgroup-specific gene expression (influence scores) in each ATAC subgroup are shown. Colours indicate the number of TF genes that each TF regulates (out-degree). Line width represents the strength of expressional regulation (link score) between two TFs. b, Heat map summarizing activities of TFs that were identified in both the ANANSE and the Coltron analysis. Size indicates the influence score for each TF, calculated by ANANSE software35 (Extended Data Fig. 6a). Colour indicates the importance of each TF in SE-based TF networks (Coltron score; generated by the Coltron software36), determined by the sum of in-degrees and out-degrees in the networks (Extended Data Fig. 6c).Because TFs that define cell identity frequently occupy SEs and form regulatory networks to determine gene-expression programs33,34, we next sought to correlate key TFs identified in ANANSE analyses with subgroup-specific SEs. To this end, we built another network of TFs that were regulated by SEs using the Coltron software36. In the Coltron-based network, TF–TF connections were inferred from motif occurrences within SEs that regulate each TF, capturing both out-degree (regulatory targets) and in-degree (upstream regulators) (see Methods and Extended Data Fig. 6c). Notably, the influence score of the key TFs in the ANANSE-based network correlated significantly with the sum of in-degrees and out-degrees in the Coltron analysis (Fig. 3b and Extended Data Fig. 6d), suggesting that subgroup-specific SEs have a role in the distinct gene-regulatory programs of ATAC subgroups through key TFs. For example, HOXA family TFs and E2F3—key TFs in GRNs in subgroups D–E and subgroup I, respectively—were typical TFs regulated by SEs in the respective subgroups (Fig. 3b). BCL11A and IRF family TFs (subgroup K) and SPI1 (also known as PU.1) and C/EBP family TFs (subgroups C, F, G and H) were other examples of SE-associated TFs implicated in B cell development37,38 and monocytic differentiation39,40, respectively, suggesting that the regulation of these TFs by subgroup-specific SEs might contribute to the increased B cell and monocytic components (Extended Data Fig. 2a). Together, these findings support the hypothesis that each ATAC subgroup is regulated by a distinct set of key TFs, which are often regulated by SEs specific to each subgroup.Single-cell profiling of ATAC subgroupsWe next performed multiomics scRNA/ATAC-seq analysis to validate the findings of the bulk sample analysis and to obtain further insights into the role of TFs in gene regulation in ATAC subgroups. We analysed 281,167 mononuclear cells from 36 AML samples across all 16 ATAC subgroups, along with 4 samples from patients in complete remission as normal controls (Fig. 4a, Extended Data Fig. 7a, Supplementary Figs. 15 and 16 and Supplementary Table 7). In scATAC-seq analysis, the leukaemic cells from each AML sample tended to be clustered into a single, well-defined group, which was distinct from the residual normal cells co-clustered with remission-derived cells (Fig. 4a and Extended Data Fig. 7b,c). Notably, samples belonging to the same ATAC subgroup mostly co-clustered, despite being derived from different patients (Extended Data Fig. 7c). Although some subgroups were not completely separated from each other, these observations indicate that all leukaemic cells in each subgroup shared a distinct ATAC signature, regardless of their differentiation state. A similar co-clustering pattern was observed in scRNA-seq analysis. scRNA and scATAC clusters were mainly concordant, but some clusters in both modalities (for example, RNA6 and AML08) were dispersed across clusters in the alternative modality, containing cells from multiple clusters. This underlines the complementary roles of ATAC and RNA profiles in underlying AML heterogeneity (Extended Data Fig. 7a and Supplementary Fig. 17), as discussed for bulk RNA-based clustering.Fig. 4: Epigenetic signatures, differentiation states and TF dynamics at the single-cell level.a, UMAP plot based on scATAC-seq profiles for all sequenced samples. Each dot represents one cell, and colours indicate different patient samples. Each sample is labelled with its group and sample number. b, Scheme for reference-based pseudotime analysis, using a previous scRNA-seq dataset of normal human bone-marrow haematopoiesis41. Colour indicates pseudotime. c, Density plots showing the distribution of AML cells mapped from each ATAC subgroup onto the reference scRNA-seq UMAP. d, Proportion of cells distributed across pseudotime bins along differentiation trajectories. The mean pseudotime for representative cell types in normal haematopoiesis (Extended Data Fig. 7d) is indicated at the top. BFU-E, burst-forming unit erythroid; CFU-E, colony-forming unit erythroid; EB, erythroblast; MkEry, megakaryocyte-erythroid; Mono, monocyte; MyLy, myeloid-lymphoid; Promono, promonocyte. e, Activity of the indicated TFs as inferred by SCENIC+ score (gene-based area under the curve (AUC) in the SCENIC+ software43) in each pseudotime bin along the myeloid differentiation trajectory. The top bar plot shows the average SCENIC+ score per bin; the right bar plot shows the average SCENIC+ score per subgroup. NA, no cells assigned.Despite the unique clustering across samples, deconvolution analysis based on bulk ATAC-seq suggests that each leukaemic sample might consist of heterogeneous populations with various cell lineages (Extended Data Fig. 2a). Thus, we investigated the differentiation profile of leukaemic cells at the single-cell level. By projecting scRNA-seq data from each ATAC subgroup to a reference trajectory of normal bone-marrow cell differentiation generated by scRNA-seq-based imputation41, we delineated unique lineage commitment and differentiation dynamics in ATAC subgroups that mimicked normal blood cell differentiation (Fig. 4b–d and Extended Data Fig. 7d–g). The differentiation profiles were mostly concordant between samples within the same ATAC subgroup, providing support for the biological relevance of the ATAC-based clustering (Supplementary Fig. 18). For example, eight samples from HOX-related subgroups (D–F) shared common NPM1 mutations but showed distinct differentiation profiles. Three samples from subgroup E showed a maturation block at the HSC stage, two from subgroup D were arrested at the GMP stage and the remaining three from subgroup F comprised both progenitor and mature cell populations. Although subgroups F–H showed prominent monocytic components in bulk sample analysis (Extended Data Fig. 2a), single-cell analysis revealed that mature monocyte-like cells were predominant in subgroup H, whereas samples from subgroups F and G contained more immature, promonocyte-like cells (Fig. 4c,d). Among the TP53-related subgroups, subgroup O was arrested at the HSC stage, whereas subgroups N and P exhibited differentiation towards the erythroid and monocytic lineages, respectively. Of note, samples from subgroup K were blocked at the common lymphoid progenitor (CLP) stage along the B cell trajectory and showed a differentiation block towards the myeloid and erythroid lineages, indicating a commitment to lymphoid lineages in their unique pathogenesis (Fig. 4c,d).Leukaemic stem cells (LSCs), defined by stem-cell-associated gene-expression programs and thought to sustain disease propagation and relapse in AML, were computationally assessed at the single-cell level using established LSC signatures (LSC score)41,42. High LSC scores consistently mapped to early stages of the differentiation trajectory across all ATAC subgroups, suggesting that LSC-like cells are present in each epigenetic context (Supplementary Fig. 19a). Given the distinct lineage commitment and differentiation states observed across ATAC subgroups, this suggests that the abundance of LSCs varies considerably (Supplementary Fig. 19b), which will need further validation in functional assays.Finally, we investigated the activity of TFs across ATAC subgroups at single-cell resolution using multiomics scRNA/ATAC-seq data and SCENIC+ software43. SCENIC+ infers TF networks by integrating gene expression and chromatin accessibility from the same single cells, in a manner analogous to ANANSE but applied to single-cell data (Methods and Extended Data Fig. 8a). This approach identified key TFs that were enriched in each subgroup, many of which overlapped with those identified by bulk-based GRN analysis using ANANSE and SE-based network analysis using Coltron (Extended Data Fig. 8b–d). We then investigated how these key TFs are activated along the myeloid differentiation trajectory by combining SCENIC+ and pseudotime analysis (Fig. 4e and Extended Data Fig. 8e). For example, HOXA9 was a key TF consistently expressed throughout the myeloid differentiation trajectory in HOX-related subgroups (D–G), but peaked at different stages according to the subgroup (Fig. 4e). By contrast, although BCL11A and IRF8 were upregulated consistently along the myeloid trajectory in subgroup K, their expression peaked differentially at the progenitor stage and at the mature stage, respectively. Another example of interest was SPI1, which showed an activation peak at the stem-cell stage in subgroup G but at the mature stage in F and J. These findings suggest that not only subgroup-specific key TFs but also their temporal activity profiles along the myeloid differentiation trajectory are important for understanding the subgroup-specific leukaemogenic mechanism.Clinical features and drug sensitivityWe also investigated whether the ATAC subgroup correlated with patient clinical outcomes and predicted drug sensitivity. We first assessed the prognostic effects of ATAC subgroup among patients who received standard intensive chemotherapy. We found significant differences in overall survival across ATAC subgroups (Fig. 5a). Specifically, subgroups A, I, C and B were associated with a favourable prognosis, whereas subgroups L, G, N and O showed poor outcomes. This was confirmed in our cohort and in the BeatAML4 cohort (Supplementary Fig. 13c). Of note, ATAC-inferred differentiation patterns correlated significantly with these outcome differences. To evaluate this, we constructed a deconvolution-based risk score by calculating the weighted sum of cell-type fractions, using coefficients derived from a LASSO model trained on overall survival (Extended Data Fig. 9a). This score was significantly associated with overall survival, varied across ATAC subgroups and was higher in subgroups with a poor prognosis (Extended Data Fig. 9b–d), suggesting that subgroup-specific differentiation states, as reflected in chromatin accessibility, partly explain prognostic heterogeneity.Fig. 5: Distinct prognoses and drug sensitivities across subgroups.a,b, Kaplan–Meier survival curves for overall survival of patients who received intensive chemotherapy, categorized by ATAC subgroup (a) and the combined model of ELN and ATAC (b). P values were calculated using the log-rank test. In the combined model of ELN and ATAC, patients in each ELN risk category were further stratified into two groups on the basis of membership in high-risk ATAC subgroups, determined as shown in Extended Data Fig. 9f: ATAC subgroup E for ELN favourable risk; ATAC subgroups E, F, G and K–M for ELN intermediate risk; and ATAC subgroups D, E, G, O and P for ELN adverse risk. c, Estimates of the C-index derived from ELN and the combined model of ELN and ATAC (as shown in b), using bootstrapping 1,000 times. The combined model was trained in the training (Swedish) cohort and evaluated in both training and validation (Japan) cohorts. Mean ΔC-index indicates the increase in C-index achieved by incorporating ATAC subgroup information into the ELN risk model. CI, confidence interval. d, Heat map summarizing sensitivity to each drug across subgroups. The top left and bottom right triangles in each box indicate the normalized selective drug sensitivity score (sDSS) for our dataset and the normalized AUC for the BeatAML dataset, respectively, with red indicating higher drug sensitivity. P values were calculated by Student’s t-test, corrected for multiple testing by the Benjamini–Hochberg method. *FDR < 0.05; **FDR < 0.01; ***FDR < 0.001. Pearson’s correlation coefficients between our dataset and the BeatAML dataset were calculated for all heat map boxes. P values were derived from two-sided tests. NA, not available. e,f, Sensitivities to MEK (e) and ABL (f) inhibitors for each ATAC subgroup in our cohort. The y axis shows the sDSS; higher values indicate increased sensitivity and positive values indicate effectiveness in AML cells compared with control CD34+ cells. Dashed red lines indicate the median sDSS value across all patients. Sample numbers for each subgroup are as follows: n = 3 (A), 4 (B), 7 (C), 13 (D), 12 (E), 17 (F), 3 (G), 3 (H), 3 (I), 4 (J), 10 (K), 7 (L), 3 (M), 0 (N), 5 (O) and 18 (P). In the box plots, the centre line indicates the median, the box limits indicate the upper and lower quartiles and the whiskers extend to the minimum and maximum values within 1.5× the interquartile range (IQR).Notably, the ATAC-based classification improved prognostication based on ELN risk stratification significantly. To demonstrate this, we first performed multivariable Cox regression analyses to identify the ATAC subgroups that were significantly associated with overall survival in each ELN risk category, by incorporating ATAC subgroups together with known clinical parameters as covariates (Extended Data Fig. 9e,f). We then evaluated their effects on overall survival by stratifying each ELN category by the presence or absence of the high-risk ATAC groups. As shown in Fig. 5b, patients in each ELN category were further separated into two subcategories with different overall survival. Moreover, the improvement on the original ELN model was evident in the independent Swedish and Japanese cohorts, in which significant increases in the concordance index (C-index) of clinical relevance44 were observed (Fig. 5c). Such improvements in prognostication were not obtained for RNA-based subgroups (Supplementary Fig. 20).We also investigated the effects of ATAC subgroup on drug sensitivity. In our eCHROMA cohort, a total of 112 samples were screened against 250 drugs45,46. By combining data from the BeatAML study (569 samples against 166 drugs)31 with our inferred ATAC subgroups (Extended Data Fig. 4), we obtained data for 55 drugs tested in both eCHROMA and BeatAML cohorts (Fig. 5d). Reproducible drug sensitivities across both cohorts were observed for multiple drugs and ATAC subgroups. Some of these drug–subgroup correlations were expected from the enrichment of targetable mutations, such as FLT3 mutations in subgroup E showing high sensitivity to FLT3 inhibitors (quizartinib and giltertinib) (Fig. 5d and Extended Data Fig. 10a,b). In other cases, the sensitivities were not determined by enriched mutations alone. For example, in subgroups C, F and H, sensitivity to MEK1/2 inhibitors (such as selumetinib and trametinib) was not confined to samples with RAS-pathway mutations, but also observed in those lacking RAS-pathway mutations (Fig. 5d,e and Extended Data Fig. 10c), suggesting that the RAS pathway could be epigenetically activated in these subgroups47. Another notable example was an unexpected sensitivity of subgroup K to multiple ABL inhibitors (Fig. 5f and Extended Data Fig. 10d). In scRNA-seq analysis, subgroup K (enriched for RUNX1 mutations) exhibited a maturation block at the early B cell or CLP stage (Fig. 4c), probably owing to the loss of RUNX1 function, a key TF in early B cell development48. The pronounced sensitivity of this subgroup to ABL inhibitors, even in the absence of canonical ABL fusions or mutations, is therefore consistent with previous reports implicating ABL signalling in early B cell development49,50. Nevertheless, it should also be noted that RUNX1-mutated samples in other ATAC subgroups did not exhibit similar sensitivities (Extended Data Fig. 10e), highlighting the subgroup-dependent role of RUNX1 mutations, which is most likely to be explained by the subgroup-specific epigenomic profile.DiscussionWe performed an integrated analysis of the AML epigenome, generating a large dataset comprising ATAC-seq, DNA methylation, ChIP–seq and multiomics scRNA/ATAC-seq data (Fig. 1a). To our knowledge, this represents the most comprehensive epigenomic dataset for a single cancer type. By integrating gene mutation, transcriptome and drug sensitivity data, it serves as an invaluable resource for investigating AML pathogenesis and therapeutic strategies.A central finding of our study is the identification of distinct epigenetic subgroups of AML based on large-scale ATAC data, revealing the profound epigenetic heterogeneity of AML. Despite their enrichment in common AML driver mutations, most ATAC subgroups, except for subgroups A–C and I, are not uniquely defined by known genomic alterations or their combinations, and do not correspond to the subtypes in conventional genetic classifications; as such, they represent novel AML subtypes. These subgroups are associated with distinct profiles of differentiation status, driver mutation enrichment, gene expression, DNA methylation, TF networks, clinical outcomes and drug sensitivities, thereby providing insights into the pathogenesis and heterogeneity of AML. It should be emphasized that the ATAC-based classification does not replace conventional genetic classifications; instead, it provides an alternative view of AML heterogeneity through the lens of the epigenome that is not captured by genetic approaches alone. Furthermore, we cannot entirely exclude the possibility that as-yet-unidentified gene mutations underlie or help define these ATAC subgroups.The biological validity of these distinct ATAC subgroups was further supported by scATAC-seq clustering, in which samples from the same subgroup showed a strong tendency to cluster closely together. This suggests that all leukaemic cells within a subgroup, including LSCs, share a consistent ATAC profile that is distinct from the profiles of other subgroups. We speculate that such a profile—probably shaped by gene mutations in combination with non-genetic mechanisms, such as stem-cell ageing13, the cell of origin12 and inflammatory14 or metabolic insults16—dictates subgroup-specific differentiation trajectories, maturation blocks and other leukaemia phenotypes in a way that cannot be explained solely by genetics.The newly identified ATAC subgroups also enabled us to uncover subgroup-specific gene-expression profiles and to comprehensively identify SEs in AML. These findings were then integrated with ATAC-seq data to delineate subgroup-specific gene-regulatory mechanisms. Our findings contribute to researchers’ understanding of the heterogeneous mechanisms of leukaemogenesis, and highlight the role of TFs and SEs in dysregulated gene expression across subgroups, although further functional validation is required. The strong epigenome–transcriptome correlations enabled gene-expression-based inference of ATAC subgroups, validating the findings from bulk sequencing in independent external cohorts.Finally, our ATAC-based epigenetic classification also has important clinical implications. It has prognostic value independent of the conventional ELN classification, and predicts drug sensitivities that have not been previously recognized. Incorporating high-risk ATAC subgroups improves ELN-based prognostication significantly, and MEK and ABL inhibitors could have a role in treating people with particular ATAC subgroups of AML. These findings provide a framework for personalized therapy based on the ATAC-based classification. In this regard, we have developed reliable models predicting the high-risk ATAC subgroups on the basis of the expression of only 30 genes, which could contribute to improved prognostication and drug selection (Supplementary Fig. 21 and Supplementary Table 11).MethodsPatients and samplesThis study was reviewed and approved by the regional ethics review board in Stockholm (2008/1330-31/2 and 2017/2085-31/2) and the institutional ethics committees of Kyoto University (G608 and G1110) and participating institutions (Hyogo Prefectural Amagasaki General Medical Center, Chugoku Central Hospital, Dokkyo Medical University Saitama Medical Center, Gifu University Hospital, Gifu Municipal Hospital, Hyogo Medical University, Hokkaido University, Japanese Red Cross Kyoto Daini Hospital, Kobe City Medical Center General Hospital, Kurashiki Central Hospital, Kitano Hospital, Kyoto Medical Center, Kyoto City Hospital, Matsushita Memorial Hospital, Japanese Red Cross Nagano Hospital, National Cancer Center Hospital, NTT Medical Center Tokyo, Osaka International Cancer Institute, Japanese Red Cross Osaka Hospital, University of Osaka, Otsu Red Cross Hospital, Shizuoka City Shizuoka Hospital, Shinko Hospital, Shiga General Hospital, Sumitomo Hospital, Takeda General Hospital, Takatsuki Red Cross Hospital, Uji Tokushukai Medical Center and Japanese Red Cross Society Wakayama Medical Center) (no. G608), and was performed in accordance with the Declaration of Helsinki. Informed consent was obtained from all participants at participating institutions.A total of 1,563 patients diagnosed with AML and related neoplasms were consecutively enrolled from the participating institutes and hospitals between 1997 and 2022 in Sweden and between 2011 and 2022 in Japan. Although no preselection criteria were applied with respect to clinical characteristics, sample inclusion was contingent on the availability of viable cryopreserved tumour cells suitable for ATAC-seq for consecutively diagnosed patients with AML. Diagnoses were made at each participating institution and hospital in accordance with the WHO classification in use at the time. In Sweden, patients were registered through the national AML registry, which prospectively collects clinical and genomic data on all newly diagnosed cases. In Japan, patients were diagnosed and treated at participating hospitals, with biospecimens and clinical information sent to and managed by the Kyoto University biobank, where clinical annotations were updated annually. Treatment was administered according to institutional standards of care and, for Swedish individuals, according to the national treatment guidelines for AML, with a subset of patients participating in clinical trials. All samples analysed in this study were collected at the time of initial diagnosis before treatment. Detailed clinical annotations, including diagnosis, demographic and laboratory data, treatment regimens and outcomes, were extracted from electronic medical records and the Swedish AML registry. No statistical methods were used to predetermine sample size. Patient characteristics and diagnoses are summarized in Supplementary Tables 1 and 2.Tumour samples, such as bone marrow or peripheral blood, and matched control buccal samples, were obtained from patients. We also analysed normal bone-marrow samples from 25 individuals without haematological malignancies who underwent hip joint replacement surgery, serving as controls for the ATAC-seq analysis. Bone marrow and peripheral blood cells were isolated, subjected to erythrolysis or mononuclear cell isolation by Ficoll gradient centrifugation, resuspended in CELLBANKER 1 solution (Nippon Zenyaku Kogyo) or in 10% dimethyl sulfoxide (DMSO) (Merck KGaA) with 90% fetal calf serum (FCS; Thermo Fisher Scientific) and cryopreserved in liquid nitrogen. Genomic DNA was extracted using the QIAamp DNA Mini Kit (QIAGEN), the Gentra PureGene Kit (QIAGEN) or the Maxwell RSC Genomic DNA Kit (Promega). RNA was extracted using the RNeasy Mini Kit (QIAGEN) or the Maxwell RSC simplyRNA Tissue Kit (Promega). A summary of this cohort, including diagnosis, ATAC subgroup, AML classifications, driver genes and available multiomics data, is provided in Supplementary Table 3.Cell linesK562, KG-1, THP-1, SKM-1, KY821 and NOMO-1 cells were obtained from the RIKEN BioResource Center Cell Bank (Tsukuba, Japan); Kasumi-1, HL-60, MOLM-13 and TF-1 cells from the American Type Culture Collection (ATCC); and OCI-AML3 cells from the German Collection of Microorganisms and Cell Cultures (DSMZ). These cell lines were authenticated by short tandem repeat profiling and tested for mycoplasma by the providing cell banks.Targeted-capture sequencingTargeted-capture sequencing was performed using the SureSelect custom kit (Agilent Technologies), with an in-house gene panel including 331 known AML driver genes (Supplementary Table 4) and an additional 1,158–1,317 probes for copy-number detection. Captured targets were sequenced using the NovaSeq 6000 (Illumina) or DNBSEQ-G400 (MGI) with a 150-bp paired-end read protocol.Sequence alignment and mutation calling were performed using the hg19 reference genome and Genomon pipeline25,51,52,53 (https://github.com/Genomon-Project). Unless otherwise stated, sequencing data were aligned to the hg19 reference genome. The called variants were further filtered by assessing the oncogenicity of variants on the basis of an in-house curation program25,51,52,53 that uses the COSMIC database (v.96), an in-house blacklist of error calls and public SNP databases, including the 1000 Genomes Project (October 2014 release), NCBI dbSNP build 138, National Heart, Lung, and Blood Institute (NHLBI) Exome Sequencing Project (ESP) 6500, the Human Genetic Variation Database (HGVD) and our in-house dataset.For copy number analysis, SNP probes included in the target bait for targeted-capture sequencing were used to allow the detection of copy-number changes and allelic imbalances25,51,52,53. This program (CNACS) is available at https://github.com/papaemmelab/toil_cnacs. A total copy number (TCN) of 2.22 or higher was defined as gain, and a TCN lower than 1.88 was defined as loss. Copy-number-neutral loss of heterozygosity was called with a B-allele frequency lower than 0.90 and a TCN between 1.88 and 2.22. Arm-level changes were called for regions with a total length greater than 1 Mb. Detected copy-number changes were manually curated.Structural variations (SVs) were detected using the Genomon SV pipeline54, which uses both breakpoint-containing junction read pairs and improperly aligned read pairs. Detected putative SVs were filtered by removing (i) those with fewer than four supporting tumour reads and fewer than ten supporting tumour/normal reads and (ii) those present in control normal samples, whose breakpoints were manually inspected using the Integrative Genomics Viewer (IGV). For KMT2A and MECOM rearrangements, cases other than t(9;11)(p21.3;q23.3) (KMT2A::MLLT3) and inv(3)(q21.3q26.2) or t(3;3)(q21.3;q26.2) (GATA2::MECOM) were classified as SVs with rare partners and annotated with a distinct colour, reflecting their separate classification from KMT2A::MLLT3 and GATA2::MECOM rearrangements in the ICC classification.WGSWGS data were obtained as part of the Japanese national cancer genomics initiative (Genome Research in Cancers and Rare Diseases; G-CARD). A sequencing library was generated using the Illumina DNA PCR-Free Prep Tagmentation Kit according to the manufacturer’s protocol, and sequenced using the NovaSeq 6000 (Illumina) with a 150-bp paired-end read protocol at a target depth of 100× for tumours and 30× for normal controls.The reads were aligned to the human hg38 reference genome by Parabricks. Somatic variants were called in tumour–normal paired mode using Mutect2 (GATK v.4.5.0.0), retaining variants with tumour log-odds (TLOD) ≥ 20 and variant allele frequency ≤ 0.3 in the matched normal. Variants listed in germline databases, such as gnomAD (v.3.1.2), the 1000 Genomes Project and Tohoku Medical Megabank Organization (ToMMo), with a minor allele frequency of 0.001 or higher, were removed. SVs were called using GRIDSS v.2.12.0 and Genomon SV v.0.8.0. Filtered outputs from GRIDSS (‘FILTER = PASS, QUAL ≥ 500, AS > 0, or RAS > 0’) and Genomon SV (‘overhang ≥ 150’) were combined. CNAs were inferred from tumour–normal paired WGS data using Battenberg (v.3.0.0) with default parameters, based on log R ratios and B-allele frequencies of germline heterozygous SNPs.Bulk RNA-seq experiments and analysisLibraries for RNA-seq were prepared using the NEBNext Single Cell/Low Input RNA Library Prep Kit for Illumina (New England BioLabs) and were subjected to sequencing using the NovaSeq 6000 (Illumina) with a paired-end protocol.The sequencing reads were preprocessed by fastp55 with ‘--detect_adapter_for_pe -q 15 -n 10 -u 40’ parameters, and aligned to the reference genome using STAR56. Reads on each gene defined in the University of California, Santa Cruz (UCSC) hg19 gene annotation were counted with featureCounts57. The quality of sequencing data was assessed using mapping and count statistics. Samples were excluded from the analysis if any of the following criteria were met: ‘uniquely_mapped_percent’ (STAR) < 30%, ‘percent_assigned’ (featureCounts) < 30% or ‘assigned’ (featureCounts) < 3 million. The edgeR package58 was used to normalize read counts and calculate counts per million (CPM) values of genes. Genes with CPM > 1 in at least two samples and located on the autosomal chromosomes were kept and used for downstream analysis. To adjust for cohort-specific technical effects while preserving biological variation, batch correction between the Swedish and Japanese cohorts was performed using linear modelling in limma59. Differentially expressed genes (DEGs) for each subgroup were identified using the eBayes test in limma through a one-versus-rest comparison, with thresholds of FDR < 0.05 and |log2-transformed fold change| > 0.5. The top 3,000 DEGs in each subgroup are provided in Supplementary Table 8. GSEA analysis was performed on genes ranked by fold change using the GSEA function in the clusterProfiler package60 (minGSSize = 20, pAdjustMethod = “BH”) and a curated set of genes associated with haematopoietic cells and AML derived from the Human Molecular Signatures Database (MSigDB)61 (Supplementary Table 10). Gene fusions were detected using the Genomon fusion pipeline (https://github.com/Genomon-Project/fusionfusion) and filtered for known drivers of AML.Bulk ATAC-seq experimentsATAC-seq experiments were performed using the Fast-ATAC protocol21,62. Cryopreserved tumour cells were thawed, and 50,000 cells were pelleted. Fifty microlitres of transposase mixture (comprising 25 µl 2× TD buffer, 2.5 µl TDE1 (Illumina, FC-121-1031), 0.5 µl 1% digitonin (Sigma-Aldrich, D141) and 22 µl nuclease-free water) was added to the cells. After transposition reactions at 37 °C for 30 min, transposed DNA was purified using the QIAGEN MinElute Reaction Cleanup Kit or Sera-Mag Select (Cytiva) magnetic beads, and PCR-amplified using the NEBNEXT Q5 Hot Start HiFi PCR Master Mix and custom primers63. The TapeStation 4200 (Agilent) with High Sensitivity D5000 ScreenTape was used to assess fragment size and confirm nucleosomal periodicity, a characteristic feature of ATAC-seq libraries20,64. The resulting library was sequenced using the NovaSeq 6000 (Illumina) with a paired-end protocol.Bulk ATAC-seq analysisReads were aligned to the reference genome using Bowtie265 with ‘-X 2000 –no-mixed –very-sensitive’ parameters, after adapter trimming using Skewer66. The quality of sequencing data was assessed using ataqv67 and ATACseqQC68. Samples were excluded from the analysis if any of the following criteria were met: fewer than six million uniquely mapped reads; mapping rate lower than 40%; more than 30% of reads on mitochondrial chromosome; or transcription start site (TSS) enrichment scores lower than 2 in both 1,000 and 2,000 bp windows. After removing duplicates and reads on the mitochondrial genome or blacklisted regions (ENCODE), peaks were called using HMMRATAC69 with the ‘--window 2500000’ parameter and peaks were fixed to a width of 501 bp centred on the peak summit64. When extended or merged peaks overlapped, the region with the highest peak score was retained. For each of the six datasets—including our own datasets (Swedish AML, Japanese AML, AML cell lines and normal bone marrow) as well as public datasets21 (sorted normal blood and AML cells)—we merged peaks from all samples in each dataset. Peaks that overlapped in two or more samples were considered the recurrent peak set for each dataset. For samples from patients with AML, Swedish and Japanese peak sets were further merged and filtered for those recurrently identified in both the Swedish and the Japanese samples. We then merged five peak sets generated as above (samples from patients with AML (eCHROMA), AML cell lines, normal bone marrow, public normal blood and public AML) to generate a union peak set fixed to a width of 501 bp, which was used for downstream analysis (Extended Data Fig. 1b). Annotation of peaks was done using the annotatePeaks function in HOMER70. Reads on peaks were counted and normalized to calculate CPM values using edgeR58. Differentially expressed ATAC peaks (DEPs) for each subgroup were identified using the eBayes test in limma through a one-versus-rest comparison, with thresholds of FDR < 0.05 and |log2-transformed fold change| > 0.5. The top 3,000 DEPs in each subgroup are provided in Supplementary Table 9. Inference of cellular contribution to each ATAC-seq data was evaluated by the CIBERSORTx27 with CPM values of our AML data and public data for 13 normal blood cell types21 as input files.Clustering analysis using bulk ATAC-seqATAC log2 CPM were quantile normalized using preprocessCore (https://github.com/bmbolstad/preprocessCore), followed by the exclusion of peaks on chromosomes X and Y. Batch correction was applied as described above. To focus on leukaemia-intrinsic chromatin variation and minimize contamination from non-malignant cells, peak variance was calculated using samples with at least 75% bone-marrow blasts. The 3,000 most variable peaks were selected to capture dominant inter-sample chromatin heterogeneity while reducing noise from low-variance regions. The first 50 principal components were determined by prcomp in R, a nearest-neighbour graph was generated using buildSNNGraph in the scran package71 with a ‘k = 7’ parameter and Leiden clustering72 was performed using ‘cluster_leiden’ from the igraph package with parameters of ‘resolution = 0.2’ and ‘n_iterations = 100’. Clusters with less than 1% of samples (fewer than 16 out of 1,563 cases) were reassigned to the cluster of the nearest sample by calculating the squared Euclidean distance between samples in the two-dimensional UMAP space. ATAC subgroups were annotated with representative genetic alterations and/or differentiation states (for example, A, PML::RARA) to aid interpretability. Labels were assigned on the basis of enriched and relatively specific features within each subgroup, including mutation patterns and differentiation signatures, but do not indicate that subgroup identity is defined solely by these alterations. For high-resolution clustering, we used a resolution of 0.3 with all other parameters kept the same.Clustering stabilityTo evaluate the robustness of the Leiden clustering results, we performed a resampling-based stability analysis. First, we repeatedly subsampled 90% of the samples and re-applied the same clustering parameters (resolution = 0.2, k = 7 neighbours) for 100 iterations, calculating the adjusted Rand index between the original and each resampled clustering to quantify overall agreement; adjusted Rand index values close to 1 indicate strong stability. Second, we computed a sample-wise consistency score for each sample, defined as the fraction of iterations in which the sample clustered together with its original cluster members, conditional on co-occurrence, thus measuring the stability of cluster membership at the individual sample level. Third, we constructed a cluster–cluster similarity matrix that captures the probability that samples from different clusters co-cluster across all resampling runs, providing a summary of within-cluster consistency and potential cross-cluster mixing.Decision-tree modelling based on genomic alterationsTo test whether ATAC-defined subgroups could be explained by simple combinations of genomic alterations, we constructed one-versus-rest decision-tree classifiers using gene mutations, CNAs and SVs as binary input features. For each of the 16 ATAC subgroups, a binary classifier was trained using a CART framework implemented in the rpart package in R. Rare alterations (present in fewer than four positive samples) were excluded from model training. Samples were randomly split into training (80%) and test (20%) sets. Tree depth was fixed at a maximum depth of 3 to constrain model complexity and emphasize interpretability. The splitting criterion was Gini impurity. Class predictions were derived using a fixed probability threshold of 0.5. Model performance was evaluated on the independent test set using sensitivity, positive predictive value (PPV), F1 score and balanced accuracy. Model complexity was quantified as the number of internal splits in the final tree. To examine how performance changed with increasing model complexity, we also trained models across a range of maximum tree depths (2–12), while keeping all other parameters fixed.Bulk-RNA-seq-based prediction of ATAC subgroupsNormalized gene-count data for four external adult AML cohorts were obtained from a previous study10. The TARGET cohort was excluded from the analysis because it consisted mainly of paediatric AML. The count matrix was quantile normalized and merged with our RNA-seq count matrix, followed by batch correction using ‘removeBatchEffect’. Prediction models for ATAC subgroups were generated using the ClaNC algorithm, a nearest-centroid classifier that ranks genes by standard t-statistics and selects subgroup-specific genes30. Fifteen genes per subgroup were selected for subgroup-specific markers and incorporated into the prediction model. Gene lists used for each prediction model are summarized in Supplementary Table 11. The accuracy of prediction models was calculated by fivefold cross-validation, separating 80% of samples for training and the remaining 20% for validation.DNA methylation experiments and analysisDNA methylation profiles were analysed using the Infinium MethylationEPIC BeadChip Kit according to the manufacturer’s protocol. The raw files were processed using the ChAMP package in R, filtering probes and generating the normalized β-value matrix. Common probes across samples were used for downstream analysis. To correct batch effects between different cohorts and probe sets, the ‘removeBatchEffect’ command from the limma package59 was used.For comparison between chromatin accessibility and DNA methylation, ATAC peak regions overlapping with methylation probes were analysed. DNA methylation levels in a given region were calculated as the average β-values of all probes in the region. For each ATAC subgroup, average DNA methylation levels were computed, and the top 3,000 regions with the most variable DNA methylation levels across subgroups were visualized in heat maps.GRN analysis by bulk ATAC-seq and RNA-seqGRNs were inferred using the ANANSE software35. In brief, this software integrates chromatin accessibility and gene-expression data to infer enhancer-based GRNs. Input data included the consensus ATAC peak set, a merged ATAC-seq BAM file, mean RNA expression (log2 CPM) and the default motif database (GimmeMotifs73).For each TF, ANANSE estimates genome-wide binding potential, predicts target genes and incorporates expression levels of the TF and its targets to model regulatory interactions. The regulatory importance of each TF is quantified by two key metrics: out-degree (the number and strength of predicted regulatory connections) and link score (the strength of each individual connection). GRNs were constructed for each ATAC subgroup and for the entire AML cohort. To identify subgroup-specific regulators, we compared each subgroup GRN with the global AML GRN and calculated TF influence scores, which measure how much a TF explains differences in expression between the two groups (Extended Data Fig. 6a). The top 20 differential TFs per subgroup were visualized.ChIP–seq experiments and analysisChIP–seq experiments were performed according to the SimpleChIP Plus Sonication Chromatin IP Kit (Cell Signaling Technology)62 with minor modifications. Cryopreserved cells were thawed, and more than one million cells were fixed with 1% formaldehyde (Thermo Fisher Scientific) in phosphate-buffered saline (PBS) for 10 min at room temperature with gentle mixing. The reaction was stopped by adding glycine solution (10×) (Cell Signaling Technology) and incubated for 5 min at room temperature, and the cells were washed twice in cold PBS. The cells were then processed with the SimpleChIP Plus Sonication Chromatin IP Kit (Cell Signaling Technology) and Covaris E220 (Covaris) according to the manufacturer’s protocol. The antibodies used for ChIP were as follows: SMC1 (Abcam, ab9262), CTCF (Cell Signaling Technology, D31H2), RPB1 (Cell Signaling Technology, D8L4Y), H3K27ac (Cell Signaling Technology, D5E4) and H3K27me3 (Cell Signaling Technology, C36B11). After purification of the precipitated DNA, libraries were constructed using the ThruPLEX DNA-seq Kit (Takara) as per the manufacturer’s protocol, and subjected to sequencing using the NovaSeq 6000 (Illumina). ChIP–seq experiments were performed with input controls. The sequencing reads were aligned to the reference genome using Bowtie74, after adapter trimming with Skewer66 and read tail trimming to a total length of 50 bp using Cutadapt75. The quality of sequencing data was assessed using ‘plotFingerprint’ in deepTools76. Samples were excluded from the analysis if any of the following criteria were met: ‘X-intercept’ (deepTools) > 0.85 or ‘Synthetic JS Distance’ (deepTools) < 0.225. After removing duplicates and reads on blacklisted regions (ENCODE)77, peaks were called using MACS278 and a P value threshold of 1 × 10⁻³ with an input control for each sample. For each ChIP–seq (SMC1, CTCF, RPB1, H3K27ac and H3K27me3), peaks were merged for all AML samples, and recurrently identified peaks were regarded as a consensus peak set.SE analysisTo identify SEs, recurrent enhancers were first identified in all AML samples using H3K27ac ChIP–seq data. Identified enhancers were stitched and ranked with H3K27ac ChIP–seq and input data, using ROSE34 with a ‘-t 2500’ parameter. Mean signals were used to calculate enhancer ranks across all AML samples. To identify SEs for each ATAC subgroup, mean signals were calculated to identify the top 750 enhancers in each ATAC subgroup, which were regarded as SEs. SEs were separated into three categories on the basis of their distribution across subgroups: common SEs (present in 12 or more subgroups), partially shared SEs (present in 2 to 11 subgroups) and unique SEs (specific to a single subgroup). Subgroup-specific SEs were defined as those found in each subgroup and categorized as partially shared or unique SEs. Known SEs for various cell types and cancers were obtained from previous reports34. Annotation of SEs was done using annotatePeaks in HOMER70, filtering for genes expressed in our AML cohort (logCPM > 1 in more than 1% of patients). AML driver genes and TF genes were determined using databases, including the Catalogue of Somatic Mutations in Cancer (COSMIC) Cancer Gene Census (CGC) (as of 6 November 2024)79, the database of leukaemia gene literature (dbLGL)80, a list of TFs from a previous study81 and the JASPAR21,82 database, and were manually selected. A list of SEs identified in this study is provided in Supplementary Table 6.SE-regulated gene signaturesEnriched gene ontologies in SE-associated genes were identified using enricher in the clusterProfiler package60 (pAdjustMethod = “BH”, qvalueCutoff = 0.25) and ontology geneset (‘hallmark’, ‘c2.cp.reactome’ and ‘c5.go.bp’) from MSigDB (v.2024.1)61. Expression levels of SE-associated genes in each haematopoietic cell type were calculated using public gene-expression data from DMAP83, and the average expression levels were determined for each cell type.SE-based TF network analysisTo analyse SE-regulated TF networks, we applied the Coltron software36 with ROSE34 outputs generated from the merged H3K27ac BAM files for each ATAC subgroup. This software computes the inward binding (in-degree) of other SE-associated TFs to a given SE-associated TF, as well as the outward binding (out-degree) of the TF to other SEs. The Coltron score for each TF was determined as the sum of its in-degree and out-degree (Extended Data Fig. 6c).scRNA/ATAC-seq experimentsSingle-cell matched RNA-seq and ATAC-seq experiments were performed using the Next GEM Single Cell Multiome ATAC + Gene Expression Reagent Kit (10x Genomics), according to the manufacturer’s protocols (CG000365 for nuclei isolation and CG000338 for library generation). Cryopreserved cells were thawed, dead cells were stained with DAPI and live mononuclear cells were sorted using FACS Aria III (BD Biosciences). The samples were resuspended in lysis buffer (10 mM Tris-HCl (pH 7.4), 10 mM NaCl, 3 mM MgCl2, 1% bovine serum albumin (BSA; Miltenyi Biotec, 130-091-376), 0.1% Tween-20 (Bio-Rad, 1610781), 0.1% IGEPAL (Sigma-Aldrich, i8896), 0.01% digitonin (Thermo Fisher Scientific, BN2006) and 1 mM DTT (Sigma-Aldrich, 646563), plus 1 U μl−1 RNase inhibitor (Thermo Fisher Scientific, 10777019)), incubated on ice for 3 min, washed three times with wash buffer (10 mM Tris-HCl (pH 7.4), 10 mM NaCl, 3 mM MgCl2, 1% BSA, 0.1% Tween-20 and 1 mM DTT, plus 1 U μl−1 RNase inhibitor) and passed through a 40-μm Flowmi Cell Strainer (Bel-Art). After microscopy inspection and counting of nuclei using a Countess II FL Automated Cell Counter (Thermo Fisher Scientific), nucleus suspensions were prepared in a concentration targeting a maximum of 10,000 nuclei recovery, and incubated with transposase to add adapter sequences to the DNA fragments. The suspensions containing transposed nuclei were subjected to gel bead in emulsion (GEM) generation, incubation, and clean-up, using the Chromium Next GEM Chip J Single Cell Kit (10x Genomics) and Chromium Controller. The resulting suspensions contained ATAC fragments and cDNA with the same cell barcodes. Pre-amplification of cDNA was performed, and the amplified product was split and used as the input for ATAC and gene-expression library construction. Libraries were generated using the 10x Genomics Single Index N Set for ATAC and the 10x Genomics Dual Index TT Set A for RNA. The scATAC libraries were sequenced using the DNBSEQ-G400 (MGI) with a custom protocol (read 1: 50 cycles, read 2: 49 cycles, i5 Index: 24 cycles, i7 Index: 8 cycles). The scRNA libraries were sequenced using the DNBSEQ-G400 (MGI) with a custom protocol (read 1: 28 cycles, read 2: 90 cycles).scRNA/ATAC-seq analysisCell Ranger ARC (10x Genomics)84 was used for data processing to generate BAM files and count matrices for scRNA and scATAC with the reference genome and GENCODE human v.19 annotation85. The report generated by Cell Ranger was manually evaluated and samples were filtered to remain with no errors or with only warnings. Basic quality-control reports including analysed cell numbers from Cell Ranger for each sample are summarized in Supplementary Table 7. ArchR86 was used to filter for cells with the following thresholds: number of unique molecular identifiers > 100 and proportion of mitochondria genes < 0.05 for scRNA; TSS enrichment score > 4 and number of fragments > 1,000 for scATAC. Doublet cells were removed by the ‘filterDoublets’ function in ArchR with a filterRatio of 1. The gene-expression count matrix was stored in the Seurat87 object, and mitochondrial genes were excluded from the following analysis. The consensus peak set generated from bulk ATAC-seq was filtered for peaks on autosomal chromosomes and used to count reads on peaks in the scATAC analysis, using the FeatureMatrix function from the Signac package88.Merging individual data, normalization and clustering for scRNA/ATAC-seqRaw count matrix data for single-cell gene expression and chromatin accessibility was written to disk using the BPCells package (https://github.com/bnprks/BPCells) to enable high-throughput data processing and merged across samples. The merged gene-count matrix was normalized for sequencing depth using the SCTransform function in Seurat87. scRNA-based clustering was done using the first 50 principal component analysis (PCA) dimensions with the FindNeighbors and FindClusters functions (resolution = 0.15, algorithm = 1). scRNA UMAP was computed using the first 50 PCA dimensions with RunUMAP (n.neighbours = 30, min.dist = 0.1). The merged count matrix for scATAC was normalized using the term frequency inverse document frequency (TF-IDF) normalization function in BPCells. Cells were clustered on the basis of scATAC using the PCA dimensions 2 to 20 with knn_hnsw (ef = 3000), knn_to_snn_graph and cluster_graph_louvain (resolution = 0.15) functions in BPCells. Each scATAC cluster was classified as AML-predominant if it met both of the following criteria: (i) the average proportion of cells derived from remission samples was less than 10%; and (ii) at least one AML subgroup contributed 25% or more of its cells to the cluster. Clusters not satisfying these criteria were classified as normal-mixed. scATAC UMAP was computed using the PCA dimensions 2 to 20 with the umap function in the uwot package (n.neighbours = 30, min.dist = 0.1).Estimation of differentiation, pseudotime and LSC scores using scRNA-seqThe BoneMarrowMap package in R was used to project AML cells onto reference scRNA-seq data of human bone-marrow haematopoiesis41. Cells with low mapping quality were excluded from the analysis according to the following criteria: (1) mean absolute deviation of mapping error scores ≧ 2; (2) assigned to ‘orthochromatic erythroblast’ and AUC score of haemoglobin genes < 0.2, calculated using the AUCell package. Pseudotime analysis was performed using the ‘predict_Pseudotime’ function in BoneMarrowMap. The LSC score was computed as the AUC for gene set enrichment of LSC signatures, defined by DEGs specific to sorted LSC+ fractions41,42.Single-cell GRN analysisTF activity was inferred using SCENIC+43, which integrates matched scRNA-seq and scATAC-seq data to construct GRNs at single-cell resolution. The analysis followed the standard SCENIC+ pipeline with minor modifications (Extended Data Fig. 8a). We used a multiome mode with 5 cells per metacell, and empirically set the number of topics to 100. The search space for regulatory elements was defined as 0–500 kb from each gene. Established eRegulons were filtered with the following parameters: ‘rho_threshold’ = 0.03, ‘min_regions_per_gene’ = 0 and ‘min_target_genes’ = 10. For group-level comparisons, cells were downsampled to 2,000 per ATAC subgroup when calculating region-based and gene-based specificity scores. For pseudotime analysis, cells were downsampled to 300 per pseudotime bin in each ATAC subgroup if more than 300 cells were present in that bin. Direct positive eRegulons (those with positive TF-to-gene and region-to-gene links) were used for downstream analyses. Extended eRegulons were included only when direct ones were unavailable.Drug sensitivity screening in samples from patients with AMLThe procedure for drug sensitivity and resistance testing in the samples used for the study has been described in detail previously46. Biobanked mononuclear cells were thawed and added to pre-spotted drug plates (FIMM HTB)89. The mononuclear cells were incubated in HS-5 conditioned (12.5%; ATCC) complete RPMI (10% FBS (Thermo Fisher Scientific), 2 mM l-glutamine (Sigma-Aldrich), 100 IU ml−1 penicillin and 0.1 mg ml−1 streptomycin (Pen-Strep; Sigma-Aldrich)), for 72 h (37 °C, 5% CO2). Cell viability was measured by CellTiter-Glo (CTG; Promega) on an EnSight plate reader (PerkinElmer). Drug sensitivity scores (DSSs) were calculated with Breeze90. Selective DSS (sDSS) values were calculated by subtracting the DSSs of healthy bone-marrow control samples from the DSSs of samples from patients with AML.Survival analysisSurvival analysis was performed for patients who were treated with standard intensive chemotherapy, and observations were censored at the last follow-up. For clinical parameters, the median values were used as the threshold unless otherwise specified. Overall survival was estimated using the Kaplan–Meier method, and differences between groups were evaluated by the log-rank test.To assess the prognostic relevance of deconvolution patterns, we performed feature selection using LASSO-penalized Cox proportional hazards regression (glmnet R package, alpha = 1), incorporating the estimated proportions of 13 haematopoietic cell populations derived from ATAC-seq–based deconvolution as explanatory variables, with overall survival as the outcome. The optimal penalty parameter (lambda.min) was selected by cross-validation. The resulting coefficients were used to compute a LASSO-based risk score for each patient, defined as the weighted sum of the corresponding cell fractions.To determine whether ATAC subgroups provided extra prognostic information beyond established genomic risk categories, multivariable Cox proportional hazards models were fitted separately within each ELN 2022 risk group. These models included age, sex, WBC, haemoglobin level, platelet count, blast percentage and ATAC subgroup membership as covariates. Subgroups that were significantly associated with worse overall survival within each ELN stratum were designated as high-risk ATAC subgroups. We stratified patients in each ELN category into two groups according to the presence or absence of these risk ATAC subgroups and compared overall survival in Kaplan–Meier analyses. To evaluate the additive prognostic value of ATAC subgroups, we built a Cox model for ELN 2022 risk classification and compared it with a combined model of ELN and ATAC risk groups (Fig. 5b). Model performance was assessed by calculating the C-index using 1,000 bootstrap replicates in both the training (Swedish) and the validation (Japanese) cohort. The incremental prognostic value of ATAC subgroups was quantified as the difference in C-index between models, assessed across the same bootstrap replicates.Statistical analysisExperimental replication was not performed. The robustness of the findings is supported by the large cohort size (n = 1,563) and the consistency of results across several independent analytical approaches, data types and independent cohorts. Statistical analyses were performed in R. Comparisons between groups were based on the two-sided Wilcoxon rank-sum test for continuous data and the Fisher’s exact test for categorical data, unless otherwise specified. Explained variances in several features by ICC, WHO and ATAC classifications were evaluated as R2 values calculated by the adonis function in R, with Euclidean distances. For gene-expression profiles, the first 50 principal components were used as input.Reporting summaryFurther information on research design is available in the Nature Portfolio Reporting Summary linked to this article.
Chromatin landscape and epigenetic heterogeneity of acute myeloid leukaemia - Nature
An ATAC-seq-based approach is used to classify acute myeloid leukaemia (AML) into 16 epigenomic subgroups, and provides insight into the role of non-genetic mechanisms in determining pathogenesis, clinical behaviour and drug sensitivity in this disease.
16,940 words~77 min read