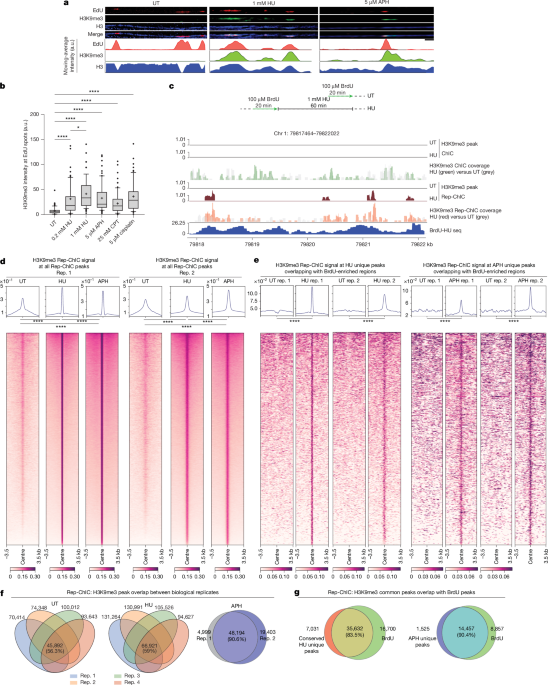
MainDNA replication is frequently challenged by endogenous and exogenous insults that induce replication stress, a major driver of genome instability and cancer4,5. These challenges, including diverse DNA lesions, restricted nucleotide availability and transcription–replication conflicts, impede fork progression and necessitate protective responses6,7.Replication timing is closely linked to chromatin organization, with early-replicating regions associated with open chromatin and late-replicating regions enriched in heterochromatin8. This spatiotemporal organization influences susceptibility to replication stress and genome instability2,8,9,10. In response to stress, cells activate checkpoint pathways to stabilize stalled replication forks, where nascent DNA is highly vulnerable to degradation11,12. Concomitantly, chromatin undergoes dynamic reorganization when DNA replication forks are challenged1,2. We previously showed that the histone methyltransferase G9a (encoded by EHMT2) promotes de novo H3K9 methylation at stressed replication forks, driving local chromatin compaction and protecting nascent DNA from error-prone polymerases to facilitate fork restart3.However, whether such local chromatin changes scale to higher-order genome organization remains unclear. Here we show that replication stress induces ATR-dependent CTCF anchoring and G9a-mediated heterochromatin assembly to form transient chromatin loops at stressed forks. These structures create a protective architectural scaffold that limits nuclease access and stabilizes replication intermediates.Mapping heterochromatin at stressed forksUsing our single-molecule chromatin fibre ChromStretch assay, we previously showed that hydroxyurea (HU)-induced (1 mM HU, 1 h) fork stalling triggers transient, G9a-dependent de novo H3K9me3 deposition on nascent DNA, at single forks and replication bubbles, that dissipates quickly once stress is relieved3.To determine whether this response is conserved, we analysed cells exposed to diverse replication stressors (0.2–1 mM HU, camptothecin (CPT), aphidicolin (APH), cisplatin) and observed a common accumulation of H3K9me3 at 5-ethynyl-2′-deoxyuridine (EdU)-labelled replication sites, albeit to varying degrees. This indicates a general, replication stress-dependent chromatin response (Fig. 1a,b and Extended Data Fig. 1a,b).Fig. 1: Single-molecule analysis and genome-wide mapping reveal de novo heterochromatin formation at stressed DNA replication sites.a, Representative chromatin fibres (ChromStretch) without treatment (left), with 1 mM HU (middle) or with 5 µM APH (right) for 1 h. EdU (red), H3K9me3 (green) and H3 (blue) are visualized. Bottom, the corresponding intensity quantifications. a.u., arbitrary units. Scale bar, 2 μm. b, The distribution of H3K9me3 intensity at EdU spots. Numbers of EdU sites analysed per condition: from left to right, n = 72, 75, 68, 70, 77 and 76, imaged from one representative experiment, which was been performed twice with similar results. Statistical analysis was performed using Kruskal–Wallis tests followed by Dunn’s test; from bottom to top, P < 0.0001, P = 0.0281, P < 0.0001, P < 0.0001, P < 0.0001, P < 0.0001. c, The experimental design for ChIC/Rep-ChIC (top). Cells were labelled with 100 µM BrdU (20 min) with or without 1 mM HU (1 h). Bottom, H3K9me3 ChIC and Rep-ChIC peak profiles, raw coverage and BrdU-HU seq coverage at a representative chromosome (chr.) 1 region. d, The H3K9me3 Rep-ChIC signal at all Rep-ChIC peaks identified in the UT, HU and APH conditions across two biological replicates (rep.). Top, the aggregate average signal over a ±3.5 kb window. Bottom, tornado plot across the same window. Statistical analysis was performed using two-sided Mann–Whitney U-tests; from left to right, P < 1 × 10−308, P < 1 × 10−308, P < 1 × 10−308, P = 2.93 × 10−192 (top) and P < 1 × 10−308, P < 1 × 10−308 (bottom). e, H3K9me3 Rep-ChIC signal at newly formed peaks after 1 mM HU or 5 µM APH overlapping with BrdU-enriched regions across two biological replicates. The aggregate average (top) and tornado (bottom) plots are shown over a ±3.5 kb window. Statistical analysis was performed using two-sided Mann–Whitney U-tests; from left to right, P = 3.49 × 10−136, P = 9.44 × 10−234, P = 1.99 × 10−324 and P = 8.45 × 10−248. f, The H3K9me3 peak overlap between biological replicates in the UT (n = 4), HU (n = 4) and APH (n = 2) conditions. g, The overlap between conserved, newly formed H3K9me3 peaks (HU or APH) and BrdU-enriched peaks. ****P < 0.0001, *P < 0.05.Using ChromStretch, we observed that H3K9me3 accumulates broadly across newly replicated, stress-exposed regions, indicating that this response is genome wide, but strictly replication dependent. We next sought to map the genomic distribution of these de novo H3K9me3 peaks. As a 1 h treatment with 1 mM HU induces fork stalling in over 94% of replication forks in around 99% of S phase cells, as confirmed by DNA fibre and a flow cytometry assays (Extended Data Fig. 1c,d), we performed chromatin immunocleavage (ChIC) (Extended Data Fig. 2a) followed by sequencing for H3K9me3 in asynchronous cell populations of human fibroblast MRC5 cells (47–50% S phase cells; Extended Data Fig. 2b,c). Cells were treated with 1 mM HU for 1 h (hereafter, HU treatment) and H3K9me3 profiles were compared with the untreated (UT) controls. However, across two biological replicates, standard ChIC did not reveal clear differences between the HU-treated and UT samples: neither coverage profiles nor peak calling identified new peaks after HU treatment, and even aggregate plots of H3K9me3 signal centred on peak regions showed no discernible change (Fig. 1c and Extended Data Fig. 2d,e). This probably reflects a limitation of ChIC in asynchronous populations, in which H3K9me3 changes at newly replicating regions are masked by the large fraction of non-replicating chromatin.To overcome this limitation and systematically map H3K9me3 at active replication sites, we developed an approach called Rep-ChIC (Extended Data Fig. 2a). In this method, cells were labelled with a short 20 min pulse of the thymidine analogue 5-bromo-2′-deoxyuridine (BrdU) to mark newly replicated regions, followed by exposure to replication stress or UT control conditions. Given that a 1 h treatment with 1 mM HU stalls forks within around 2.5–3 kb, as determined by DNA fibre analysis, we reasoned that enriching H3K9me3 by ChIC followed by pull-down of BrdU-labelled nascent DNA to generate sequencing libraries (Extended Data Fig. 2a) would allow precise identification of H3K9me3 peaks at actively replicating sites undergoing replication stress. Analysis of euchromatic regions lacking H3K9me3 peaks under UT conditions revealed the appearance of new H3K9me3 peaks at replication sites after HU treatment (Fig. 1c, Extended Data Fig. 2d and Supplementary Fig. 1). Although a moderate global increase in H3K9me3 coverage was observed, Rep-ChIC detected robust and reproducible enrichment centring at peak regions across four biological replicates (Fig. 1d and Extended Data Fig. 2f), in contrast to ChIC, which showed no clear differences between HU and UT conditions (Extended Data Fig. 2e). HU-induced or enhanced H3K9me3 peaks overlapped extensively with BrdU-labelled nascent DNA (Fig. 1e and Extended Data Fig. 2g,h). These peaks were highly reproducible (around 90% overlap between replicate pairs; over 56% across all replicates) and showed strong colocalization with BrdU signals (>80–90%) (Fig. 1f,g and Extended Data Fig. 3a,b), indicating recurrent hotspots of replication-fork pausing.As 5 μM APH stalls forks at a similar rate to 1 mM HU (>93% of replication forks in >98% of S phase cells; Extended Data Fig. 1c,d) and triggers H3K9me3 accumulation at newly replicated DNA undergoing stress (Fig. 1a), we examined whether it elicits a comparable chromatin response. Rep-ChIC analysis revealed robust, reproducible de novo H3K9me3 peaks under APH, suggesting that fork stalling at specific genomic hotspots may be preserved across distinct replication-stress inducers (Fig. 1d,e, Extended Data Fig. 2d,g–h and Supplementary Fig. 1). Approximately 40,000 peaks were shared between HU and APH, representing around 80% of APH-conserved and around 50% of HU-conserved peaks, consistent with the higher total peak number detected under HU (Extended Data Fig. 3c). Across four HU biological replicates and two APH replicates, de novo H3K9me3 deposition was largely replication dependent and distributed across all chromosomes (Fig. 1g and Extended Data Fig. 3b,d), whereas such differences were not readily detected by ChIC alone (Extended Data Figs. 2e and 3d).To assess whether this response is influenced by replication timing, we defined early and late initiation zones (IZs) using Repli-seq13 and mapped IZs by TrAEL-seq14 in MRC5 cells (Extended Data Fig. 3e). Rep-ChIC revealed comparable H3K9me3 accumulation at both early- and late-replicating regions after HU treatment (Extended Data Fig. 3f), indicating that replication-coupled de novo heterochromatinization occurs globally, independent of replication timing.De novo H3K9me3 boosts interactions at fountainsTo test whether transient H3K9me3 at stalled forks drives higher-order genome reorganization, we performed a proximity ligation assay (PLA) targeting H3K9me3 at replication sites using high-content imaging. Under replication stress (1 mM HU, 1 h; or 4 mM HU, 1 h), both the intensity and size of PLA foci increased (Extended Data Fig. 4a), suggesting that G9a-mediated H3K9me3 accumulation at stressed replication sites promotes clustering of replication factories (Extended Data Fig. 4b–e). We therefore hypothesized that de novo H3K9me3 formation at stalled forks may drive global chromosomal reorganization. To examine genome-wide architecture, we performed in situ Hi-C15 and developed Rep-Hi-C, enriching for interactions at newly replicated DNA by pulsing cells with BrdU before HU treatment (Extended Data Fig. 5a), conceptually similar to Repli-Hi-C16.Hi-C and Rep-Hi-C libraries were prepared as described previously (HiC-2.0)15, and high-quality reads (MAPQ > 30) were used for downstream analysis (Supplementary Table 1). Saddle plot analyses17 across replicates revealed a moderate but statistically significant increase in B–B interactions (defined as interactions between genomic regions that both belong to the B compartment) in Rep-Hi-C data in the 1 h HU condition compared with in the Hi-C data, accompanied by a HU-induced shift towards heterochromatic eigenvectors (Fig. 2a and Extended Data Fig. 5b,c). As G9a catalyses de novo H3K9me3 at stalled forks3, we repeated Rep-Hi-C after short-term G9a inhibition (UNC0642, hereafter G9ai) for 2 h with or without HU (4 mM, 1 h), which did not alter the cell cycle distribution (Extended Data Fig. 2b). While G9ai had an unavoidable impact on compartmentalization in UT cells, it abolished the HU-induced increase in heterochromatin interactions in Rep-Hi-C (Fig. 2a), indicating that this replication-stress-associated strengthening is G9a dependent.Fig. 2: Heterochromatin-driven 3D chromatin contacts stabilize sister replicons under replication stress.a, Hi-C and Rep-Hi-C design in MRC5 cells (top). Below, saddle plots of genome-wide compartmentalization (observed/expected (O/E) contacts) and differential interactions (HU–UT O/E differences) at a 50 kb resolution based on EV1 percentiles. Homotypic B–B/A–A compartments are indicated. The colour scale represents the O/E contact frequency. b, Rep-Hi-C (left), Hi-C (middle) and Rep-Hi-C minus Hi-C (right) contact matrices for a 2 Mb region surrounding a fountain on chromosome 20. The schematics above or below the matrices indicate the centre of IZs identified by TrAEL-seq. The schematic (top right) depicts the formation of a dynamic loop centred on a fountain, which stabilizes after replication stress. The diagram was created using BioRender; Taneja, N. https://BioRender.com/gx78yzy (2026). Top right matrix, magnified HU (Rep-Hi-C − Hi-C) differential matrix; the dotted circles highlight increased interactions at the fountain apex. Bottom right, differential Rep-Hi-C signals. The colour scale represents the O/E contact frequency. c, Schematics of increased chromatin contacts and HU-induced, G9a-dependent stabilization of a chromatin loop at fountains. d, H3K9me3 Rep-ChIC signal centred on fountains overlapping with IZs (blue) or TZs (green). Aggregate average (left) and tornado plots (middle, right) over a ±3.5 kb window. The colour scale shows the normalized Rep-ChIC read coverage across the region. Statistical analysis was performed using two-sided Mann–Whitney U-tests; NS, not significant; from left to right, P = 6.20 × 10⁻⁸, P = 9.35 × 10⁻³, P = 8.9 × 10⁻⁸, P = 2.7 × 10⁻⁴ (top) and P = 0.521 and P = 0.559 (bottom). The results shown are from one biological replicate. e, Aggregate analysis of chromatin contact matrices within a ±250 kb window aligned at the midpoint of all Rep-Hi-C fountains (top) and differential matrices (bottom). f, The signal distribution in the differential contact matrices from e. n = 2,600 bins analysed. Statistical analysis was performed using two-sided Mann–Whitney U-tests; from top to bottom, P = 9.97 × 10⁻⁶, P = 6.31 × 10−199, P = 1.16 × 10−263, P < 1 × 10−308, P < 1 × 10−308, P < 1 × 10−308. Results shown are from one biological replicate. g, Aggregate analysis of chromatin contact matrices (±250 kb window) aligned at the apex of Rep-Hi-C fountains (top) and differential contact maps (bottom). h, The signal distribution in the differential matrices from g. n = 2,600 bins analysed. Statistical analysis was performed using two-sided Mann–Whitney U-tests; from top to bottom, P = 1.81 × 10⁻²¹, P = 9.98 × 10−113, P = 1.48 × 10−228, P < 1 × 10−308, P < 1 × 10−308 and P < 1 × 10−308. Results shown are from one biological replicate. ***P < 0.001, **P < 0.01.Calder subcompartment analysis revealed substantial genome reorganization (around 40–45% bins), biased towards heterochromatinized (B-like) states reproducibly across DpnII and HindIII datasets (Extended Data Fig. 5d). Notably, only around 20% of bins shifted within 1 h of fork stalling, indicating that the global effect is relatively modest, but the rapid emergence of these changes suggests a regulated and locally pronounced architectural response at replicating regions. Consistent with that, G9a inhibition reduced B-like shifts and increased A-like transitions in Rep-Hi-C, whereas conventional Hi-C showed minimal change (Extended Data Fig. 5d). ‘A-like transitions’ refers to shifts towards genomic regions with A-compartment-like features, which are generally associated with open chromatin. Together, these data indicate that replication stress drives G9a-dependent strengthening of B–B interactions, associated with closed chromatin, and the emergence of transient subcompartment features that compartmentalize stalled newly replicated regions.High-resolution Rep-Hi-C analysis revealed prominent ‘fountain’ structures, vertical stripes orthogonal to the diagonal that are largely absent in standard Hi-C, corresponding to replication intermediates and overlapping with TrAEL-seq-defined replication fork directionality (RFD) shift site14,16 (Extended Data Fig. 6a).These features arise from transient interactions between sister forks at IZs and termination zones (TZ) and are diluted in conventional Hi-C data. We identified around 3,400 fountains across two biological replicates, with highly reproducible size distributions (mean of around 300 kb) (Extended Data Fig. 6b,c).Under replication stress (HU), the interaction frequency within fountains increased markedly in Rep-Hi-C and differential Rep-Hi-C (Rep-Hi-C minus Hi-C) data, revealing replication-specific contacts extending along bidirectional sister forks and appearing as thickened fountain stripes (Fig. 2b and Supplementary Fig. 2). The fountain edges showed enhanced contact intensity, forming blob-like structures consistent with stabilized loop formation. These loops, which enclose replication bubbles, were dynamic or undetectable in UT cells but became stabilized under stress in a G9a-dependent manner (Fig. 2c, Extended Data Fig. 6d and Supplementary Fig. 2). Consistent with that, H3K9me3 was enriched at IZ- and TZ-associated fountains under HU and was abolished after G9a inhibition (Fig. 2d, Extended Data Fig. 6e and Supplementary Fig. 3). Aggregate analyses of fountains from two biological replicates confirmed a global increase in chromatin interactions under HU (Fig. 2e and Extended Data Fig. 6f,g). Differential heat maps (HU versus UT, and HU versus HU + G9ai) showed stronger normalized gains under HU than the corresponding UT controls (UT versus UT + G9ai, and UT versus HU + G9ai) (Fig. 2e,f). Consistent with that, aggregate peak-corner analyses aligning all fountain edges revealed a clear HU-induced increase in loop strength that was abolished after G9a inhibition (Fig. 2g,h and Extended Data Fig. 6g).Together, these data support a model in which G9a-mediated heterochromatin stabilizes replication-associated chromatin loops, enhancing sister-fork interactions and establishing a replication-stress-specific genome architecture that may contribute to genome protection.Replication stress modulates loop densityIn HU-treated cells, Rep-Hi-C revealed blob-like structures at the fountain edges, consistent with stress-induced loop stabilization. Using this approach, we identified over 7,000 HU-specific loops with around 60% overlap between biological replicates (Extended Data Fig. 7a). Loop stabilization was further validated by chromosome conformation capture coupled with quantitative PCR (3C–qPCR) and anchor junction sequencing (Extended Data Fig. 7b,c and Supplementary Table 2).Similar interactions were observed under CPT and APH treatment, indicating that replication-stress-induced looping or stabilized loops are broadly conserved and may occur at common genomic anchor sites (Extended Data Fig. 7c).DNA fluorescence in situ hybridization (DNA-FISH) targeting HU-specific loop anchors (Supplementary Table 3) further confirmed loop stabilization, with reduced interprobe distances in S phase cells under the HU or APH conditions compared with the controls (Fig. 3a and Extended Data Fig. 7d). These sequencing-independent data support replication-stress-induced chromatin loop formation.Fig. 3: Replication stress induces HU-specific loops enclosing IZs, stabilized by G9a-dependent heterochromatin and CTCF anchoring.a, DNA FISH validation of a HU-specific loop in Hap1 cells. Left, representative images of left (green) and right (red) anchor probes (DAPI, blue). Right, the interprobe distance distribution. n = 108 (UT) and n = 119 (HU) S phase nuclei; n = 102 (UT), n = 81 (HU) non-S-phase nuclei. Statistical analysis was performed using two-sided Mann–Whitney U-tests; P = 0.0001 (S phase) and P = 0.4295 (non-S phase). Data were pooled from two independent experiments and normalized to their respective UT conditions (set to 1) to enable direct comparison across experiments. Scale bars, 5 μm. b, Representative HU-specific, G9a-dependent chromatin loops on chromosomes 9 (top) and 2 (bottom). The bottom tracks show H3K9me3 Rep-ChIC peaks, IZs and annotated genes. c, The fractions of IZs and TZs located within HU-unique loop bodies, anchors or neither. d, The aggregate average CTCF Rep-ChIC signal within HU-unique loops and ±10 kb around their anchors. Statistical analysis was performed using the two-sided Mann–Whitney U-test; P = 1.96 × 10⁻¹⁶. The results shown are from one biological replicate. e, The distribution of IZs and CTCF motifs within HU-specific loops and flanking regions. Consensus CTCF motifs at loop anchors enriched in the CTCF Rep-ChIC signal and their orientations (convergent versus tandem) are shown below. Heat maps of the CTCF Rep-ChIC signal around loop anchors (±1 kb) in UT and HU-treated MRC5 cells are also shown. f,g, APA of HU-specific loops in HCT116 CTCF-mAID2-mClover cells (f) and MRC5 cells (g). The enrichment relative to the background is indicated in the top-right corners. Results shown are from one biological replicate. h, Schematic of a loop with CTCF sites (top). Bottom, heat maps of IZs, H3K9me3, FANCD2 Rep-ChIC and the strand-specific fork pausing signal (TrAEL-seq) within HU-unique loops and flanking regions (±3.5 kb). C, Crick strand; W, Watson strand. i, Fork pausing signal within and flanking HU-unique loops with (+CTCF) or without (−CTCF) CBSs at the loop anchor, and UT-HU common loops. Results shown are a representative dataset out of two independent biological replicate. j, The average TrAEL-seq Watson (blue) and Crick (orange) strand profiles across HU-unique loops ±5 kb. All experiments used MRC5 cells unless otherwise stated.Loop and fountain size distributions were highly consistent between biological replicates (Extended Data Figs. 6c and 7e). HU-specific loops frequently enclosed IZs, including fountain-associated IZs, suggesting that stressed replicons are captured within chromatin loops (Figs. 2g,h and 3b and Extended Data Fig. 7f,g). Consistent with that, around 72% of IZs resided within loop bodies, whereas TZs localized near loop anchors (around 59%) (Fig. 3c). Loop coverage increased over late-replicating regions after HU treatment, indicating a stress-induced architectural response (Extended Data Fig. 7h).Replication domain boundaries correlate with topologically associating domains (TADs), which partition the genome into large-scale subnuclear compartments, and reflect transitions in replication timing18,19. Consistent with this, TAD distributions across early, late and transition regions were reproducible between biological replicates in MRC5 cells (this study)18,19. By contrast, replication stress had a minimal impact on TAD organization, with no major changes in TAD distribution or size, and apparent enrichment of loops in late TADs was lost after normalization (Extended Data Fig. 8a and Supplementary Fig. 4).Only a small fraction of HU-specific loops (569 loops, that is, <10%) overlapped canonical TAD boundaries. Insulation-score analysis indicated that boundary-overlapping loops demonstrated stronger insulation than loops located within TAD bodies (Extended Data Fig. 8b). Consistent with that, Rep-ChIC showed higher CTCF enrichment at loop anchors, with around 10× stronger signals at the small fraction (around 10%) of boundary loops (similar to UT), while the majority of intra-TAD loops exhibited modest but reproducible HU-induced CTCF enrichment relative to their UT counterparts (Fig. 3d, Extended Data Fig. 8c and Supplementary Figs. 5 and 6).Together, these data indicate that replication stress promotes CTCF-associated chromatin loop formation that organizes stressed replicons without globally altering TAD architecture.Stress induces G9a/CTCF-stabilized loopsCTCF motif analysis revealed strong enrichment at HU-specific loop anchors, whereas loop bodies were enriched for IZs (Fig. 3d,e). Most CTCF-positive loops (around 83%) contained convergent motifs, and Rep-ChIC data showed increased CTCF occupancy at these anchors after HU treatment (Fig. 3d,e).Using CTCF-AID2 HCT116 cells20, PLA revealed increased CTCF enrichment at stalled forks after 1 h HU treatment, which dissipated after release, that is, after fork restart (Extended Data Fig. 8d). Acute CTCF depletion abolished this signal (Extended Data Fig. 8d,e). These data suggest that loops remain dynamic under basal conditions, whereas replication stress promotes CTCF loading at convergent motifs, stabilizing loop anchors and restricting loop extrusion (Fig. 3d,e). This process is reversible, with CTCF dissociation restoring loop dynamics after stress release.To test whether loop stabilization depends on CTCF, we performed Rep-Hi-C analysis of CTCF–AID2 HCT116 cells after transient CTCF depletion for 4 h in the presence or absence (UT) of 4 mM HU, 1 h (ref. 20). Aggregate peak analysis (APA) showed increased loop-anchor interaction strength under HU, which was lost after CTCF depletion, indicating a functional requirement for CTCF (Fig. 3f).Given that loop stabilization at fountain edges depends on G9a-mediated H3K9me3 (Fig. 2b–h), we next assessed its broader role. Similar to the effects observed in CTCF-AID2 cells, G9a inhibition abolished HU-induced loop formation at regions enclosing IZs, and reduced the loop interaction strength to the baseline levels (Fig. 3b,g), demonstrating that both CTCF and G9a are required for stabilizing replication-stress-induced loops (Fig. 3f,g).After replication stress, loop anchors containing CTCF-binding sites (CBSs) were strongly enriched for both CTCF and FANCD2 compared with UT cells and random loci. Rep-ChIC analysis showed that stalled forks preferentially accumulate at HU-specific, CTCF-anchored loop anchors, while loop bodies are coated with G9a-dependent de novo H3K9me3 (Fig. 3h and Extended Data Fig. 8f–h). By contrast, HU-specific loops lacking CBSs did not show CTCF or FANCD2 enrichment, indicating specificity to CTCF-anchored structures in both MRC5 and HCT116 cells (Extended Data Fig. 8f–h). These data support a model in which forks emerging from IZs within loop bodies slow and stall at convergent CTCF motifs under stress.To test whether HU-specific loop anchors represent bona fide fork-pausing sites, we performed TrAEL-seq, an assay that detects fork pausing and reversal14, under acute (1 mM) and mild (0.5 mM) replication stress. Differential (HU–UT) signals revealed strong pausing and reversal specifically at CBS-enriched HU-loop anchors, with minimal enrichment at control regions lacking CBSs (Fig. 3i). Strand-resolved profiles showed symmetric Watson–Crick signals at these sites, most evident under mild stress, indicating preferential fork stalling at CBSs (Fig. 3j and Extended Data Fig. 8g–i).Analysis using single-cell EdU-seq (scEdU-seq)21 further confirmed selective fork slowing at loop anchors enriched for CTCF and FANCD2, despite minimal global effects on fork progression after treatment with 0.5 mM HU for 1 h (Extended Data Fig. 9a–e). Notably, these CBS sites also exhibited reduced fork speed under unperturbed conditions, consistent with approximately 59% overlapping endogenous TZs, suggesting that a subset of CTCF sites may act as intrinsic barriers to fork progression or mark termination-prone regions (Fig. 3c).Together, these data identify CTCF-enriched HU-specific loop anchors as bona fide hotspots of fork pausing and reversal that are accentuated under replication stress.Chromatin loops protect stalled forksWe next examined whether HU-specific chromatin loops functionally protect stalled forks. DNA fibre analysis in CTCF-AID2 cells revealed that acute CTCF depletion caused mild fork degradation, whereas G9a inhibition led to substantial degradation, with a further increase after combined loss (Fig. 4a and Extended Data Fig. 9f). Across time courses and three biological replicates, these data suggest that CTCF limits nuclease access at loop anchors, while G9a-dependent H3K9me3 protects broader regions within loop bodies. Inhibition of MRE11 or DNA2 alone only partially restored fork stability, whereas combined inhibition fully rescued protection, implicating both nucleases in degradation (Fig. 4a and Extended Data Fig. 9g).Fig. 4: Chromatin loop scaffold protects stalled forks and maintains genome stability.a, Schematic of the replication fork degradation DNA fibre assay in HCT116 CTCF-mAID2-mClover cells, involving CTCF depletion (dep; 5-Ph-IAA) and G9a inhibition (UNC0642) (top). Middle, representative fibres. Bottom, the IdU/EdU track length ratio. Data are mean ± s.d. From left to right, numbers of forks analysed per condition: n = 1,014, 1,015, 1,034, 1,039, 1,032, 1,053, 1,070 and 1,005, pooled from three independent replicates and overlaid in three different colours in the plot. Statistical analysis was performed using Kruskal–Wallis tests followed by Dunn’s test; from left to right, P < 0.0001, P < 0.0001, P < 0.0001, P < 0.0001, P < 0.0001, P > 0.9999, P > 0.9999, P > 0.9999. Scale bar, 5 μm. b, Representative locus (chromosome 16: 81.3–82.75 Mb). Top, Hi-C heat map (the red squares highlight the positions of the loop anchors). The Fork-deg-seq signal in HCT116-CTCF-mAID2-mClover cells UT or treated with G9ai (4 h), 5-Ph-IAA (4 h, CTCF-depleted) or both after 4 mM HU (5 h or 8 h). MRC5 CTCF and H3K9me3 Rep-ChIC signals are shown below, alongside IZs and fragile sites. The black arrowheads indicate high Fork-deg-seq signal. The shaded area shows a loop-dense region with reduced degradation; unshaded areas show enhanced Fork-deg-seq enrichment. c, BrdU-enriched 5-kb bins classified by HU-unique loop coverage: loop-poor (0–1 loop, left, n = 4,398 bins) and loop-dense (≥2 loops, right, n = 6,844 bins). The fold change in Fork-deg-seq signal relative to the WT is shown. Data are mean ± s.d. Statistical analysis was performed using two-sided Mann–Whitney U-tests; loop-free region, from top to bottom: P = 4.4 × 10⁻³³, P = 2.4 × 10−132, P = 2.4 × 10−132, P = 4.1 × 10⁻³³, P = 2.4 × 10−132, P = 2.7 × 10⁻³⁴; loop-dense region, from left to right: P = 1.4 × 10−130, P = 2.0 × 10−130, P = 1.8 × 10−130, P = 3.2 × 10⁻¹, P = 7.8 × 10⁻², P = 8.4 × 10⁻¹. Results shown are from one biological replicate. d, Aggregate analysis of the mean ± s.d. Fork-deg-seq signal within HU-unique loops and 5 kb flanking regions after 3 h of treatment with 4 mM HU alone (top row, left four plots) or with mirin and DNA2i followed by 4 mM HU (bottom row). Ionizing radiation (10 Gy) was included as a control without further treatment (top right plot). The results shown are from one biological replicate. All of the experiments described in this figure were performed in HCT116 CTCF-mAID2-mClover cells, unless otherwise stated.To map fork degradation at HU-induced loop regions, we developed fork degradation sequencing (Fork-deg-seq) (Extended Data Fig. 9h). Replication forks were labelled with BrdU before stress, followed by in situ gap filling with biotin–dATP to mark degraded nascent DNA. After enriching BrdU-labelled fragments, biotin-tagged regions were isolated for paired-end sequencing, enabling selective profiling of degraded forks. To validate Fork-deg-seq, we used transient BRCA2 depletion as a positive control for nascent DNA degradation. In wild-type (WT) cells, degradation signals were confined to discrete regions overlapping IZs (Extended Data Fig. 9i). Overlay with HU-specific loops showed that loop-enclosed replicating regions are protected from nucleolytic degradation, whereas regions outside loops exhibit increased degradation. After BRCA2 depletion, degradation increased globally but remained higher in loop-poor regions. Consistent with that, late-replicating regions, which contain more loops, were better protected than early domains (Extended Data Fig. 9i). Metaplot analysis across over 7,000 HU-specific loops showed that nascent DNA within loop bodies is better protected, whereas nascent DNA outside loops or at anchors is preferentially degraded, even after BRCA2 loss (Extended Data Fig. 9j and Supplementary Fig. 7b).To assess the impact of loop destabilization on fork stability, we used Fork-deg-seq after transient CTCF depletion, G9a inhibition or combined loss during replication stress. In WT cells, fork degradation was minimal and primarily localized outside loop-dense regions, particularly near fragile loci (Fig. 4b and Extended Data Fig. 10a,b). Under stress, loop-rich regions showed increased H3K9me3 and strong CTCF enrichment at anchors, consistent with genome-wide patterns (Figs. 1d,e, 3d,e and 4b). G9a inhibition led to a marked increase in fork degradation, predominantly at IZs lacking loop enrichment, whereas CTCF depletion had a moderate but significant effect. Combined loss (G9a inhibition + CTCF depletion) did not further show increased degradation, possibly reflecting saturation of nuclease access or a limitation of the assay in capturing extensive degradation. Overall, these results link fork protection directly to chromatin loop regions stabilized by G9a and CTCF.Fragile sites were particularly susceptible to nucleolytic attacks across both early- and late-replicating domains (Fig. 4b and Extended Data Fig. 10a). Stratification by replication timing showed that early-replicating fragile sites (ERFSs) are more sensitive to fork degradation than late-replicating ones, consistent with a protective effect of the higher density of HU-specific loops in the latter22 (Extended Data Fig. 10c–e and Supplementary Table 4). This vulnerability was further exacerbated by loss of G9a, CTCF or BRCA2, suggesting that intrinsic fragility reflects increased susceptibility to nucleolytic processing under replication stress.Consistent with that, genome-wide stratification showed that loop-poor regions (0–1 loop) were more prone to degradation than loop-rich regions (≥2 loops) across all perturbations (Fig. 4c), supporting a protective role for loop architecture. Combined inhibition of DNA2 and MRE11 suppressed fork degradation signals across all conditions (Fig. 4d), recapitulating DNA fibre results and confirming assay specificity. Notably, the lack of a strong additive effect in the combined CTCF and G9a loss condition may reflect saturation of nuclease access and/or reduced detection sensitivity under extensive degradation. Control experiments with irradiation-induced DSBs showed minimal signal, demonstrating that Fork-deg-seq specifically captures nascent-strand degradation rather than DSB processing intermediates (Fig. 4d).Together, these findings support a model in which replication-stress-induced chromatin loops, stabilized by G9a-mediated H3K9me3 and CTCF, form protective scaffold that shield stalled forks, whereas loop-poor regions remain intrinsically vulnerable to nucleolytic attack.Loops shield forks from nuclease attackA limitation of Fork-deg-seq is its reliance on free BrdU-labelled 3′ ends and gap filling, which may underestimate extensive degradation by reducing detectable ends. To address whether the lack of additive degradation in the combined CTCF and G9a loss reflects biology or technical constraints, we used electron microscopy (EM), a label-free approach that directly visualizes replication intermediates.EM revealed comparable frequencies of fork reversal across conditions under HU (around 20%) across CTCF depletion, G9a inhibition and combined perturbation, indicating that fork reversal is largely unaffected23,24 (Fig. 5a, Extended Data Fig. 10f and Supplementary Fig. 7a). However, reversed fork structures differed markedly: whereas WT forks showed intact double-stranded DNA (dsDNA) reversed forks, CTCF loss caused modest single-stranded DNA (ssDNA) gap accumulation limited to reversed forks, whereas G9a inhibition and, more prominently, combined loss resulted in extensive degradation of both reversed and non-reversed forks (Fig. 5b,c and Extended Data Fig. 10g). Quantification showed progressive increases in ssDNA tracts at and behind forks, with the combined perturbation displaying extensive degradation, including long ssDNA regions spanning tens of kilobases and multiple gaps per fork (Fig. 5c–e). These data reveal a severe, synergistic degradation phenotype after combined loss of CTCF and G9a, supporting a cooperative role for chromatin architecture and heterochromatin in protecting stalled forks.Fig. 5: The chromatin loop scaffold loss creates multiple vulnerable sites for nuclease-mediated fork degradation.a, Representative electron micrographs of replication intermediates. Top left, reversed fork. Top right, reversed fork with ssDNA gaps (blue arrowheads) on both daughter strands. Bottom left, replication bubble with two reversed forks and ssDNA gaps. Bottom right, reversed fork with ssDNA accumulation on both reversed arms and daughter strands. P, parental; D, daughter; R, reversed arms. Scale bars, 250 nm (around 1,183 bp; main images) and 50 nm (around 473 bp; insets). b, The mean ± s.d. percentage of fork reversal across three independent experiments. Reversed forks are categorized into double-stranded forks (dsDNA), forks with ssDNA gaps (ss-dsDNA) and forks with extensive ssDNA accumulation (ssDNA). The total numbers of analysed forks are shown in parentheses. c, The mean ± s.d. distribution of ssDNA gaps behind the fork. The total forks analysed across three independent experiments is shown in parentheses. Statistical analysis was performed using two-way analysis of variance (ANOVA) followed by Šidák’s multiple-comparison test; P = 0.0005. d, The ssDNA gap length distribution behind the fork. The total numbers of forks analysed across three independent experiments are shown in parentheses. Statistical analysis was performed using two-sided Mann–Whitney U-tests; from bottom to top, P values: P = 0.0481, P < 0.0001 and P < 0.0001. e, The distribution of ssDNA length accumulating at the fork junction. The total numbers of forks analysed across three independent experiments are shown in parentheses. Statistical analysis was performed using two-sided Mann–Whitney U-tests. f,g, Replication stress (RS)-induced chromatin loop scaffold formed by G9a-mediated H3K9me3 and CTCF anchoring protects stalled forks from degradation. f, DNA replication initiates with DNA unwinding by the CMG helicase, while cohesin rings (brown circles) drive chromatin loop extrusion. Under unchallenged conditions, cohesin-driven loops remain dynamic. During replication stress, forks stall/reverse and CTCF enrichment at convergent CTCF motifs stabilizes loops, halting extrusion. G9a-induced heterochromatin at nascent DNA coordinates with CTCF to form replication-stress-specific loops, protecting stalled forks from nucleolytic degradation. g, Model of scaffold loss. Left, CTCF loss destabilizes loop anchors, exposing reversed forks to nucleases. Right, G9a loss prevents H3K9me3 loop body formation, creating nuclease entry points on daughter strands. Bottom, combined loss severely destabilizes the scaffold, causing extensive nascent DNA degradation. The diagrams in f and g were created using BioRender; Taneja, N. https://BioRender.com/q7i0yb5 (2026).Collectively, EM data support a model in which CTCF protects reversed fork structures at convergent motifs, while G9a-mediated heterochromatin coats loop bodies to restrict nuclease entry, thereby limiting access of MRE11 and DNA2 (Fig. 5f). Combined loss exposes both loop bodies and reversed arms, creating multiple entry points for degradation (Fig. 5g), a phenotype distinct from BRCA1/2- or RIF1/BOD1L-dependent pathways that primarily protect reversed forks25,26,27,28,29,30,31.Reversed forks formed at similar frequencies across all mutant conditions, indicating that fork reversal is independent of HU-induced loop formation; consistent with this, de novo H3K9me3 deposition is also independent of fork reversal3. Consistent with these observations, 3C–qPCR analysis showed that HU-induced loops form robustly in fork-reversal-deficient SMARCAL1/ZRANB3/HLTF triple-knockout (TKO) cells32, demonstrating that loop formation does not require fork reversal (Extended Data Fig. 10h and Supplementary Table 2).As shown previously3, HU induces robust, ATR-dependent de novo H3K9me3 at EdU-labelled nascent DNA, shown by chromatin fibres (Extended Data Fig. 10i and Supplementary Fig. 7c). However, CTCF loss, with or without nuclease inhibition, did not impair H3K9me3 deposition at EdU-labelled regions (Extended Data Fig. 10i and Supplementary Fig. 7c). Instead, CTCF loss led to notable expansion of H3K9me3 beyond replication domains, particularly when chromatin integrity was preserved, that is, after nuclease inhibition (Extended Data Fig. 10j and Supplementary Fig. 7c), indicating that CTCF acts as a boundary element restricting heterochromatin spreading beyond the loop body during replication stress.We next tested whether H3K9me3 influences CTCF recruitment at stalled forks corresponding to HU-specific loop anchors, and whether this process is ATR dependent. PLA between CTCF and EdU-labelled nascent DNA showed that G9a inhibition had only a modest effect on HU-induced CTCF enrichment, whereas ATR inhibition abolished it, reducing CTCF levels to the baseline (Extended Data Fig. 10k). These data indicate that ATR-dependent chromatin changes promote both G9a-mediated heterochromatin formation3 and CTCF loading at convergent motifs. Together, these findings define dual roles for CTCF during replication stress: stabilizing HU-induced chromatin loops and constraining H3K9me3 within loop bodies, both dependent on ATR-driven recruitment.Failure to protect nascent DNA during replication stress drives genomic instability—a hallmark of cancer33. We found that HU-specific loop anchors containing CBSs are hotspots of fork stalling and accumulate replication stress markers (FANCD2, γH2AX) and mutations observed in BRCA2-deficient tumours (Fig. 3h–j and Extended Data Figs. 8f–i and 9a–e). Aggregate analyses showed that mutations preferentially accumulate outside chromatin loop body, regions more prone to fork degradation. Consistent with that, CBS-containing loop anchors exhibited higher mutation frequencies in BRCA1/2-deficient tumours than in BRCA1/2-proficient tumours (Supplementary Fig. 7d), suggesting conserved vulnerability in HR-deficient contexts.To assess the physiological relevance, we compared the loop distribution with intrinsic replication fragility. Late-replicating IZs, which are enriched for loops, showed reduced fork degradation compared with early IZs, whereas ERFSs exhibited increased instability under replication stress34. This indicates that differential loop density provides a structural basis for the heightened vulnerability of early-replicating fragile regions (Extended Data Fig. 10d). Consistent with that, ERFSs significantly overlapped HU-specific loops (Supplementary Fig. 8a,b), suggesting that stress-induced loops preferentially form at vulnerable replication domains.To explore conservation, we intersected HU-specific loop anchors with replication origins mapped in regenerating mouse liver35. Cross-species integration revealed conserved regions enriched for hallmarks of stressed-fork biology, including FANCD2 binding, convergent CTCF sites, copy-number variant hotspots36, and high-σ (highly efficient) stress-associated origins (Supplementary Fig. 8a,c–e).Together, these findings support a model in which G9a-dependent heterochromatin and CTCF repositioning cooperatively stabilize replication-stress-induced chromatin loops that shield nascent DNA from degradation (Fig. 5f,g). This work identifies a chromatin-architectural mechanism of fork protection that is distinct from canonical pathways and provides a framework for understanding genome instability in cancer and ageing.DiscussionHere we identify a chromatin-based mechanism that stabilizes replication forks under stress. Replication stress induces de novo H3K9me3 on nascent DNA, coinciding with stabilization of chromatin loops that enclose stressed IZs. These loops are reinforced by CTCF at convergent motifs and coated by G9a-mediated heterochromatin, forming a protective scaffold that enhances fork stability. Together, these findings support a model in which CTCF and stalled forks act as barriers to loop-extruding cohesin37,38,39, stabilizing chromatin architecture under stress.Although our study uses HU-induced nucleotide depletion, we propose that loop extrusion persists during early stress, potentially facilitating fork slowing and stalling at convergent CBSs. Consistent with that, forks traverse several kilobases under both low HU and high HU before arrest, indicating progressive slowing. These CBSs may promote fork reversal through local DNA features and recruitment of translocases. After stalling, CTCF becomes enriched at these sites, halting loop extrusion and stabilizing reversed forks at loop anchors, while G9a-mediated H3K9me3 coats the loop body to restrict nuclease access to nascent DNA.This mechanism is distinct from previously described fork protection pathways, including BRCA1/2-dependent and independent pathways that primarily act on reversed forks25,26,27,28,29,30,31. Instead, our data support a model in which chromatin loop architecture provides a broader protective scaffold, shielding nascent DNA within the loop domain irrespective of fork reversal status.Furthermore, the identity of loop-extruding motors operating during replication stress remains incompletely defined. Cohesin is a likely candidate, but other SMC complexes, including SMC5/6 and condensins, may also contribute, as all three can mediate DNA loop extrusion in appropriate contexts40,41. Although condensins are classically associated with mitosis, they may engage topologically stressed or under-replicated chromatin and contribute to higher-order loop organization under replication stress. It is also plausible that local interactions within replication bubbles and longer-range contacts between replication domains are mediated by distinct extrusion machineries, although this remains to be directly demonstrated.The increased contact frequency within fountains under HU probably reflects G9a-dependent chromatin compaction, as this effect is lost after G9a inhibition. Although fork stalling frequently occurs at hotspots enriched for CTCF motifs, not all such sites form stabilized loops. This suggests that while certain CTCF sites predispose forks to slow or stall, loop formation requires additional context-dependent recruitment of CTCF. Such recruitment may be modulated by stress-induced epigenetic changes, including alterations in 5-hydroxymethylcytosine that influence CTCF binding42. In the absence of loop stabilization, these regions remain loop poor and may be more susceptible to aberrant processing43,44,45.Chromatin structural responses are well defined in DSB repair, in which ATM-dependent clustering of damaged TADs forms A-compartment-like domains that coordinate repair46. Cohesin-driven loop extrusion isolates damaged regions, constrains γH2AX spreading, and enhances repair efficiency, but can also increase translocation risk46,47. Cohesin further organizes extrusion domains that confine RAD51 loading and restrict homology search to TAD-scale regions48,49.By contrast, our study shows a distinct architectural response after replication stress. Stalled forks promote formation of G9a-dependent, CTCF-anchored chromatin loops within a transient heterochromatinized (B-like) state. CTCF halts loop extrusion at anchors, while H3K9me3 coats loop bodies to restrict the access of MRE11 and DNA2 to nascent DNA. These loops rarely align with TAD borders, instead forming dynamic substructures that rapidly dissolve after stress release, restoring loop extrusion. CTCF also confines H3K9me3 to loop bodies, preventing its spread into anchors or unreplicated regions. Thus, in contrast to DSB repair, which relies on chromatin opening and extrusion-driven homology search, replication stress engages heterochromatinized, CTCF-anchored loops to stabilize stalled forks.Our study identified CBSs, particularly those with convergent motifs, as frequent sites for replication fork stalling under stress conditions. This observation aligns with recent findings highlighting that CBSs act as replication fork barriers, potentially mediating recruitment of DDR factors and contributing to genome stability50.CTCF becomes enriched at stalled forks and co-localizes with FANCD2 at loop anchors, consistent with TrAEL-seq and scEdU-seq data identifying these regions as major fork-pausing sites. EM analysis showed that fork reversal occurs at comparable levels across CTCF depletion, G9a inhibition and combined perturbation, indicating that this process is largely independent of loop integrity. By contrast, loss of CTCF led to modest ssDNA gap formation and fork degradation, whereas G9a inhibition and, more prominently, combined loss resulted in extensive degradation of both reversed and non-reversed forks. These observations suggest that G9a-mediated H3K9me3 provides broader protection by limiting nuclease access within loop bodies, extending beyond the reversed fork arms. Thus, this mechanism differs from canonical BRCA1/2-dependent pathways, which primarily safeguard reversed forks.Consistent with that, both MRE11 and DNA2 gained access when loop integrity was compromised, at anchors after CTCF loss and within loop bodies after G9a inhibition, supporting a division of labour in which CTCF protects free DNA ends of reversed fork structure at loop anchors while G9a-mediated heterochromatin shields nascent DNA within loop domains.We further link this architecture to genome instability. Loop anchors coincide with mutational hotspots in BRCA2-deficient tumours, showing increased fork degradation and SNV accumulation51,52 and CBSs at these anchors are frequently mutated across cancers53,54, consistent with error-prone repair mechanisms such as PRIMPOL-mediated repriming or translesion synthesis. By contrast, loop-enclosed IZs are relatively protected. Consistent with that, ERFSs map to loop-poor regions and exhibit elevated instability55,56, whereas loop-dense late-replicating regions (such as common fragile sites) seem to be relatively protected.These findings indicate that loop-based protection is genome-wide but context-dependent: early, loop-poor regions are more exposed and reliant on CTCF- and G9a-mediated stabilization, whereas late, heterochromatin-rich regions benefit from additional structural buffering, potentially through cohesin, condensins and topological regulators.In conclusion, we define a chromatin-architectural mechanism in which replication stress induces transient, heterochromatinized, CTCF-anchored loops that stabilize stalled forks. Loss of this scaffold exposes nascent DNA to widespread nuclease attack beyond reversed fork arms, revealing a layer of fork protection. This dynamic reorganization minimizes mutagenesis, preserves genome integrity, and has direct implications for cancer and ageing.MethodsCell culture, treatments and thymidine analogue incorporationCell lines and cultureMRC5 SV40-immortalized human fibroblasts and HCT116 human colorectal cancer cells were cultured in a 1:1 mixture of Dulbecco’s modified Eagle’s medium (DMEM) and Ham’s F10 (Invitrogen), supplemented with 10% FCS (Biowest) and 1% penicillin–streptomycin (Sigma-Aldrich) (Supplementary Table 6). Cells were maintained at 37 °C in a humidified incubator with 5% CO2.Human RPE1-hTERT TP53−/−shBRCA2 cells were cultured in DMEM/Nutrient Mixture F-12 (Invitrogen) supplemented with 10% FCS and 1% penicillin–streptomycin at 37 °C and 5% CO2.U2OS (WT and TKO) cells were cultured in DMEM supplemented with 10% FCS and 1% penicillin–streptomycin under the same incubation conditions.HAP1 cells25 were cultured in Iscove’s modified Dulbecco’s medium (IMDM) supplemented with 10% FCS and 1% penicillin–streptomycin. All cell lines used in this study were routinely tested for mycoplasma contamination and tested negative.Thymidine analogue incorporationFor BrdU incorporation, asynchronously growing cells were incubated in their respective culture medium containing 100 µM BrdU for 20 or 40 min (Supplementary Table 7). Immediately after the BrdU pulse, cells were either fixed or subjected to replication stress by replacing the medium with fresh medium containing 1 mM or 4 mM HU.For EdU incorporation, asynchronously growing cells were incubated in in their respective culture medium containing 10 µM EdU for 20 min. Immediately after the EdU pulse, cells were either fixed or subjected to replication stress by replacing the medium with medium containing appropriate drugs.In experiments using HCT116 cells expressing CTCF-mAID2-mClover, the culture medium was replaced with medium containing 1 µM 5-Ph-IAA (HY-134653, MedChemExpress) for at least 2 h before the experiment to induce transient depletion of CTCF.The G9a inhibitor UNC0642 (MedChemExpress) was added at a final concentration of 1 µM for 2 to 4 h before experiments.Mirin (Sigma-Aldrich, M9948) was added at 100 µM for at least 2 h before any treatment. Analogously, the DNA2 inhibitor (DNA2i; Sigma-Aldrich, SML4192) was added at 5 µM for at least 2 h before treatment.In experiments using RPE1 cells with a doxycycline-inducible shRNA against BRCA2, knockdown was induced by replacing the culture medium with medium containing 2 µg ml−1 doxycycline for 48 h before the experiment.Flow cytometryCell cycle analysis was performed on MRC5 cells. After the indicated treatments, cells were collected by trypsinization, washed in PBS and fixed in 70% ethanol at −20 °C. Fixed cells were permeabilized in 0.2% Triton X-100 (Sigma-Aldrich). To detect incorporated BrdU, permeabilized cells were incubated in 2.5 M HCl for 1 h at room temperature to denature the DNA, followed by neutralization and washing in PBS.Cells were then incubated with a primary anti-BrdU antibody (anti-BrdU, 44, BD, 347580) for 1 h, followed by a 30 min incubation with an Alexa-Fluor-488-conjugated secondary antibody (goat anti-mouse). DNA was counterstained with DAPI. Single nuclei were selected by sequential gating using SSC-A versus FSC-A, followed by FSC-H versus FSC-W and SSC-H versus SSC-W on the BD Aria flow cytometer (BD Biosciences) to exclude doublets and debris. Quantification and analysis of cell cycle profiles were performed using FlowJo software (BD, FlowJo).Western blotProtein samples were separated on 4–12% NuPAGE Bis-Tris Gels (Novex, Life Technologies) and transferred onto polyvinylidene difluoride membranes (0.45 µm; Immobilon, Millipore). The membranes were blocked with 5% BSA in PBS for 1 h at room temperature and incubated overnight at 4 °C with primary antibodies diluted in blocking buffer.The following primary antibodies were used: anti-CTCF57 (rabbit, 1:500), anti-GFP (mouse, 1:1,000, Roche, 11814460001) and anti-α-tubulin (mouse, 1:1,000, Sigma-Aldrich, T6074). The next day, the membranes were washed in PBS containing 0.1% Tween-20, then incubated with secondary antibodies coupled to near-infrared dyes CF 680 or CF 770 (1:10,000; Sigma-Aldrich) for 1 h at room temperature (Supplementary Table 8).Signals were detected using the Odyssey CLx infrared scanner (LI-COR Biosciences), and the band intensities were quantified using ImageJ (NIH).DNA fibre analysisDNA fibre analysis was performed essentially as described previously. In brief, cells were sequentially pulse-labelled with 10 µM EdU (Invitrogen) or 30 μM CldU (MP Biomedicals) followed by 250 µM IdU (Sigma-Aldrich). After labelling and treatments, as indicated in the figure panels, cells were collected and DNA fibres were prepared by spreading lysed nuclei on glass slides, as previously described3.EdU was detected by a Click-iT reaction to conjugate Azide-PEG3-Biotin (Jena Bioscience, CLK-1167-25) to EdU-labelled DNA, followed by incubation with anti-biotin antibody (A150-109A, Bethyl Laboratories) diluted 1:100 in blocking buffer (PBS, 2% BSA, 0.1% Tween-20). CldU was detected using Anti-BrdU (Abcam, ab6326), IdU was detected using an anti-BrdU antibody (B44; 347580, BD Biosciences) diluted 1:100 in the same blocking buffer. Primary antibodies were then labelled with anti-mouse antibody conjugated with Alexa Fluor 488 (diluted 1:100 in blocking buffer) and anti-rat or anti-rabbit secondary antibody conjugated to Alexa Fluor 594 (diluted 1:100 in blocking buffer) for 1 h at room temperature (Supplementary Table 8). Fibres were visualized and imaged using the Metafer slide scanner (MetaSystems) equipped with a ×40 Plan-Neofluar 0.75 NA air objective. Replication tracks were quantified using ImageJ.Chromatin fibre analysis (ChromStretch)Chromatin fibre analysis (ChromStretch) was performed largely as described previously3. After the indicated treatments, a minimum of 3 × 10⁵ cells was collected and washed twice in cold 1× PBS. To facilitate chromatin isolation and spreading, cells were resuspended in hypotonic buffer (3 mM EDTA, 0.1 mM EGTA, 1 mM DTT and protease inhibitor cocktail). Nuclei were collected by centrifugation (1,800g for 4 min at 4 °C).The nuclear pellet was spotted onto Superfrost microscope slides and allowed to settle for 10 min in a humid chamber. Excess buffer was removed by gently tilting the slides, which were then allowed to air-dry for a maximum of 5 min. The slides were transferred into a lysis chamber containing lysis buffer (25 mM Tris base, 0.1 mM EDTA, 0.1 mM EGTA, 1 mM DTT and 2% Triton X-100) and incubated for 20 min. Chromatin stretching was achieved by flowing the lysis buffer out of the chamber at a constant flow using a custom-designed and custom-built device. Stretched chromatin fibres were fixed in 2% formaldehyde for 15 min, then washed three times in PBS. EdU was labelled with Alexa Fluor 594-azide according to the manufacturer’s instructions for 30 min, followed by a PBS wash and blocking in 1× PBS with 5% BSA for 1 h. The slides were then incubated with primary antibodies overnight at 4 °C. Primary antibodies were mouse anti-H3K9me3 (EPR26601; Abcam, ab317790, 1:500 in 5%BSA/PBS) and rabbit anti-H3 (Abcam, ab1791; 1:500 in 5% BSA/PBS). Primary antibodies were then labelled with anti-mouse antibody conjugated with Alexa Fluor 488 (diluted 1:1,000 in blocking buffer) and anti-rabbit secondary antibody conjugated with Alexa Fluor 647 (diluted 1:1,000 in blocking buffer) for 1 h at room temperature (Supplementary Table 8). Chromatin fibres were imaged using the Leica ST5 confocal microscope equipped with an oil-immersion ×63 HC PL APO CS2 objective (NA 1.4). Quantification of the H3K9me3 signal overlapping with the EdU signal was performed using ImageJ.High-content PLAHigh-content PLA were performed as previously described3 using the Duolink In Situ reagents (Sigma-Aldrich) according to the manufacturer’s instructions. In brief, cells were seeded on coverslips 1 day before treatments. After pulse labelling with 10 µM EdU for 20 min and the indicated treatments (as described in the figure legends), cells were fixed.Fixed cells were permeabilized with 0.1% Triton X-100 in PBS for 15 min at room temperature and blocked with 5% BSA for 1 h at room temperature. After blocking, EdU was biotinylated using copper-catalysed click chemistry by incubating the mix (25 µM picolyl-azide-PEG4-biotin (Jena Bioscience), 10 mM sodium l-ascorbate and 2 mM CuSO4 in PBS) for 30 min at room temperature to allow antibody labelling of newly replicated DNA. Cells were washed once with PBS and incubated with the indicated primary (mouse anti-biotin and rabbit anti-H3K9me3, 1:1,000 (Extended Data Fig. 4); or rabbit anti-biotin and mouse anti-GFP, 1:1,000 (Extended Data Figs. 8d and 10i)) antibodies in 5% FBS overnight at 4 °C.Proximity ligation was performed using the Duolink Proximity Ligation Assay kit according to the manufacturer’s instruction (Sigma-Aldrich). In brief, cells were washed three times with buffer A (0.01 M Tris-HCl pH 7.4, 0.15 M NaCl and 0.05% Tween-20) and incubated with Duolink In Situ PLA Probe Anti-Rabbit PLUS and Anti-Mouse MINUS for 1 h at 37 °C. Cells were washed three times with buffer A and incubated with the Duolink In Situ PLA Ligation Mix for 30 min at 37 °C. After three more washed with buffer A, cells were incubated with Duolink In Situ PLA Amplification mix (Red), and washed three times with buffer B (0.01 M Tris-HCl pH 7.4, 0.15 M NaCl) for 10 min at room temperature, followed by one wash with 0.01× buffer B. For the EdU-CTCF PLA (Extended Data Figs. 8d and 10i) cells were incubated with an anti-rabbit Alexa Fluor 488-conjugated secondary antibody for 15 min at room temperature for staining EdU-positive cells, and nuclei were stained with DAPI (0.1 μg ml−1) for 15 min at room temperature. Cells were washed three times with PBS and mounted onto SuperFrost microscope slides using MOWIOL 4-88 mounting medium (Sigma-Aldrich).Images were acquired using the Zeiss Axio Imager Z2 microscope coupled to MetaSystems Metafer5. Image analysis and quantification was carried out using Metafer MetaCyte. The number of PLA foci was quantified and the PLA spot intensity was calculated as the product of the mean intensity of each spot per nucleus. To analyse clustered PLA spots (Extended Data Fig. 4), the cell image analysis software CellProfiler was used to quantify the number of clustered spots per nucleus.Hi-C/Rep-Hi-CHi-C and Rep-Hi-C were performed on 60–70 million cells. Cells were grown in 15-cm dishes to approximately 70% confluence and pulse-labelled with 100 µM BrdU for 20 min. Subsequently, cells were incubated or not with 4 mM HU for 1 h to induce replication stress. Cells were then cross-linked in 1% formaldehyde for 10 min at room temperature, quenched with 300 mM glycine for 5 min at room temperature, and further incubated for 15 min at 4 °C. Fixed cells were collected by scraping, snap-frozen in liquid nitrogen, and stored at −80 °C until use.Cross-linked pellets were dounced and incubated in pre-cooled permeabilization buffer (10 mM Tris-HCl pH 8.0, 10 mM NaCl, 0.4% Igepal CA-630, and protease inhibitor cocktail) for 1 h. Cells were washed with 1× NEBuffer 2.1 and treated with 0.1% SDS for 10 min at 65 °C, followed by quenching with 1% Triton X-100 to permeabilize nuclei.Open chromatin was digested overnight at 37 °C with 400 U DpnII/HindIII restriction enzyme in 1× NEBuffer 2.1 (NEBuffer 3.1 for HindIII). Overhangs from the restriction digest were biotinylated (using biotin-14-dATP for DpnII Hi-C/Rep-Hi-C or biotin-14-dUTP for HindIII Hi-C/Rep-Hi-C; Jena Bioscience) by a gap-filling reaction at 23 °C for 4 h, followed by blunt-end ligation at 16 °C for 4 h. Ligated DNA was de-cross-linked using a standard proteinase K protocol overnight. Protein-free DNA was purified using phenol–chloroform extraction, ethanol precipitation and concentration on Amicon columns to remove excess salts and concentrate DNA (adapted from a previous study15). The purified DNA was treated with RNase A (10 µg ml−1) to avoid RNA contamination.After DNA purification, unligated or dangling fragments bearing undesired biotinylated nucleotides were removed before sonication using a Covaris sonicator. DNA fragments were then size-selected to 200–300 bp using solid-phase reversible immobilization (SPRI) bead-based size selection (Ampure XP, Beckman Coulter). Before pull-down, size-selected DNA was end-repaired using T4 DNA polymerase, T4 PNK, Klenow DNA polymerase and dNTPs, followed by SPRI bead purification. The repaired DNA was A-tailed and ligated to Illumina adapters.Adapter-ligated DNA was split into two fractions. The first fraction was used to generate conventional Hi-C libraries and was directly subjected to capture of biotinylated fragments using streptavidin-coated magnetic beads (MyOne Streptavidin beads, Invitrogen). DNA bound to the beads served as PCR template to generate indexed Hi-C libraries for Illumina sequencing.The second fraction was processed for Rep-Hi-C. Adapter-ligated DNA was denatured at 95 °C for 5 min and immediately chilled on ice for 2 min to obtain single-stranded DNA. The single-stranded DNA was incubated with 0.5 mg anti-BrdU antibody (BD Pharmingen, 555627; 0.5 mg ml−1 stock) per µg of DNA for 45 min at room temperature. Newly replicated DNA bound to BrdU antibodies was pulled-down using Protein G Dynabeads. DNA was eluted using proteinase K treatment and purified using SPRI beads. The resulting adapter-containing ssDNA was incubated with streptavidin-coated beads (Dynabeads MyOne Streptavidin C1 beads, Invitrogen) to capture biotin-labelled ligation junctions. Bead-bound DNA was used as PCR template to generate indexed Rep-Hi-C libraries, which were sequenced on the Illumina NovaSeq 6000 platform.ChIC/Rep-ChICCells were incubated in the presence of 100 µM BrdU for 20 min before being subjected or not to replication stress with 1 mM HU for 1 h. After treatment, 500,000 or 1,000,000 cells were collected for ChIC or Rep-ChIC, respectively.ChIC was performed using the ChIC/CUT&RUN assay kit (Active Motif, 53180) according to the manufacturer’s instructions. In brief, nuclei were isolated, permeabilized and incubated with the appropriate antibodies: rabbit anti-H3K9me3 (EPR16601, Abcam, ab176916, 1 µg per 500,000 cells), rabbit anti-CTCF (Active Motif, 61311, 1 µg per 500,000 cells) or rabbit anti-FANCD2 (Abcam, ab108928, 1 µg per 500,000 cells) (Supplementary Table 8). After antibody binding, nuclei were incubated with pAG-MNase, and nuclease activity was activated to cleave chromatin near antibody-bound sites. Cut DNA fragments were released, collected and purified according to the manufacturer’s protocol. Purified DNA fragments were used to prepare sequencing libraries with the NEBNext Multiplex Oligos for Illumina (New England Biolabs).Rep-ChIC was performed as for ChIC with an additional BrdU-pull down as follows. After end-repair, A-tailing and adapter ligation, DNA was denatured at 95 °C for 5 min and immediately cooled on ice for 2 min. The resulting single-stranded DNA was incubated with 0.5 µg anti-BrdU antibody (BD Pharmingen, 555627; 0.5 mg ml−1) for 45 min at room temperature. Newly replicated DNA bound to BrdU antibodies was pulled-down using Protein G Dynabeads. DNA was eluted using proteinase K, purified using SPRI beads and the adapter-containing ssDNA was used as template to generate indexed Illumina sequencing libraries by PCR.Fork-deg-seqFor Fork-deg-seq, a minimum of 10–15 million cells, after all treatments, were incubated with 100 µM BrdU for 40 min and then subjected to replication stress with 4 mM HU for 3, 5 or 8 h. For the ionizing radiation control (Fig. 4d), cells were incubated with 100 µM BrdU for 40 min before irradiation with 10 Gy of X-ray followed by a 15 min recovery. Cells were then cross-linked with 1% formaldehyde for 10 min at room temperature, quenched with 300 mM glycine for 5 min at room temperature and further incubated for 15 min at 4 °C. Fixed cells were collected by scraping, snap-frozen in liquid nitrogen and stored at −80 °C.Cross-linked pellets were homogenized by douncing and incubated in pre-cooled permeabilization buffer (10 mM Tris-HCl pH 8.0, 10 mM NaCl, 0.4% Igepal CA-630, protease inhibitor cocktail) for 1 h. Cells were then treated with 0.1% SDS for 10 min at 65 °C and quenched with 1% Triton X-100. Biotinylated nucleotides were incorporated at DNA degradation sites by a gap-filling reaction, followed by ligation, de-cross-linking and DNA purification as described above for the Rep-Hi-C procedure.Purified DNA was sonicated using a Covaris sonicator, and fragments were size-selected to 200–300 bp using SPRI beads. Before pull-downs, size-selected DNA was end-repaired, A-tailed and ligated to paired-end Illumina adapters as in Rep-Hi-C. Adapter-ligated DNA was first used to enrich replicating regions by capturing BrdU-labelled fragments, as in Rep-Hi-C. The resulting single-stranded DNA after BrdU capture was then used to capture degradation sites by pull-down with streptavidin beads, which bind to biotin incorporated at ligation/degradation sites. Bead-bound DNA was PCR-amplified to the desired number of cycles and sequenced on the Illumina NovaSeq 6000 platform.3C–qPCRFor 3C–qPCR, a minimum of 5–10 million cells was treated and cross-linked as mentioned in the Rep-Hi-C protocol, but without the BrdU pulse. Samples were collected and cross-linked pellets were processed similarly to Rep-Hi-C until the restriction-digestion step, at which point chromatin was digested overnight at 37 °C with 400 U HindIII. Sticky-end ligation was performed at 16 °C for 4 h. Ligated DNA was de-cross-linked and purified as described previously for the Rep-Hi-C procedure.After 3C DNA purification, specific chromatin interactions were quantified using qPCR using 16 sets of primer pairs designed across putative loop anchors distant to each other (in the range of few kilobases) for six loops across different chromosomes (schematics are provided in Extended Data Fig. 7b) (Supplementary Table 2). PCR products for the interactions ranged between 200 and 350 bp and, using 3C DNA as template, Cq values (representing interaction among two distant loop anchors) were calculated. Cq values were normalized to an internal interaction control, and the fold changes were calculated relative to the UT conditions (Extended Data Figs. 7c and 10h). Sanger sequencing of PCR products was used to confirm interactions (HindIII junction site) between primer pairs from two distinct loop anchors for HU-specific loops and induced by other replication-stress-inducing drugs. (schematics and representative junction sites are shown in Extended Data Fig. 7c (right)).EM analysisReplication fork architecture was analysed according to the standard protocol described previously25. In brief, asynchronous cultures were treated with 1 mM HU for 3 h. Fork architecture was cross-linked in vivo by treatment with 10 µg ml−1 4,5′,8-trimethylpsoralen (Thermo Fisher Scientific, J63226-03) and pulse irradiation with 365 nm monochromatic ultraviolet light using a BLX312 ultraviolet crosslinker (Vilber Lourmat).DNA was extracted with lysis buffer (1.28 M sucrose, 40 mM Tris–HCl pH 7.5, 20 mM MgCl2, 4% Triton X-100) and further digested in digestion buffer (800 mM guanidine-HCl, 30 mM Tris–HCl pH 8.0, 30 mM EDTA pH 8.0, 5% Tween-20, 0.5% Triton X-100) in the presence of 1 mg ml−1 proteinase K at 50 °C for 2 h. DNA was purified by phase separation using chloroform:isoamyl alcohol (24:1) and precipitated with 0.7 vol isopropanol, then washed with 70% ethanol, dried and resuspended in TE buffer.Next, 12 μg of genomic DNA were digested with PvuII-HF (NEB, R3151) and concentrated using Microcon centrifugal filters (Merck) according to the manufacturer’s instructions. The benzyldimethylalkylammonium chloride (Sigma-Aldrich, 8219440100) method was used to spread DNA at the water–air interface, which was then collected on carbon-coated nickel grids. DNA was coated with an 8 nm layer of platinum using a high-vacuum sputter coater (EM ACE600, Leica Microsystems).High-throughput, automated imaging was performed using an FEI TALOS transmission electron microscope equipped with a BM-Ceta camera and MAPS v.3.18 software. For each condition, at least 70 replication fork intermediates were analysed per experiment. ssDNA gaps and fork structures were processed and quantified using Fiji58.3D DNA FISH probe designProbe sequences were designed using the PaintSHOP platform (https://paintshop.io/), and probe indices were selected on the basis of previously published iFISH resources59. High-throughput probe production was performed following the iFISH protocol, with probes designed specifically for a HU-specific loop anchors (left and right) (Supplementary Table 3).3D DNA FISHThree-dimensional DNA FISH (3D DNA FISH) was performed according to the uniFISH procedure60. In brief, after treatments, cells were fixed in methanol:acetic acid (3:1, v/v) at room temperature for 15 min. Fixed cells were washed with 0.05% Triton X-100 and incubated with RNase A (100 µg ml−1 in 1× PBS) at 37 °C for 60 min.Cells were dehydrated through a graded ethanol series and air-dried for 3 h. For pre-hybridization, morphologically preserved samples were incubated in 1× uniFISH pre-hybridization buffer (an application-directed, versatile DNA FISH platform for research and diagnostics)60 at 37 °C for 60 min. The primary probe mix was prepared by adding 1 µl of a 1:2,500 working probe solution to 9 µl of 1.1× uniFISH first hybridization buffer. Coverslips were placed onto the probe mix, sealed with Fixogum rubber cement, denatured at 75 °C for 5 min and incubated at 37 °C overnight.The next day, Fixogum was removed and coverslips were washed according to the uniFISH protocol. The secondary hybridization solution was prepared by mixing 1 µl of a 1:50 dilution of fluorescently labelled oligonucleotide with 99 µl of 1× uniFISH second hybridization buffer. The samples were incubated in this solution at 30 °C for 2 h in the dark, followed by washing in universal wash buffer at 30 °C for 30 min in the dark. Cells were counterstained with DAPI for 30 min and mounted.DNA FISH signals were visualized and imaged using a Metafer slide scanner (MetaSystems) equipped with a 63× Plan-Neofluar oil objective (NA 0.75). Quantification of FISH signals and distances was performed using ImageJ and CellProfiler.scEdU-seq on MRC5 cells treated with hydroxyureaFor scEdU-seq, MRC5 cells were first labelled with a single 15 min pulse of EdU, followed by treatment with DMSO, 0.5 mM HU or 1 mM HU, and subsequently fixed. Azide-PEG3-Biotin was conjugated to EdU-labelled DNA as previously described for scEdU-seq21. Cells were next stained with DAPI to assess cell cycle distribution and labelled with CellTrace dyes to distinguish between treatment conditions (mock labelling for DMSO, CellTrace Yellow (Invitrogen, C34567) for 0.5 mM HU; and CellTrace Far Red (Invitrogen, C34572) for 1 mM HU). Cells were sorted using the CytoFlex SRT cell sorter into 384-well plates for scEdU-seq processing.Library preparation was performed as follows. Cells underwent digestion with proteinase K followed by genomic DNA digestion with NlaIII (NEB, R0125) DNA blunt-ending, A-tailing and adapter ligation, incorporating cell barcodes and unique molecular identifiers (UMIs). Pooled single-cell libraries were then bound to Dynabeads MyOne Streptavidin C1 (Invitrogen (65002)) to capture DNA replication fragments through the biotin-modified EdU.Captured fragments were released by heat denaturation and filled in using Klenow DNA polymerase. Libraries were subsequently amplified by in vitro transcription (IVT), reverse transcription and PCR. The final libraries were sequenced on the Illumina NextSeq 2000 platform (P3 chemistry, 2 × 100 bp).TrAEL-seq libraryFor TrAEL-seq, 1 × 10⁶ asynchronous cells were collected after treatment in the absence or presence of HU. Cells were washed in 5 ml buffer (10 mM Tris HCl (pH 7.5), 100 mM EDTA, 20 mM NaCl), embedded in CleanCut agarose and digested overnight at 50 °C in 500 μl digestion buffer (10 mM Tris HCl (pH 7.5), 100 mM EDTA, 20 mM NaCl, 1% sodium N-lauroyl sarcosine, 0.1 mg ml−1 proteinase K) before washing with TE and PMSF. TrAEL-seq was performed using the updated multiplexing protocol as described61.E/L repli-seqExponentially growing MRC5 cells were pulse-labelled with 100 µM BrdU for 20 min. Immediately after the BrdU pulse, cells were collected by trypsinization and fixed in 70% ethanol and incubated overnight at 4 °C in the presence of 15 µg ml−1 Hoechst 33342. Cells were resuspended in 1× PBS and sorted into two fractions (100,000 cells per fraction): early (E) S phase cells and late (L) S phase cells. Sorted cells were incubated overnight in lysis buffer (50 mM Tris-HCl pH 8, 10 mM EDTA, 0.1% SDS, 50 μg ml−1 RNase A, 100 μg ml−1 proteinase K). DNA was purified from the lysates by phenol extraction. Purified DNA was sonicated using the Covaris sonicator, and fragments were size-selected to 200–300 bp using SPRI beads. Before pull-down, size-selected DNA was end-repaired, A-tailed and ligated to paired-end Illumina adapters as in Rep-Hi-C. Adapter-ligated DNA was first used to enrich replicating regions by capturing BrdU-labelled fragments, as in Rep-Hi-C. The resulting single-stranded DNA after BrdU capture was PCR-amplified to the desired number of cycles and sequenced on the Illumina NovaSeq 6000 platform.BrdU-HU seqExponentially growing MRC5 cells were pulse-labelled with 100 µM BrdU for 20 min followed with a 1 h incubation in 1 mM HU. Immediately after the HU treatment, cells were collected by trypsinization and fixed in 70% ethanol and incubated overnight at 4 °C. Cells were incubated overnight in lysis buffer (50 mM Tris-HCl pH 8, 10 mM EDTA, 0.1% SDS, 50 μg ml−1 RNase A, 100 μg ml−1 proteinase K). DNA was then purified from the lysates by phenol extraction. From this step onwards, the rest of the sample preparation was performed as in the E/L repli-seq procedure.Data analysisChIC/Rep-ChIC–seq data processing and analysisSequencing yielded H3K9me3 ChIC/Rep-ChIC datasets (four independent replicates), CTCF Rep-ChIC datasets, FANCD2 Rep-ChIC datasets and BrdU-IP libraries (all in FASTQ format): raw reads were quality-checked using FastQC. Sequenced reads were aligned to the human reference genome (hg38/GRCh38) using Bowtie2 (ref. 62) with the default parameters. Alignment files were converted to BAM format, sorted and indexed using samtools (v.1.15.1)63,64. Principal component analysis of the H3K9me3 ChIC/Rep-ChIC datasets was performed on read count matrices derived from the raw BAM files using multiBAMSummary and the plots were done using plotPCA function in deepTools (v.3.5.6)65 (Extended Data Fig. 2c) to assess replicate concordance and overall data quality.Genome-wide signal tracks were generated from BAM files using the bamCoverage function in deepTools65 with a mapping-quality filter of MAPQ ≥ 30 to exclude poorly aligned reads. Unless otherwise specified, coverage was calculated in bins of fixed size and normalized to reads per kilobase per million mapped reads (RPKM) (RPKM (per bin) = number of reads per bin/(number of mapped reads (in millions) × bin length (kb)), yielding the raw signal of BigWig tracks for all ChIC/Rep-ChIC and BrdU-IP datasets. For ChIC/Rep-ChIC, peaks were called using SEACR66 in norm mode with the relaxed threshold against the corresponding input tracks, and reads were subsequently filtered to those overlapping peak regions for downstream quantitative analyses.Peak sets were further processed to generate genome browser–compatible formats. Peak were converted to BedGraph and BigWig formats using the bigWigToBedGraph67 and bedGraphToBigWig utilities from the UCSC Genome Browser, as well as custom Python wrappers. ChIC/Rep-ChIC signal profiles over selected loci were visualized using the Python package gtracks (v.1.12.6), together with custom Python scripts (Figs. 1c and 3b and Extended Data Fig. 2d). Normalized BigWig tracks and the corresponding peak BED files were used as input for all visualizations to ensure consistent scaling across samples (Supplementary Table 9).Tornado (heat map plus aggregate) plots of ChIC/Rep-ChIC signal were generated in two steps. First, significant peaks were called genome-wide using MACS368 (function bgpeakcall). For global tornado plots (Fig. 1d and Extended Data Fig. 2e,f), the most significant peaks were selected and signal matrices centred on peak summits were computed from scaled BigWig files using the computeMatrix function in deepTools65 (reference-point mode, bin size 50 bp). The resulting matrices were then visualized as heat maps using plotHeatmap, which simultaneously reports the corresponding average signal profiles. In this context, tornado plots refer to heat maps in which each row represents a fixed-width window around a genomic feature (for example, a peak summit), rows are ordered by signal intensity, and an aggregate profile across all rows is shown below the heat map (Fig. 1d and Extended Data Fig. 2e).HU- or APH-unique peaks enriched for BrdU were defined in a differential peak-calling framework. HU- or APH-unique peaks were then defined as regions present in the HU or APH peak sets but absent from the UT peak set at the same calling thresholds using custom Python codes. The peaks overlapping with BrdU signal were then identified to obtain the replication-induced de novo peaks using the bedtools intersect function. Tornado plots comparing UT versus HU or UT versus APH were generated by providing the condition-specific BigWig files and these unique peak sets to computeMatrix (reference-point mode, bin size 50 bp), followed by visualization with plotHeatmap (Fig. 1e and Extended Data Fig. 2g).For fountain-centred analyses (Fig. 2d), HU-unique peaks from UT, HU and HU + G9ai samples were intersected with predefined fountain regions using standard BED intersection tools. Peaks overlapping IZs or TZs within fountain regions were classified accordingly. ChIC/Rep-ChIC tornado plots were then generated separately for IZ-associated and TZ-associated fountains using computeMatrix and plotHeatmap as described above, enabling direct comparison of replication-associated chromatin changes at IZs versus TZs.Subtraction and coverage-based operations on genome-wide tracks were performed using the bigwigCompare and bigwigAverage functions from deepTools (v.3.5.6) on SEACR peak-called BigWig files. Whole-genome heat maps of HU–UT differences in H3K9me3 ChIC/Rep-ChIC signal were plotted over SEACR peak-defined regions using custom Python scripts (Extended Data Fig. 3d). For each genomic position within the analysed regions, aggregated values across samples or conditions were calculated and visualized as heat maps (Fig. 3h and Extended Data Fig. 8f–h).To analyse H3K9me3 enrichment at replication IZs, IZ coordinates for MRC5 cells were derived using the OKseqHMM pipeline69 applied to TrAEL-seq data. Initial signal coverage across IZs and their flanking regions was computed from normalized H3K9me3 BigWig files using the computeMatrix function in deepTools (v.3.5.6)65 with a bin size of 500 bp, and enrichment profiles were visualized using custom Python scripts (Extended Data Fig. 3f). IZs were subdivided into early- and late-replicating zones on the basis of replication timing profiles obtained from in-house two-stage Repli-seq experiments in MRC5 cells, allowing H3K9me3 enrichment to be compared between early and late IZs under different replication stress conditions.TrAEL-seq data processingTrAEL-seq data were processed and mapped to the human reference genome GRCh38 using the revised pipeline available at GitHub (https://github.com/laurabiggins/TrAEL-seq)14,61. This pipeline includes trimming of the poly(T) tail, separation of multiplexed sets, separation into T and no-T datasets, copy-number-aware UMI deduplication and mapping with Bowtie2. The resulting data were analysed using the OKseqHMM toolkit (originally developed for Okazaki fragment sequencing), which has been recently extended to other RFD mapping methods (such as TrAEL-seq) OKseqHMM (v.2.0)69; the OKseqHMM toolkit separates reads by Watson or Crick strand and computes the RFD in 1 kb non-overlapping windows, defined as (C – W)/(C + W) where C and W are read counts on the Crick and Watson strands, respectively. The raw RFD signal was further smoothed using a 15 kb sliding window (1 kb step). Genomic regions with insufficient coverage (below the default read-depth threshold in OKseqHMM) were masked. Smoothed RFD profiles were segmented using the toolkit’s built-in four-state hidden Markov model to define replication IZs (up segments), TZs (down segments) and two intermediate flat states. Where indicated, origin efficiency metrics were also calculated at multiple scales for visualization. Biological replicates were processed independently through this pipeline and used for downstream analysis. These RFD profiles and segmentations were used for comparative analyses and visualization in genome browsers.To calculate fork pausing, the signal in the UT condition was subtracted from the HU-treated condition. Meta-analysis was then performed, either retaining strand-specific information (Fig. 3j and Extended Data Fig. 8i) or combining the strands (Fig. 3i) as needed.Repli-seq data processingRepli-seq reads were mapped to the hg38 reference genome using Bowtie2 (ref. 62) with the default parameters, and alignments were filtered to retain only uniquely mapped, properly paired reads. For each sample, genome-wide coverage was computed, and the replication timing profile was derived as the log2-transformed ratio of early S phase to late S phase read counts in non-overlapping 5 kb windows. All initial processing (alignment, filtering, windowed coverage calculation) was performed using custom Python scripts and standard command-line tools. The resulting raw replication timing profiles were then post-processed in R by applying loess smoothing with a span of ~300 kb, following the recommendations of the original Repli-seq protocol. This pipeline produced a smoothed bedGraph file for each sample, containing final log2[early/late] replication timing values for each 5 kb window. The bedGraph was subsequently converted to a bigWig format for efficient visualization and analysis (using UCSC command-line tools). These smoothed replication timing tracks (bedGraph and bigWig files) were used for all downstream visualizations and quantitative analyses involving replication timing data.Hi-C and Rep-Hi-C data processingIn situ Hi-C libraries (and Rep-Hi-C libraries, where specified) were processed using the Juicer pipeline (v.1.6)70 with the default parameters, and the merged_sort.txt was filtered for MAPQ score greater than equal to 30 but retaining all reads (including duplicates). This resultant file was used to generate .hic files for all downstream analysis. Juicer produced raw contact count matrices at multiple resolutions (1 Mb, 100 kb, 50 kb, 25 kb, 10 kb and 5 kb) from the FASTQ data. We first ran MultiQC (v.1.11)71 on the aligned reads for quality control, extracting summary statistics such as the number of short-range (≤20 kb), long-range (>20 kb) cis interactions and trans interactions for each sample. Next, we used HiCExplorer (v.3.7.2)72,73 to convert the contact matrices into the cooler format: each sample’s contact data were consolidated into a single multi-resolution .mcool file (with all resolutions listed above), and individual .cool files were generated for key resolutions (for example, 10 kb and 50 kb). Hi-C contact matrices were visualized interactively using Juicebox (v.2.17)70 at 1 Mb and 100 kb resolution to inspect data quality and global interaction patterns. For further analysis, we used the cooltools library17 with custom Python scripts to handle the cooler files for operations such as normalization, expected contact calculation and visualization.Hi-C and Rep-Hi-C compartment analysisA/B compartment analysis was performed on Hi-C and Rep-Hi-C contact matrices using principal component analysis of contact correlations. We computed the first eigenvector (EV1) at 50 kb resolution on Knight–Ruiz-normalized contact matrices using cooltools17. The genomic GC content profile was used to determine the orientation of EV1 (that is, the sign was flipped if necessary, so that positive EV1 values correspond to A compartments, which are typically gene rich and GC rich). Contiguous genomic regions with the same EV1 sign were defined as A or B compartment domains. To identify compartment switching, we compared the EV1 sign of each 50 kb bin between conditions. Any bin that exhibited an opposite EV1 sign in HU-treated cells compared with UT cells was classified as a switching bin (as a control, we also assessed compartment changes between Hi-C and Rep-Hi-C in the same condition, UT versus HU, to ensure that differences were treatment specific rather than technology specific). We calculated the proportion of the genome undergoing compartment switching as the percentage of non-masked 50 kb bins that changed compartment status between UT and HU.To visualize how HU treatment affected compartmental contacts, we generated differential contact maps at 50 kb resolution by taking the log2-transformed ratio of Knight–Ruiz-normalized contact frequencies in HU-treated versus UT cells. In these difference maps, red and green colouring indicates increased or decreased contact frequency in HU relative to UT, respectively (the colour scale was symmetric around zero, from red to green) (Fig. 2b, Extended Data Fig. 6a and Supplementary Fig. 2).We also performed saddle plot analysis using cooltools17 to quantify genome-wide compartment interactions. For each sample, 50 kb bins were ranked by their EV1 values and binned into percentiles (excluding the extreme 2.5% of bins at each end of the EV1 distribution, as recommended by the cooltools17 pipeline, to avoid outliers). We then calculated an O/E contact matrix stratified by these EV1 percentiles for each chromosome arm. This resulted in a 50 × 50 saddle plot in which the diagonal (top-right to bottom-left) represents contacts among bins with similar compartment identity (A–A or B–B), and the off-diagonal represents A–B contacts. Saddle plots were generated for Hi-C and Rep-Hi-C in both UT and HU conditions (Fig. 2a and Extended Data Fig. 5b). From the saddle plot, we quantified compartment interaction strength by measuring the enrichment of contacts in the A–A and B–B regions. Specifically, we calculated the area within the square of strong A–A and B–B interactions (indicated by a dotted line on the saddle plot) using custom scripts, and used this as a metric of compartmentalization strength. To examine changes after HU treatment, we also created difference saddle plots by subtracting the UT saddle values from the HU saddle values (for both Hi-C and Rep-Hi-C). These difference plots directly highlight how HU alters A–A vs. B–B contact frequencies (with warmer colours indicating an increase in compartmental contacts and cooler colours a decrease, relative to UT).Subcompartment analysisFiner-scale subcompartment analysis was performed using CALDER (calibrated automatic local detection of subcompartments)74 on the 50 kb binned contact data. CALDER74 identified multiple subcompartment states hierarchically. In our analysis, we grouped the genome into eight subcompartments: starting from the conventional A and B compartments, each was divided into two subclasses (A1, A2 and B1, B2), and each subclass was further split into two (yielding A1.1, A1.2, A2.1, A2.2 and B1.1, B1.2, B2.1, B2.2). We took the first eight classifications from the CALDER74 subcompartment tree. We then examined how subcompartment assignments changed with HU treatment. A Sankey diagram75 was generated (Fig. 5c) to visualize the transitions of genomic regions between subcompartment states in UT versus HU, using custom Python scripts. This illustrated the differential compartment shifts induced by replication stress (HU) in both Hi-C and Rep-Hi-C datasets (Extended Data Fig. 5d).TAD analysisTADs were identified in the Hi-C and Rep-Hi-C contact matrices using the hicFindTADs function from HiCExplorer (v.3.7.2) with the default parameters. This algorithm produced a set of TAD coordinates (output as a BED file of domains). For downstream analyses, we classified each TAD as early-replicating or late-replicating on the basis of the overlap with replication timing data. Specifically, if ≥80% of a TAD’s genomic span coincided with regions labelled as early S phase in our replication timing profile, it was designated an early TAD; if ≥80% overlapped late S phase regions, it was designated a late TAD (TADs that did not meet either criterion was left unclassified). The replication timing profiles used for this classification were derived from our Repli-seq experiments in MRC5 cells. We also calculated insulation scores and boundary strength metrics using cooltools functions. These metrics were mapped to the TAD boundary coordinates obtained from hicFindTADs to assess whether HU treatment or other conditions affected TAD boundary strength, and whether there were differences in insulation at boundaries between early and late replicating TADs.Aggregate analysis of fountainsWe used the fountain-calling pipeline (the fun pipeline as described previously16) to identify fountains, which are specific interaction patterns in contact maps, in both UT and HU-treated Hi-C/Rep-Hi-C samples. This analysis was conducted at the 10 kb and 25 kb resolutions. The fountain-calling pipeline outputs the midpoint coordinates of all detected fountain regions. We merged the midpoints from all fountains identified (combining 10 kb and 25 kb resolution results from both UT and HU) using bedtools merge, yielding a unified set of fountain centre positions (referred to as the merged fountain file).Using this merged list of fountain coordinates, we performed aggregate contact analysis to compare fountain features across different conditions (UT, HU, UT + G9ai, HU + G9ai). We applied the on-diagonal pileup function of cooltools (as described previously17) to aggregate the Hi-C or Rep-Hi-C contact matrices around each fountain centre. In these pileups, we extracted a square region of the contact matrix centred on the fountain midpoint (extending ±250 kb in both dimensions) and averaged the contact signal over all fountain locations genome-wide. For Rep-Hi-C samples, we computed O/E contact values using the corresponding Hi-C maps as the expected background, before aggregation. The result of this analysis is an average fountain contact map for each condition, reflecting the typical interaction pattern around fountain loci. To highlight differences between conditions, we also computed difference maps (for example, HU minus UT) of the aggregated fountain contact matrices.Furthermore, to quantitatively compare fountain signals between conditions, we generated summary box plots from the aggregate difference matrices. For each aggregated fountain difference map, we flattened the matrix (taking each pixel’s O/E difference as an independent data point) and plotted the distribution of these values. This approach provides a genome-wide view of how fountain interaction strengths change under different treatments. All box plot generation and statistical analyses were performed using custom Python scripts (Fig. 2e,f and Extended Data Fig. 6d,f).Corner plot analysisIn addition to the on-diagonal fountain pileups, we performed a complementary corner-plot aggregate analysis. This analysis focused on off-diagonal corner features of the contact matrix around fountain loci (for example, to capture any directional or asymmetric interaction patterns flanking the fountain centres). Using the same merged fountain list, we aggregated contact matrices with cooltools17 in a manner similar to the fountain analysis, but capturing the corner regions relative to each fountain midpoint. As with the fountain aggregate, we used a ±250 kb window for the corner pileup around each fountain and averaged across all fountains to produce an aggregate corner interaction map for each condition (UT, HU, UT + G9ai, HU + G9ai). We then computed difference maps between conditions for the corner aggregates. To summarize these differences, we flattened the aggregate corner difference matrices (taking each pixel’s value as a datapoint) and generated box plots, analogous to the fountain analysis above. This corner plot analysis allowed us to assess subtle changes in the spatial interaction pattern (off-diagonal signals) around fountain sites under different treatments. All analyses for corner plots were implemented with custom Python code using cooltools and standard libraries for plotting (Fig. 2g,h).Aggregate analysis of chromatin loopsChromatin loops were identified using the HICCUPS CPU70 pipeline on the contact maps. We ran HICCUPS on the .hic files generated by Juicer at the 10 kb and 25 kb resolutions to call loop anchors in each condition. To determine which loops were specific to HU treatment, we compared loop sets between HU-treated and UT samples. HU-unique loops were defined by using the pairToPair utility from BEDTools (v.2.31.0) with the -neither option, which finds loop anchors present in HU that have no overlapping counterpart in the UT condition. We further assessed the reproducibility of HU-specific loops by intersecting the loop lists from biological replicate experiments (requiring at least 80% overlap in anchor positions, using bedtools intersect with -f 0.8). Only highly reproducible HU-specific loops were retained for downstream analyses.We next performed APA on the sets of chromatin loops to evaluate their average contact enrichment. Using cooltools off-diagonal pileup functions, we generated APA plots for loops in MRC5 and HCT-116 cells (Fig. 3f,g). For each set of loops, we extracted a 10-kb-resolution contact submatrix centred on each loop (±250 kb padding around the loop centre) and averaged these submatrices to produce a mean contact enrichment map. This aggregate contact map highlights the typical loop peak (the high interaction frequency at the loop anchor pair) over local background interactions. We quantified the loop strength by comparing the contact intensity at the central loop pixel to the surrounding local background in the APA matrix. Specifically, loop strength was calculated as the ratio of the average contact frequency in the central 1–2 bins (around the loop anchor intersection) to the average contact in a surrounding donut-shaped area that represents background. These calculations were done for each cell line (MRC5, HCT-116), experiment type (Hi-C versus Rep-Hi-C), and condition (UT versus HU) using identical parameters, to allow direct comparisons. The numerical loop enrichment values are indicated on the APA plots (top right corners) for reference.To investigate the binding orientation of CTCF at HU-specific loops, we analysed CTCF motifs at the loop anchors. We scanned the sequence of each HU-unique loop anchor for the CTCF binding motif using the JASPAR core vertebrate position weight matrix. For each anchor, we retained the strongest motif hit that overlapped a peak of CTCF enrichment in our HU Rep-ChIC dataset (CTCF Replicative-ChIC in HU-treated cells). Using the Logomaker Python package76, we generated sequence logos of these retained CTCF motifs to verify their consensus. We then determined the relative orientation of CTCF motifs at each loop: if both anchors of a given loop carried motifs oriented in the same genomic direction (for example, both on the positive strand pointing the same way), the loop was classified as tandem; if the two anchor motifs were oriented towards one another (convergent orientation), the loop was classified as convergent (loops for which one or both anchors lacked a confidently mapped CTCF motif with HU-specific enrichment were excluded from this orientation analysis). We tallied the proportion of HU-specific loops with tandem versus convergent CTCF motif arrangements and plotted the percentages (Fig. 3e). This analysis aimed to determine whether HU-induced loops were predominantly supported by convergent CTCF binding (as is often the case for stable loops) or if other configurations were common under replication stress.Fork-deg-seq processingFork-deg-seq libraries generated in HCT-116 cells were aligned to the human genome (hg38/GRCh38) using Bowtie2 (with the default settings for end-to-end alignment). Sequencing yielded paired-end reads (Illumina), which were subjected to quality control using FastQC77. The resulting SAM files were converted to BAM, sorted and indexed using Samtools (v.1.15.1)64. To account for background, each condition had a matched input control; we generated coverage tracks using deepTools bamCoverage (v.3.5.6), normalizing the signal in each sample against its corresponding input (--control BAM option) to produce a net enrichment bigWig track for Fork-deg-seq signal.Fork-deg-seq data analysisDownstream analysis of the Fork-deg-seq signal focused on the enrichment of fork degradation at HU-induced loop sites and its relationship with replication timing and DNA damage markers. First, to obtain a clean fork degradation signal track, we subtracted the input signal from each sample using deepTools (through the bigwigCompare function with --operation subtract). The resulting difference signal (sample minus input) was exported to bedGraph format using the UCSC utility bigWigToBedGraph. We filtered this bedGraph to retain only positive values (genomic regions with genuine fork degradation enrichment above the background), then converted it back to a bigWig file using bedGraphToBigWig. This processed Fork-deg-seq track represents the specific signal of nascent-strand degradation.For aggregate analyses, we focused on the set of HU-specific chromatin loops (as defined in the loop analysis above). We used deepTools computeMatrix -scale-regions to extract Fork-deg-seq signal profiles centred on each loop. Signals were computed for a window spanning each loop anchor region with 5 kb flanking on each side; a bin size of 50 bp was used for the 5 h HU treatment samples, whereas a bin size of 500 bp was used for 3 h HU samples. This produced a matrix of Fork-deg signal values around each loop, which we then averaged across all loops to get an overall Fork-deg-seq enrichment profile over HU-specific loops.We stratified this analysis by replication timing: using the HCT-116 replication timing data (dataset ID Int90617792)9,13,78,79, we classified each fragile sites as early or late if at least 80% of the fragile site span fell in early replicating or late-replicating regions, respectively (fragile sites not meeting either threshold was excluded from this timed subset). We then computed separate aggregate Fork-deg-seq signal for early loops and late sites. The resulting profiles were plotted to compare fork degradation at early- versus late-replicating fragile site regions (Extended Data Fig. 10c–e). For the RPE-1 WT and shBRCA2 samples, the Fork-deg-seq enrichment matrices (computed as described above) were imported into Python, and the average profiles were plotted with error bars representing the standard error across loops (Extended Data Fig. 9j).We next examined how the density of HU-specific loops in the genome relates to replication timing and fork degradation levels. We calculated a loop density track by counting the number of HU-specific loops per genomic interval. Specifically, we used bedtools genomecov -bga on the HU-specific loop coordinates to produce a base-by-base coverage track of loop occurrence, then identified contiguous loci with the same loop count (for example, regions with 0 loops, 1 loop, 2 loops). We considered a loop to cover a genomic region if it covers at least 70% of the bin. For each such locus, we determined the mean replication timing value by overlapping the locus with the replication timing data and averaging the timing signal within it. We grouped loci into two categories: those with ≥2 loops and those with <2 loops and plotted the distribution of replication timing values for each group as a histogram. This enabled us to see whether regions with high loop density tend to replicate earlier or later than regions with few or no loops (Fig 4c).Finally, we integrated additional genomic datasets to provide context for the HU-specific loops and fork degradation sites (Supplementary Figs. 6e and 8 and Extended Data Fig. 10i). We gathered genome-wide data for FANCD2 binding (Fanconi anaemia protein, from chromatin immunoprecipitation–sequencing (ChIP–seq); NCBI SRA: PRJNA473287), γH2AX (a marker of DNA damage, from ChIP–seq; Gene Expression Omnibus (GEO): GSE60395), CTCF binding (from our Rep-CUT&RUN experiments), and genomic instability sites (single-nucleotide variants (SNVs) from a previous study52).Focusing on the HU-specific loops, we first aligned these datasets relative to loop anchor positions. To do this, we intersected loop anchor coordinates with CTCF peak locations (using bedtools) and identified the nearest CTCF binding site to each loop anchor (this helps to align signals because CTCF often demarcates loop anchors). We then used deepTools65 to extract the signal intensity of each dataset (FANCD2, γH2AX52, Fork-deg-seq, CTCF and SNVs) in regions around the loop anchors, anchored at the nearest CTCF site. These signals were compiled into a matrix and plotted as a heatmap, with each row representing a loop (ordered by some criterion, for example, signal strength or genomic location) and the columns spanning the region around the anchor. The heat maps therefore display the co-occurrence of fork degradation, DNA damage (γH2AX), repair factors (FANCD2) and CTCF at HU-induced loop sites, providing insights into the molecular context of these structures. Moreover, as illustrative examples, we selected specific genomic regions on chromosome 16 and chromosome 8 and plotted the Fork-deg-seq signal tracks for all conditions (WT, CTCF knockdown, G9ai, DKD, with and without nucleases and shBRCA2) across those regions (Fig. 4d and Extended Data Figs. 9j and 10b). These custom Python-generated line plots highlight how fork degradation signals change in the presence of replication stress and different genetic perturbations, in relation to the local replication and looping landscape.scEdU-seq data analysis
Replication-stress-induced chromatin loops protect fork stability - Nature
Replication stress induces the formation of transient chromatin loops that enclose de novo heterochromatin-enriched stalled replication forks.
22,267 words~101 min read