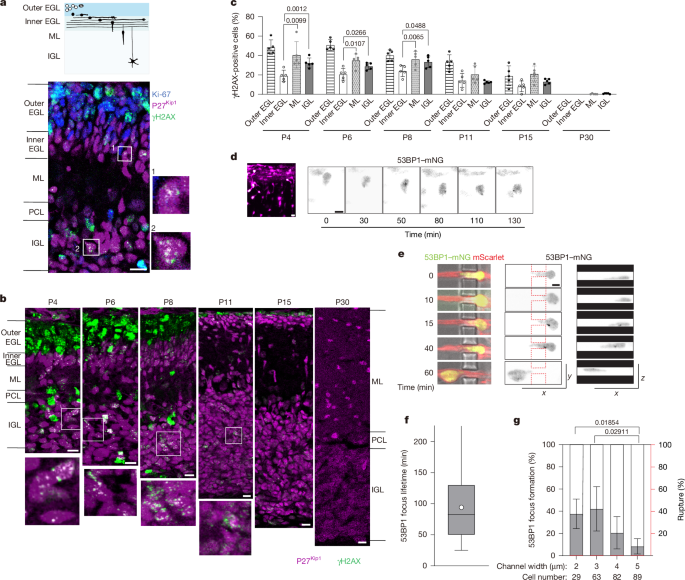
MainOwing to their limited regenerative ability, maintaining genome stability in neurons is crucial for preserving brain function throughout the lifespan7,8. However, neurons are continuously exposed to various sources of DNA damage, including intrinsic factors such as oxidative stress, transcription and neural activity, as well as extrinsic factors such as radiation and environmental toxins9,10. Neurons are therefore equipped with robust mechanisms to prevent and correct DNA lesions, as excessive or unresolved damage can contribute to brain ageing and neurodegeneration8,11,12.During brain development, newborn neurons migrate from their birthplace in the germinal layers to their final destinations in the emerging cortices and nuclei, where they are integrated into functional neural circuits. Migrating neurons squeeze the nucleus, their largest cargo, through narrow spaces crowded with many other cells and extracellular components13,14. Neurons express very low levels of lamin A, which confers high nuclear deformability and migratory ability1,15, but may also render them vulnerable to mechanical stress and resulting DNA damage2,16. In cancer cells and immune cells, severe nuclear deformation during confined migration can cause transient nuclear envelope (NE) rupture and subsequent DNA damage, which has been implicated in cellular senescence and malignant transformation3,4,5,6. By contrast, the impact of nuclear deformation during neuronal migration has not been described. In this study, we investigated whether confined migration influences genome integrity in postmitotic neurons during normal brain development.Confined migration induces DSBs in neuronsCerebellar granule neurons (CGNs) are generated by granule neuron precursors (CGPs) in the outer external granule layer (EGL) in the cerebellar cortex (Fig. 1a). Postmitotic CGNs move to the inner EGL and then migrate radially through the molecular layer (ML) to the internal granule layer (IGL) during the first three postnatal weeks in mice. The nuclei of migrating neurons exhibit highly dynamic motion, including frequent rotation and deformation13,17. We first studied DNA damage in the developing cerebellar cortex at postnatal day 6 (P6) using immunofluorescence analysis of γH2AX, a marker for DNA DSBs, along with the cell proliferation marker Ki-67 and the differentiated neuron marker p27Kip1 (Fig. 1a and Extended Data Fig. 1a). Many Ki-67-positive CGP nuclei in the outer EGL were co-stained with γH2AX. Some cells with strong γH2AX signals in the ML and IGL were identified as glial cells on the basis of BLBP expression (Extended Data Fig. 1b). Besides these DSBs, which were presumably generated by replication stress during cell cycle progression, numerous γH2AX foci were observed in postmitotic CGNs in the ML and IGL that were co-stained with p27Kip1 (Fig. 1a and Extended Data Fig. 1a).Fig. 1: Postmitotic neurons undergo DNA damage during migration through confined interstitial spaces.a, Schematic of CGN differentiation during postnatal cerebellar development. CGPs (white) populate the outer EGL. CGNs (black) in the inner EGL extend axons and migrate parallel to the EGL surface and then radially through the ML to reach the IGL (top). Bottom, sagittal section of a P6 mouse cerebellar cortex stained for γH2AX (green), Ki-67 (blue) and p27Kip1 (magenta). Postmitotic CGNs in the boxed regions in the ML and IGL bearing γH2AX foci are magnified on the right. Similar results were obtained from three mice from independent litters. b, The cerebellar cortex from P4 to P30, stained for γH2AX and p27Kip1. The boxed regions in the IGL are magnified at the bottom. c, The percentage of γH2AX-positive cells in the cerebellar cortical layers. Data are mean ± s.d. Two-way repeated-measures analysis of variance (ANOVA) with Dunnett’s multiple-comparison test; P values are shown. The outer EGL was excluded from the comparison. d, Snapshot image of CGNs electroporated with mScarlet (magenta) and 53BP1–mNG (green) in a cerebellar slice from a P7 mouse (left). Right, image sequence of 53BP1–mNG signals in a CGN migrating from the EGL to the ML. See also Extended Data Fig. 1e. e,f, Image sequence of a bright-field view of a CGN transfected with mScarlet and 53BP1–mNG (left) and 53BP1–mNG signals in the xy (middle) and xz (right) planes during migration (e), and the focus life-time in CGNs migrating in 3-µm microchannels (f). The box plots show the median (centre line), 25–75 percentiles (box limits), the whiskers represent the full data range, and the circle indicates the mean of 66 cells analysed. g, The percentage of CGNs that formed new 53BP1 foci (grey) or underwent NE rupture (red) during and/or after passage through channels of the indicated size. Data are mean ± s.d. Statistical analysis was performed using Welch’s ANOVA with Games–Howell multiple-comparison test. Scale bars, 10 µm (a,b), 5 μm (d), 3 μm (e). See also Supplementary Videos 1 and 2. Sample sizes and biological replicates are described in the Source data.Source dataWe next examined γH2AX signals at various developmental stages. Abundant γH2AX signals in the outer EGL were observed at P6 and earlier, but sharply declined by P11 as CGPs were exhausted. By contrast, postmitotic CGNs with γH2AX foci in the ML and emerging IGL plateaued from P4 to P8 and persisted until P15 (Fig. 1b). By P30, γH2AX foci were no longer detectable. The proportion of γH2AX-positive neurons was higher in the ML than in the inner EGL at all stages examined, suggesting that postmitotic CGNs acquire de novo DSBs after the onset of radial migration (Fig. 1c). Consistently, γH2AX foci were observed in the nucleus of GFP-positive CGNs migrating in the ML in Neurod1-GFP transgenic mice (Extended Data Fig. 1c).To further confirm that DSBs are generated during migration, we electroporated the cerebellum with the DSB marker 53BP1-mNeonGreen (53BP1–mNG) and performed live imaging of CGNs in an organotypic cerebellar slice culture. We observed transient formation of 53BP1–mNG foci in CGNs undergoing tangential migration in the inner EGL and radial migration in the ML (Fig. 1d, Extended Data Fig. 1d,e and Supplementary Video 1). To examine whether DNA damage is induced by nuclear deformation in dense neural tissue, we monitored dissociated CGNs cultured on microfabricated substrates with constricted channels18 (1–5 µm width × 5 µm height; Extended Data Fig. 1f). CGNs repetitively passed through channels, undergoing nuclear deformation and compression. We observed transient accumulation of 53BP1–mNG foci during and after passage of the nucleus (Fig. 1e,f and Supplementary Video 2). Migration through the narrower constrictions tended to increase the incidence of focus formation (Fig. 1g and Extended Data Fig. 1f). These results strongly suggest that migrating CGNs undergo DSBs owing to mechanostress while migrating in a confined environment in the developing brain.We next examined whether DSB formation during neuronal migration is fundamental among neuronal types. Differentiated Purkinje cells migrate from the ventricular zone to the cerebellar cortex primordium at embryonic day 12–18 (E12–18)19. γH2AX foci were detected in the nuclei of postmitotic Purkinje cells labelled by anti-LHX1/5 during and after migration (Extended Data Fig. 2a). Moreover, we observed significant γH2AX foci in the emerging neocortex at E15. The number of γH2AX-positive cells was high in the ventricular zone populated by neural progenitor cells and declined in the intermediate zone as differentiation proceeded. Nuclei with γH2AX foci increased again in the subplate, suggesting de novo DSB formation in postmitotic neurons after the onset of radial migration (Extended Data Fig. 2b). Live imaging of cortical neurons in an organotypic culture also revealed the transient formation of 53BP1–mNG foci during migration from the intermediate zone to the cortical plate (Extended Data Fig. 2c,d and Supplementary Video 3). Together, these observations indicate that at least three types of postmitotic neuron undergo DNA damage during neuronal migration in the developing brain.Neurons generate DSBs without NE ruptureTo investigate the mechanism underlying transient DNA damage in CGNs during confined migration, we adopted a Transwell assay with different pore sizes18. The majority of the CGNs reached the bottom surface within 12 h of seeding through both confined 3-μm pores (56%) and permissive 8-μm pores (79%) (Extended Data Fig. 3a). We observed a significantly higher proportion of cells generating γH2AX foci after confined migration through 3-μm pores compared with cells after non-confined migration through 8-μm pores or unmigrated cells on top of surfaces with 0.4-μm pores (Fig. 2a–c and Extended Data Fig. 3b). Similar results were obtained for 53BP1 staining (Extended Data Fig. 3c,d). We confirmed that γH2AX foci in postmigratory CGNs form characteristic nanodomains in both cerebellar cortex and Transwell cultures, typically clustering around a single spot of Ku70, which is involved in DSB repair through the non-homologous end-joining (NHEJ) pathway20,21 (Extended Data Fig. 3e,f). By contrast, RAD51 foci, indicative of homologous recombination, were not observed in CGNs. More than 20% of CGNs bore multiple γH2AX and/or 53BP1 foci at 6 h and 12 h after transmigration through 3-μm pores, but the levels decreased to the control level at 24 h and thereafter (Fig. 2b,c and Extended Data Fig. 3c,d). To rule out the possibility that the cells were mitotic while migrating and subsequently became postmitotic after reaching the bottom surface, we performed the same assay using CGNs depleted of mitotic CGPs by 24 h preincubation with the cell cycle progression inhibitor palbociclib. A comparable percentage of γH2AX foci was observed, indicating that these DSBs arose from confined migration of CGNs, not from residual replication-induced DSBs originating in CGPs (Extended Data Fig. 3g). A TUNEL assay revealed little to no increase in apoptotic cell death up to 36 h, suggesting that DSBs induced by confined migration are repaired without causing apoptosis (Extended Data Fig. 3h).Fig. 2: DNA damage during neuronal migration is associated with TOP2-dependent cleavage.a, Immunostaining of CGNs that have migrated through 3-μm or 8-μm pores, 12 h after seeding. b,c, Temporal changes in the percentages of γH2AX-positive CGNs (b; cells with at least five nuclear γH2AX foci) and the average focus number per cell (c) after Transwell migration (3 or 8 μm) and non-migrated nuclei on 0.4-µm pores. d,e, Time-lapse sequences of a HeLa cell (d) and a CGN (e) transfected with mScarlet and mNG-NLS migrating through 3-μm microchannels. See also Supplementary Videos 4 and 5. f, HeLa cells (left) and CGNs (right) were transfected with GFP–cGAS with (3 μm) or without (0.4 μm) Transwell migration (top). Bottom, the percentage of cells with cGAS foci in the nucleus. g, Immunoblot (left) and quantification (right) of TOP2cc formation in migrated (3 μm) and non-migrated (0.4 μm) CGNs at the indicated time after seeding. The two lightest fractions from the CsCl-gradient ultracentrifugation include free TOP2, while the other heavier fractions include TOP2cc. h, Immunoblot (left) and quantification (right) of TOP2cc after 3-µm Transwell migration with or without etoposide (ETO) or epoxomicin. i, γH2AX foci in CGNs after 24 h of 3-μm Transwell migration with or without etoposide. j, Time course analysis of γH2AX-positive nuclei with or without etoposide. k, The average γH2AX focus number (left) and the percentage of γH2AX-postive cells (right) after 3-µm Transwell migration. Each dot represents one independent experiment. Statistical analysis was performed using two-way ANOVA with Tukey’s multiple-comparison test (b, c, h, j and k), two-tailed unpaired t-tests (f) and one-way ANOVA with Tukey’s multiple-comparison test (g); P values are shown. For j, the etoposide-treated and untreated conditions at the same timepoints were compared. Data are mean ± s.d. Scale bars, 5 μm (d–f) and 3 μm (a,i). Sample sizes are described in the Source data.Source dataIt has been demonstrated that DSBs induce dynamic structural changes of the NE and promote DSB repair by enhancing the proximity of DNA damage response (DDR) factors associated with the invaginated NE22,23. This raises the possibility that nuclear deformation during confined migration interferes with NE dynamics, thereby delaying the repair of DSBs formed independently of confined migration. We observed that CGNs exhibited NE invaginations after 3 µm confined migration, and these were abolished by treatment with the microtubule depolymerizer nocodazole or by inhibition of the NE protein nesprin-1/2 through overexpression of a dominant-negative nesprin-1 mutant13 (Extended Data Fig. 3i). However, inhibition of NE invagination did not affect the formation or degradation of DSBs (Extended Data Fig. 3j,k). Moreover, ATM, one of the mechanosensitive DDR kinases responsible for NE shape change22, was not required for DSB resolution (Extended Data Fig. 3l). These results suggest that DSB formation and repair during confined migration can occur independently of NE tubule formation.In some cancer cell lines, DNA damage during confined migration has been shown to be exacerbated by NE rupture, which permits the entry of cytoplasmic nuclease and the leakage of DNA damage repair factors from the nucleus5,6. It has recently been reported that cortical neurons form micronuclei during radial migration, suggesting that neurons also undergo NE damage by nuclear deformation24. We confirmed NE rupture events in HeLa cells using a fluorescent reporter fused to a nuclear localization sequence (mNG–NLS) that rapidly spread in the cytoplasm as cells migrated through constricted channels3,4 (Fig. 2d and Supplementary Video 4). By contrast, in CGNs cultured in the same patterned dish, NE rupture was never observed, even in severely deformed nuclei migrating through narrow pores of 2 or 3 µm width (Figs. 1g and 2e and Supplementary Video 5). HeLa cells expressing catalytically inactive cGAS fused to GFP (GFP–cGAS), a marker of NE rupture3,4,25, showed GFP–cGAS foci in the nuclear periphery after transmigration through 3-μm pores in a Transwell. By contrast, peripheral accumulation of GFP–cGAS was not observed in CGN nuclei with or without confined migration in Transwells (Fig. 2f). NE blebbing and rupture were rare events (that is, less than 3% of CGNs migrating through 3-μm pores), as indicated by immunofluorescence with the nuclear lamina marker lamin B1 and the chromatin marker H4K20me3 (Extended Data Fig. 3l). These findings suggest that, in contrast to many cancer cells, CGNs generate DNA damage by mechanical stress during confined migration independently of NE rupture.DSBs in neurons involve TOP2Although NE rupture is a key trigger for DSB formation in many migratory cells, some cell lines have been shown to undergo DSBs in the absence of NE rupture under tight confinement, possibly due to increased torsional strain in the genome during replication6,26. We predicted the involvement of topoisomerase II (TOP2), a key enzyme that relieves torsional stress during replication and transcription, in neuronal DSBs generated in the absence of NE rupture. As previously reported, TOP2β was highly expressed in the nuclei of postmitotic CGNs undergoing radial migration27 (Extended Data Fig. 4a). TOP2 catalyses a temporary DSB in a DNA molecule to allow the passage of another DNA segment, followed by religation. During this process, TOP2 becomes covalently attached to the ends of the DNA break, forming a transient intermediate called the TOP2–DNA cleavage complex (TOP2cc). Failure of TOP2 to religate the break and complete its catalytic cycle results in the accumulation of persistent TOP2ccs, which must then be resolved through proteasomal degradation and DNA repair28. We measured the stalled TOP2ccs in CGNs in a Transwell assay. In unmigrated cells on 0.4-µm-pore filters, we detected free TOP2β unbound to DNA and a very small quantity of TOP2ccs. By contrast, CGNs that migrated through 3-μm pores showed a strong accumulation of TOP2ccs at 8 h, which declined by 12 h (Fig. 2g). This decrease was strongly inhibited in the presence of the proteasome inhibitor epoxomicin (Fig. 2h). These results suggest that TOP2β fails to complete DNA religation and becomes trapped on DNA during confined migration, and is subsequently removed by proteasomal degradation. We next examined the effect of the TOP2 inhibitor etoposide, which strongly traps TOP2 in the stalled TOP2cc state by preventing DNA ligation after cleavage. We observed a significant increase in the formation of TOP2cc and γH2AX foci in CGNs cultured on glass with etoposide treatment at 50 µM, but not at 1 nM (Extended Data Fig. 4b,c). Although 1 nM etoposide did not induce TOP2cc formation in non-migrated cells, it significantly impaired the clearance of stalled TOP2ccs in CGNs migrated through 3-µm pores (Fig. 2h), indicating that a low dose of etoposide stabilizes mechanically induced TOP2ccs. Consistently, treatment with 1 nM etoposide did not increase γH2AX at 6 h and 12 h of transmigration through 3-µm or 8-µm pores, but strongly prolonged the γH2AX signal for up to 36 h after 3-µm transmigration (Fig. 2i–k). Another TOP2 inhibitor, doxorubicin (1 nM), also sustained the γH2AX signal at 24 h, but not topotecan (300 nM), a TOP1 poison that stabilizes TOP1ccs (Extended Data Fig. 4d–f). Furthermore, inhibition of proteasomal degradation with epoxomicin also strongly extended γH2AX signal at 24 h (Fig. 2k). These findings suggest that nuclear deformation during confined migration covalently traps TOP2β on DNA and blocks DNA religation, forming stalled TOP2ccs that are degraded by proteasome and subsequently processed for DSB repair (Extended Data Fig. 4g).DSBs are repaired through NHEJDSBs in CGNs after constricted migration were mostly depleted by 24 h without causing cell death (Fig. 2b and Extended Data Fig. 3h). Consistently, the abundant DSBs in CGNs disappeared without apparent signs of apoptosis in the cerebellum, suggesting that these DSBs are successfully repaired during development (Extended Data Fig. 5a). After proteasomal degradation of TOP2cc and phosphotyrosyl bond removal, the protein-free DSB ends are repaired by NHEJ29. We therefore examined whether the NHEJ pathway is involved in migration-induced DSB repair. Treatment with SCR7 or NU7441, inhibitors of the key NHEJ components ligase IV (LIG4) and DNA-dependent protein kinase, respectively, disrupted the resolution of γH2AX foci between 12 and 24 h after 3-μm pore migration, but had no apparent effect after 8-µm pore migration. By contrast, inhibition of the homologous recombination pathway by the RAD51 inhibitor B02 had minimal impact on γH2AX focus formation or reduction (Fig. 3a,b and Extended Data Fig. 5b). DNA-dependent protein kinase is a mechanosensitive DDR kinase that has also been implicated in NE tubule formation22. However, NU7441 did not affect NE invagination after Transwell migration, indicating that the DSB repair defect is probably due to impaired NHEJ irrespective of NE invagination (Extended Data Fig. 5c).Fig. 3: DNA damage during neuronal migration is repaired by the NHEJ pathway.a, The effects of DSB repair inhibitors on migration-induced γH2AX foci. Cells were fixed at 24 h after seeding on 3-μm pore filters. b, The percentage of γH2AX-positive CGNs treated with DSB repair inhibitors at 12 h and 24 h in Transwell culture after migration through 3-µm or 8-µm pores. c, Time-dependent changes in the percentage of γH2AX-positive CGNs from control (Neurod1-cre−/−Lig4flox/flox) and Lig4 ND1-cre mice in 3-µm and 8-µm Transwell assays. d, The timing of Neurod1 and Gabra6 expression in developing CGNs (left) and γH2AX focus formation in the cerebellar cortices from control, Lig4ND1-cre and Lig4Gabra6-cre mice (right). e, Quantification of γH2AX foci (relative pixel intensities of γH2AX and DAPI signals) in the IGL. f, Haematoxylin and eosin staining of the cerebellar cortex from control and Lig4ND1-cre mice at 12 months. Statistical analysis was performed using two-way ANOVA with Tukey’s multiple-comparison test (b, c and e); P values are shown. For c, comparisons were made between control and Lig4ND1-cre cells at the same timepoints. Data are mean ± s.d. Scale bars, 3 μm (a), 24 μm (d) and 500 μm (f). The sample sizes are described in the Source data.Source dataTo further investigate the role of the NHEJ pathway, we analysed the effect of conditional deletion of LIG4 in postmitotic CGNs (Neurod1-cre+/−Lig4flox/flox, hereafter Lig4ND1-cre)30. In Transwell assays, LIG4 loss did not affect the percentage of γH2AX-positive cells at 6 h and 12 h after confined and non-confined migration, but significantly suppressed their resolution until 36 h (Fig. 3c). Treatment of LIG4-deficient cells with etoposide (1 nM) or epoxomicin did not show additive effects, implying that TOP2β and the proteasome system act in the same pathway as NHEJ (Extended Data Fig. 5d). In the cerebellar cortex of Lig4ND1-cre mice, in which LIG4 loss occurs from P6, increased accumulation of γH2AX foci was evident in the IGL from P8 onwards and persisted up to 12 months, whereas, in the control mice (Neurod1-cre−/−Lig4flox/flox), the foci had largely disappeared after P15 (Figs. 1b and 3d,e and Extended Data Fig. 5e,f). To verify that these γH2AX foci represent unrepaired DSBs generated during migration, we made another LIG4-deficient mouse line using a Gabra6-cre driver (Lig4Gabra6-cre), in which Lig4 is depleted in postmigratory CGNs in the IGL31 (Extended Data Fig. 5f). Although Lig4 deletion occurred in postmigratory CGNs by P15, γH2AX accumulation was not seen until 3 months and gradually increased with age, probably owing to slowly accumulating unrepaired DSBs generated by other stressors in postmigratory CGNs (Fig. 3d). However, the levels of γH2AX accumulation remained significantly higher throughout life in Lig4ND1-cre mice, in which Lig4 is deleted in CGNs before the onset of migration, only 9–10 days earlier than in Lig4Gabra6-cre mice (Fig. 3e). These results suggest that mechanostress during confined migration is a major trigger of DNA damage in juvenile CGNs, and this damage is rapidly repaired through NHEJ. Notably, the persistent DNA damage caused no obvious morphological abnormalities or cell death in the cerebellum of Lig4ND1-cre mice, as observed by both light and electron microscopy analyses (Fig. 3f and Extended Data Fig. 6). Thus, CGNs can tolerate DSBs generated during and after migration without major impacts on cellular functions.Widespread DSBs in inactive chromatinWe next mapped the positions of DSBs induced by confined migration using END-seq, which detects DSBs genome-wide at base-pair resolution. CGNs were subjected to Transwell migration through 3-µm or 8-µm pores and were collected at 6 h. END-seq did not reveal recurrent break hotspots at particular motifs or gene loci in transmigrated cells (Fig. 4a). Given this lack of site-specific DSBs, we examined broader genomic preferences by classifying END-seq peaks according to seven chromatin categories: active promoters, enhancers, exons, introns, transcriptionally inactive and unlabelled euchromatin, lamina-associated domains (LADs) and heterochromatin not overlapping LADs. These regions were defined on the basis of chromosome accessibility (assay for transposase-accessible chromatin using sequencing, ATAC–seq), histone modifications (H3K4me3 and H3K9me3 chromatin immunoprecipitation–sequencing, ChIP–seq), nuclear lamina association (lamin B1 ChIP–seq) and transcriptional activity (RNA sequencing, RNA-seq) from unmigrated control CGNs. We then profiled the landscape of DSBs that occurred in CGNs after confined or non-confined migration. DSBs generated specifically by confined migration were depleted from active promoters and instead occurred more frequently in heterochromatin, with the largest relative enrichment found at LADs (LAD fold change (FC) = 2.42, non-LAD FC = 1.84; Fig. 4b). Confined migration-induced DSBs tended to overlap more frequently with repetitive DNA, particularly long interspersed nuclear element retrotransposons (Fig. 4c). We also analysed END-seq signal over all transcription start sites (TSSs) and gene bodies. Confined migration caused little or no change in DSB levels within gene bodies, regardless of transcriptional activities based on RNA-seq, and neither altered the DSB signal at sites bound by both CTCF and RAD21, which are commonly associated with chromatin loop anchors (Extended Data Fig. 7a–c). Similarly, no significant difference was observed in long genes, which have been associated with neuronal physiology and connectivity28 (Extended Data Fig. 7d). We also mapped the unrepaired DSBs in the NHEJ-deficient condition in vivo using cerebellar tissues from P15 control and Lig4ND1-cre mice. The DSBs in Lig4ND1-cre mice also lacked site specificity and were enriched in chromatin categories classified as inactive chromatin and retrotransposons (Extended Data Fig. 7e,f). No accumulation was observed in the promoters or gene bodies of transcribed genes (Extended Data Fig. 7e,g,h). These results suggest that DSBs generated during confined migration are topologically and functionally different from the typical TOP2β hotspots, which include regulatory elements and chromatin loop anchors32,33,34.Fig. 4: Persistent DSBs in postmigratory neurons lead to transcriptional changes.a, Genomic profile showing an example of END-seq peaks in CGNs with or without confined migration in a site located at chromosome (chr.) 18: 65428139–65495592. From top to bottom: ATAC–seq, ChIP–seq (H3K4me3, CTCF and RAD21), END-seq profiles (3-µm and 8-µm migration) and RNA-seq. The region indicated by a dashed box is magnified on the right. b,c, Comparison of the relative frequency of specific END-seq peaks across defined genomic regions (b) and in repetitive elements (c) (Methods). The bars represent the average and the circles indicate individual biological replicates (two biological replicates per condition). Comparisons in which the 95% bootstrap confidence intervals excluded 0 were considered to be significant (asterisk). d, Transcriptional changes between the 2 month control and Lig4ND1-cre cerebella. n = 4 (control) and n = 3 (Lig4ND1-cre) mice. The coloured dots indicate significant DEGs (P < 0.05 and log2[FC] of >1 or <−1). Statistical analysis was performed using the DESeq2 two-tailed Wald test. e, DEGs related to neuronal function and development, stress and immune response, based on RPKM values that were normalized by row-wise z-score scaling. Each row represents a gene and each column represents a sample. The colours indicate the relative expression within the same gene across samples (red, above mean RPKM; blue, below mean RPKM). f, Upregulated (top) and downregulated (bottom) pathways detected by Gene Ontology (GO) enrichment analysis using DEGs. The horizontal axis represents the percentage (%), and the vertical axis lists the GO categories. The colour scale represents different −log10[P] thresholds, and the dot size corresponds to the number of genes associated with each pathway. Statistical analysis was performed using the one-tailed Fisher’s exact test. g, Immunostaining of MYO15A and p27Kip1 (left) and CD86 and IBA1 (right) in the cerebellar cortex of control and Lig4ND1-cre mice at 3 months. Similar results were obtained from three mice from independent litters. Scale bars, 24 μm. LINE, long interspersed nuclear element; LTR, long terminal repeat; SINE, short interspersed nuclear element.Source dataIn an attempt to clarify the long-term influence of unrepaired DSBs in LIG4-deficient cerebellum, we performed unpaired bulk RNA-seq analysis of cerebellar lysates from control and Lig4ND1-cre mice at 2 months. Although the overall differences between control and Lig4ND1-cre mice were relatively modest (that is, few genes showed log2-transformed FC of >2.5), we identified 336 differentially expressed genes (DEGs) among 50,531 genes (Fig. 4d). Genes related to neuronal differentiation and synaptic function showed significant downregulation, while those related to stress response and immune response, which are primarily expressed in immune cells and microglia, were upregulated (Fig. 4e,f and Extended Data Fig. 8a). For validation, we performed immunofluorescence analysis of the genes that showed expression changes in the analysis and confirmed downregulation of MYO15A in CGNs and upregulation of CD86 in microglia in Lig4ND1-cre cerebellum (Fig. 4g). We did not observe microglial activation, which is an indicator of neuroinflammation. Comparison with public datasets showed that these gene expression changes were not typical of normal cerebellar ageing35,36,37 (Extended Data Fig. 8b–d). However, there was a significant overlap between the upregulated gene cluster in Lig4ND1-cre and genes upregulated in cortical neurons bearing γH2AX foci in the early phase of the CKp25 mouse model of neurodegeneration, suggesting a link to DNA damage in neurodegenerative conditions38 (Extended Data Fig. 8e).DSB repair defects cause mild brain defectsAlthough Lig4ND1-cre mice appeared to develop normally, they gradually exhibited mild motor discoordination. With age, adult Lig4ND1-cre mice were observed to crawl from 12 months onward (Fig. 5a). In a footprint test, the average width between the right and left hindlimb gaits was increased, and the stride length of hindlimbs became shorter and more irregular in Lig4ND1-cre mice (Fig. 5b,c). In a balance-beam test, Lig4ND1-cre mice exhibited increased hindlimb slips when crossing a narrow beam from 3 months onward, which worsened over time. By contrast, Lig4Gabra6-cre mice performed similarly to control mice at 3 months but progressively developed deficits with age (Fig. 5d). Lig4ND1-cre mice displayed a limited number of γH2AX foci in multiple areas which may affect motor coordination, including the cortex, thalamus and subthalamic nucleus from 3 months (Extended Data Fig. 9a,b). However, Lig4Gabra6-cre mice gradually developed motor deficits without showing γH2AX accumulation outside the cerebellar system. The cerebellar IGL was the only area in the brain where DSB accumulation was high in both Lig4ND1-cre and Lig4Gabra6-cre mice, suggesting that the altered behaviours are caused by CGN dysfunction (Extended Data Fig. 9a,b). Performance on a rotating rod was comparable between control and LIG4-deficient mice, suggesting that motor learning is not affected by sustained DSBs (Fig. 5e). Body weight and grip strength remained unaffected in all groups, confirming that balance-beam deficits were not due to muscle weakness (Extended Data Fig. 9c,d). These findings suggest that persistent DNA damage in LIG4-deficient CGNs leads to mild but progressive motor discoordination.Fig. 5: Progressive motor deficits in mice with persistent DSBs in CGNs.a, Representative walking posture (top) and footprints (bottom) of control (left) and Lig4ND1-cre (right) mice at 12 months. The gait patterns of forepaws (black) and hindpaws (red) are shown. See also Supplementary Video 6. b, Quantitative comparison of walking behaviour. Lig4ND1-cre mice showed a greater hind-base width, shorter stride length and greater forepaw and hindpaw distance. c, The stride length distribution of control and Lig4ND1-cre mice. d, Balance on raised round beams at three ages. The number of hindlimb slips was recorded on three independent trials. See also Supplementary Video 7. e, Quantification of the time spent running on a rotarod over three consecutive days at 3 and 6 months. Comparisons were made between control and Lig4ND1-cre mice at the same age. For b and d, the box plots show the median (centre line), 25th to 75th percentile range (box limits), and the whiskers represent the full data range. For e, data are mean ± s.d. Statistical analysis was performed using two-tailed Welch’s t-tests (b and e) and Kruskal–Wallis tests with Dunn’s multiple-comparison test (d); P values are shown. Sample sizes are described in the Source data.Source dataDiscussionHere we demonstrate that newly born neurons inevitably undergo DNA damage by mechanostress during migration. Unlike multiple cancer cell lines, which undergo NE rupture and allow nuclear entry of cytoplasmic nucleases5,6, cerebellar neurons rarely experience NE rupture and instead form DSBs by stalled TOP2cc that are subsequently repaired through NHEJ during normal brain development.The reason why NE rupture is rare in neurons remains unclear. NE rupture is thought to initiate at gaps in the nuclear lamina meshwork, either due to LMNA loss or after its disassembly through ATR-dependent phosphorylation in response to mechanical NE deformation39. By contrast, in the NE of juvenile neurons, LMNA is replaced by lamin B receptor, and NE integrity may therefore not be affected by LMNA dynamics during nuclear deformation40. Here we did not find evidence supporting a role for NE deformation in DSB repair. However, the complex interplay between NE dynamics and DSB formation merits further investigation.Extensive studies have demonstrated that TOP2 relaxes torsional stress in DNA by catalysing transient DSBs in front of the replication fork32 or of the transcription machineries33 and at the CTCF/cohesin loop anchors34. Notably, nuclear deformation in some cancer cells has been shown to induce DSBs at replication forks independently of NE rupture, implying that TOP2 may be involved in this mechanostress-induced DSB26. By contrast, DSBs in migrating neurons were not found at these TOP2 target sites, and were instead found in transcriptionally inactive chromatin and retrotransposons. TOP2α breaks during replication have been shown to be enriched in heterochromatin and repetitive sequences including long terminal repeats and long interspersed nuclear elements, supporting the idea that these regions could be native TOP2 targets for decatenation or resolving topological stress41. The regulatory mechanism of TOP2 targeting is yet to be clarified, but topological changes in chromatin by bending or torsion are thought to affect the steric accessibility and activity of TOP242. Large nuclear deformations during confined migration may lead to acute strain accumulation in multiple genome regions, where TOP2 binds and alleviates excessive tensile and torsional stress on chromatin during confined migration. It is also known that mechanical distortion of chromatin could impair TOP2’s ability to religate DNA strands after cleavage43, leading to increased formation of TOP2cc and DNA damage.Genome sequencing revealed that DSBs are not site specific but are significantly depleted in active gene regulatory elements. Lig4ND1-cre mice showed only modest changes in gene expression that are unlikely to be a direct consequence of structural alterations in transcription regulatory regions by DNA breaks, given that the DSB sites are not closely associated with these genes. It has been suggested that persistent DSBs induce pro-inflammatory signals in neurons, which in turn activate immune response genes in nearby microglia, in the CKp25 mouse model of neurodegeneration38. Although the transcription changes are much smaller and no clear signs of neuroinflammation were observed in our Lig4ND1-cre mice, there was significant overlap in the upregulated gene clusters between CKp25 mice and Lig4ND1-cre mice. We surmise that persistent DSBs in neurons lead to mild inflammatory conditions in brain tissue, which in turn cause the downregulation of neuronal genes in Lig4ND1-cre mice. The progressive mild motor discoordination without apparent cell death or anatomical defects seen in Lig4ND1-cre mice might be a consequence of these modest gene expression changes. Our results suggest that—in contrast to mitotic DNA damage, which can severely alter transcription and even lead to cell death if left unrepaired44—migration-induced DNA damage in postmitotic CGNs spares critical gene loci, minimizing the overall impact on neuronal function.We identified NHEJ as the primary repair mechanism for migration-induced DSBs, involving direct DNA end ligation that can cause small insertions and deletions45,46. Robust DSBs during migration may therefore cause somatic mosaicism, which is abundant in the brain and may link to neuronal individuality as well as neurodevelopmental and neurodegenerative diseases11,47,48. Note also that progressive cerebellar motor deficits are a common symptom in patients with genome-instability syndromes caused by defective DNA repair pathways12,49,50. The vulnerability of neurons to DNA repair defects has been attributed to frequent DNA damage caused by high oxidative metabolism and transcriptional activity. However, it is unclear why the cerebellum is particularly susceptible to late-onset impairments. Whether the DSBs that occur during neuronal migration are related to the pathogenesis of genome instability syndromes remains unclear, given the absence of features such as severe neurodegeneration in mice. Nonetheless, our data suggest that mechanostress during neuronal migration represents one of the major sources of endogenous DNA lesions in the cerebellum, which may be involved in the pathogenesis of diseases characterized by cerebellar dysfunction.MethodsLists of the antibodies and reagents used are provided in Supplementary Tables 1 and 2.PlasmidsThe pCAG-mScarlet plasmid was generated using the mScarlet sequence obtained from Addgene (85042; a gift from D. Gadella). To generate the pCAG-53BP1-mNeonGreen construct, mouse 53BP1 cDNA was amplified from a mouse brain cDNA library and inserted into the pENTR1A vector. In parallel, the Gateway cassette from pDest-eGFP-N1 was inserted into the EcoRI site of pmNeonGreen using In-Fusion Cloning to generate pDest-mNeonGreen. The 53BP1 cDNA in pENTR1A was recombined into pCAG-Dest-mNeonGreen using LR Clonase II Enzyme Mix (Invitrogen, 11791020) to produce the final pCAG-53BP1-mNeonGreen construct. The pTRIP-CMV-GFP-Flag-cGAS plasmid was obtained from Addgene (86674; a gift from N. Manel). mCherry-KASH1 was constructed as previously decribed13. The pAAV-Neurod1-GFP plasmid was constructed by replacing the CAG promoter in pAAV-CAG-EGFP51 with the Neurod1 promoter, which was cloned from the cDNA of CGNs isolated from P6 ICR mice.AnimalsAll animal experiments were approved by the Animal Experiment Committee of Kyoto University (KUIAS 1-9) and conducted in accordance with the guidelines of the National Centre for the Replacement, Refinement and Reduction of Animals in Research. For some in vitro experiments, timed-pregnant C57BL/6J and ICR mice were purchased from Japan SLC. We generated conditional deletion mice by breeding Lig4flox/flox mice30 with Neurod1-cre (Tg (Neurod1-cre) RZ24Gsat/Mmucd, MMRRC_036320-UCD) or Gabra6-cre (B6.129P2-Gabra6tm2(cre)Wwis/Mmucd, MMRRC_015968-UCD) mice from MMRRC at UC Davis. The Neurod1-GFP (Tg (Neurod1-eGFP) CR99Gsat/Mmucd, MMRRC_000329-UCD) mouse strain was also obtained from MMRRC. These lines were maintained on a predominantly C57BL/6J mixed background, with mice of both sexes used for experiments. Animals were housed under a 12 h–12 h light–dark cycle at 23 ± 3 °C and 50% humidity.GenotypingTail or nail clippings were digested in 50 mM NaOH at 95 °C for 10 min. After neutralizing by adding 1 M Tris-HCl (pH 8.0), samples were centrifuged at 4 °C for 15 min. The supernatant was subjected to PCR using the following primers: Lig4flox allele, 5′-GAGCTGCAACAGTTTGTGAAGTTTGTGAGGA-3′ and 5′-GTGTTGGTCAGGACCAGAAGGAAAGCA-3′; Neurod1-cre allele, 5′-TAGGATTAGGGAGAGGGAGCTGAA-3′ and 5′-CGGCAAACGGACAGAAGC-3′; Neurod1-GFP allele, 5′-TAGGATTAGGGAGAGGGAGCTGAA-3′ and 5′-Gabra6-cre allele, 5′-GATCTCCGGTATTGAAACTCCAGC-3′ and 5′-GCTAAACAT GCTTCATCGTCGG-3′.In vivo and in utero electroporation and brain slice imagingOrganotypic cerebellar slice culture was performed as previously described52. Plasmid electroporation into P5 cerebella was conducted using an electroporator (CUY21, Nepagene). A total of six square-wave pulses (70 mV, 50 ms duration, 150 ms intervals) were applied. Cerebella were collected at P7 and embedded in 3.5% low-melting-point agarose (Nacalai, 01651-76), and coronally sliced into 300-μm-thick sections using a vibratome (NLS-AT, Dosaka EM). The slices were placed onto Millicell-CM membrane inserts (Millipore, PICM0RG50) and embedded in a collagen gel matrix (FUJIFILM Wako, 631-00651). The slices were maintained in medium composed of 60% basal medium Eagle (BME, Sigma-Aldrich, B9638), 25% Earle’s balanced salt solution (Sigma-Aldrich, E7510), 15% heat-inactivated horse serum (HS, Invitrogen, 26050070), 3 mM l-glutamine (Gibco, 35050-061), 1 mM sodium pyruvate (Sigma-Aldrich, S8636), 5.6 g l−1 glucose (Sigma-Aldrich, G7021), 1.8 g l−1 sodium bicarbonate (Sigma-Aldrich, S5761), and N-2 supplement (Invitrogen, 17502001). In utero electroporation into cerebral cortex was performed at E12. Brains were dissected at E14 and coronally sliced using a surgical knife53. Slices were mounted in a collagen gel matrix (FUJIFILM Wako, 631-00651) in DMEM/F12 (Sigma-Aldrich, D2906) supplemented with 5% HS, 5% FBS (FBS, BioWest, S1400-500), penicillin–streptomycin (Invitrogen, 15140122), and N-2 supplement. The slices were placed in a stage-top incubator at 37 °C with humidified 85% O2/5% CO2 gas flow, mounted onto an upright microscope (BX61WI, Olympus)54. Time-lapse imaging was performed using a laser-scanning confocal microscope (FV1000, Olympus) equipped with a GaAsP detector and a ×40 water-immersion objective lens (NA 0.8). Images were acquired every 5 or 10 min over 6 h.Live-cell imaging on microfabricated constriction substratesThe microfabricated PDMS substrate were made as previously described18. CGNs from P6 mouse cerebella were dissociated using the Neuron Dissociation Kit (Wako Pure Chemical Industries, 291-78001). For transfection, Nepa21-S (Nepagene) was used according to the manufacture’s instruction with a total of 6 μg plasmid DNA. After electroporation, cells were recovered in non-coated dishes for 1 h in 10% HS/BME, and then seeded onto microfabricated PDMS substrates coated with laminin (Sigma-Aldrich, L2020) and incubated in culture medium BME with 26.4 mM glucose, 25 mM sodium bicarbonate, 1% BSA (Sigma-Aldrich, A3156), 1× N-2 supplement}. HeLa cells were maintained at around 90% confluence in Dulbecco’s modified Eagle’s medium (DMEM, Invitrogen, 11965092) supplemented with 10% FBS and penicillin–streptomycin on surface-treated culture dishes (Corning, 300-035). HeLa cells were transfected using Lipofectamine 2000 (Thermo Fisher Scientific, 11668019) 1 day after passaging and transferred to microfabricated substrates. Time-lapse imaging was performed using the CV1000 system (Yokogawa) with a ×40 (NA1.3) or a ×100 (NA1.4) oil-immersion objective lens at 37 °C in a humidified chamber with 5% CO2. Images were captured at 5-min intervals.Transwell assayDissociated CGNs were seeded at 1.7 × 10⁵ cells per cm2 onto polycarbonate membranes with pore sizes of 0.4 μm, 3 μm or 8 μm (Corning, 3401, 3402, 3414, 3412, 3422) coated with poly-d-lysine (Sigma-Aldrich, P6407) and laminin. Drugs or DMSO (Nacalai, 13445-74) were added to both sides of the membrane 2 h after seeding, except for nocodazole, which was added to the bottom side 2 h after seeding. Cells were allowed to transmigrate for the indicated durations and then either fixed or collected for further analyses. For Transwell assays with transfected CGNs, cells were first plated onto poly-d-lysine- and laminin-coated 2.5 cm culture dishes (Corning) in culture medium. At 2.5 h (mCherry-KASH1) or 24 h (all other constructs) after plating, cells were washed with prewarmed PBS and dissociated using Accutase (Nacalai, 12679-54) at 37 °C for 5–10 min. Cells were collected by centrifugation, resuspended in a fresh culture medium and then reseeded onto Transwell inserts coated with poly-d-lysine and laminin and incubated for the indicated durations. For HeLa cells, transfected cells were suspended in DMEM and transferred to 1.12 cm2 Transwell inserts that were preincubated with the medium at 1 × 10⁵ cells per well. DMEM supplemented with 10% FBS was added into the bottom chamber to promote migration.Immunofluorescence analysis of Transwell culturesCells seeded on Transwell inserts were fixed with 4% paraformaldehyde (PFA, Nacalai, 02890-45) and permeabilized with 0.1% Triton X-100 (Nacalai, 35501-02) in PBS at room temperature. After blocking in 5% skimmed milk (Becton Dickinson, 232100), cells were incubated with primary antibodies diluted in blocking buffer overnight at 4 °C. After thorough washes, cells were incubated with Alexa-Fluor-conjugated secondary antibodies for 8–10 h at 4 °C, followed by nuclear counterstaining with 4′−6-diamidino-2-phenylindole (DAPI; FUJIFILM Wako, 340-07971) (5 μg ml−1). For Ku70 staining, cells were washed with PBS and incubated with CSK + Rbuffer (3 mM MgCl2, 10 mM PIPES, pH 7.0, 100 mM NaCl, 300 mM sucrose, 0.7% Triton X-100 and 0.3 mg ml−1 RNase) at room temperature for 3 min for pre-extraction. Cells were then washed with PBS and fixed as described above55. The TUNEL assay was performed according to the manufacturer’s instructions for the Click-iT TUNEL Alexa Fluor Imaging Assay kit (Thermo Fisher Scientific, C10245). The membranes were then mounted using ProLong Gold Antifade Mountant (Invitrogen, P36961). Imaging was performed using a laser-scanning confocal microscope (FV4000-BX61, Olympus) equipped with CellSens FV software (v.3.2.1.85) through ×20 (0.5 NA), ×40 (0.95 NA) objectives or a ×100 (1.4 NA) oil-immersion objective, or a lattice structured illumination (SIM) microscope (Elyra 7, Zeiss) through a ×63 (1.40 NA) oil-immersion objective.Immunofluorescence and H&E staining of brain tissuesMice were anaesthetized with isoflurane (FUJIFILM Wako, 099-06571) and perfused with 4% PFA in phosphate buffer (PB). Brains were dissected immediately and post-fixed in 4% PFA/PB for 4–6 h (for P15 or younger mice) or overnight (for P30 or older mice) at 4 °C. Brains were washed in PBS then dehydrated in 30% sucrose (Nacalai, 30404-45) in PBS overnight at 4 °C and were embedded in OCT compound (Sakura Finetek, 4583). Sagittal sections at a thickness of 15 μm were prepared using a cryostat (Leica, CM1950). The sections were incubated with HistoVT One (Nacalai, 06380-05) at 70 °C for 20 min for antigen retrieval. After permeabilization with 0.5% Triton X-100/PBS and blocking, immunofluorescence was done as described above. For γH2AX immunostaining, all solutions, including blocking buffer and antibody diluents, were prepared using Tris-buffered saline (TBS) instead of PBS. After staining with DAPI (10 μg ml−1), the sections were mounted using Fluoromount-G (Cosmo Bio, SBA-0100-01-25). Imaging was performed using the confocal and SIM microscope systems described above. For haematoxylin and eosin (H&E) staining, anaesthetized mice were perfused with PBS followed by 10% formaldehyde neutral buffer solution (Nacalai, 37152-51). The brains were post-fixed in the same fixative for 1 week at 4 °C. Fixed tissues were processed for paraffin embedding using standard dehydration and clearing protocols, then sectioned at a thickness of 5 μm and subjected to H&E staining. Images were acquired using an upright optical microscope (DM5000B, Leica) equipped with 2.5× (NA 0.07) and 10× (NA 0.3) objective lenses, an AdvanCam-U3X camera (Advan Vision) and AdvanView imaging software.Isolation and quantification of the TOP2ccDissociated CGNs were seeded onto culture dishes or Transwell inserts of the indicated pore sizes. After incubation for the indicated times, cells either on the bottom of 3 µm or top of 0.4 µm membranes were washed with PBS and collected by incubating with Accutase at 37 °C for 15 min. TOP2cc isolation was performed as previously described with a few modifications56. In brief, cells were lysed sequentially in sucrose-based buffers to isolate chromatin. The chromatin precipitate was washed ten times to remove non-covalently bound TOP2β, subsequently dissolved in 6 M guanidinium chloride (Fuji Film, 074-05005). After DNA quantification, 1 µg of DNA was loaded onto a density-gradient cushion of caesium chloride (Nacalai, 07807-11) and subjected to ultracentrifugation at 100,000g for 16 h at room temperature. Then, 1 ml aliquots were collected from the top to the bottom of the gradient. For slot blot analysis, 100 µl of each aliquot was loaded to a PVDF membrane pretreated with methanol using the Bio-Dot apparatus (Bio-Rad, 31460). After washing with 0.2 M PB, the membrane was probed with an anti-TOP2β antibody, followed by a HRP-conjugated anti-rabbit secondary antibody. Image Gauge software (Fujifilm) was used to detect TOP2β signals. The raw mean intensity within a defined region of the TOP2cc fractions (third and subsequent dots from the left) was quantified. The background signal was subtracted, and the resulting values were plotted as the base-2 logarithm of the intensity plus one (log2[intensity + 1]) to quantify TOP2cc dimers.TOP1cc detection by DUST assayCGNs were seeded on culture dishes and incubated for 30 min in the presence or absence of 300 nM topotecan. TOP1ccs were detected using the detection of ubiquitylated and SUMOylated TOP-DNA complexes (DUST) assay as previously described57. After treatment, cells were washed with PBS and lysed directly in 800 µl DNAzol reagent (Invitrogen) supplemented with 1× Complete EDTA-free protease inhibitor cocktail (Roche) and 1 mM dithiothreitol. DNA was precipitated by the addition of 400 µl of 200-proof ethanol, collected by centrifugation, washed with 75% ethanol and resuspended in TE buffer. The samples were incubated at 65 °C for 15 min and sonicated twice for 15 s at 20% amplitude using an Ultrasonic Processor (Cole-Parmer). After centrifugation at 15,000 rpm for 5 min at 4 °C, the supernatants were collected and the DNA concentration was determined. Next, 5 µg of DNA from each sample were digested with 2,000 U of micrococcal nuclease (2,000 U µl−1; New England Biolabs) in micrococcal nuclease reaction buffer for 30 min at 37 °C. The digested samples were run on 4–12% Bis-Tris gels (NuPAGE, Invitrogen) and wet-transferred onto nitrocellulose membranes. TOP1cc was detected using an anti-TOP1 antibody, followed by HRP-conjugated anti-rabbit secondary antibody and chemiluminescence detection. As a migration control, 3 µg of whole-cell extract from untreated CGNs was loaded.γH2AX western blot analysisCGNs were subjected to Transwell migration through inserts with 3-µm or 8-µm pore size for 12 or 24 h. After migration, inserts were washed with PBS and whole-cell extracts (WCEs) were prepared by excising the insert membranes and resuspending them directly in Laemmli lysis buffer containing 4% SDS, 20% glycerol, 125 mM Tris-HCl (pH 7.4), 50 mM β-glycerophosphate disodium salt, 2 mM PMSF and 1× Complete Mini EDTA-free protease inhibitor cocktail (Roche). The samples were boiled for 5 min, cooled to room temperature on ice, centrifuged at 13,000 rpm for 10 min and the supernatant was then sonicated twice for 15 s at 20% amplitude using an Ultrasonic Processor (Cole-Parmer), and then centrifuged at 13,000 rpm for 10 min. Supernatants were collected and protein concentration was determined using the Pierce BCA Protein Assay Kit (Thermo Fisher Scientific). Then, 4 µg of total protein per sample was run on 12% Bis-Tris gels (NuPAGE, Invitrogen) and wet-transferred onto PVDF membranes. Membranes were blocked for 1 h at room temperature in TBST containing 5% ECL Prime Blocking Reagent (Cytiva), then incubated for 2 h at room temperature with primary antibodies against γH2AX and α-tubulin diluted in blocking buffer. The membranes were washed three times with TBS containing 1% Tween-20 and incubated for 1 h at room temperature with HRP-conjugated secondary antibodies. Signals were detected by chemiluminescence and imaged using an ImageQuant LAS 4000 system. Band intensities were quantified by densitometry using ImageJ software (NIH). For each blot, background signal was subtracted and the γH2AX signal intensity was normalized to the corresponding α-tubulin band from the same lane.AAV injectionAAVs (109–1010 plaque-forming units) were produced using AVB Sepharose High Performance (GE Healthcare, 28-4112-01) according to the manufacturer’s instructions. In brief, transfected HEK293T cells were collected, then subjected to freeze–thaw cycles (three times using liquid nitrogen and a 37 °C water bath). The cell lysates were treated with 5–10 µl benzonase, incubated at room temperature for 5 min and centrifuged. The supernatant was filtered before bead binding. 400 µl AVB beads were washed three times with wash buffer (20 mM Tris-Cl pH 8.0, 250 mM NaCl, 10 mM MgCl2) and incubated with the viral lysates at room temperature for 15 min. The beads were then washed three times and transferred to the Mobicol Classic (MoBiTec, M1002) column. Bound AAVs were eluted acidic elution buffer (250 mM NaCl, 10 mM MgCl2, pH 3.0 adjusted with HCl) and immediately neutralized with 1 M Tris-HCl (pH 8.0). Eluted virus was concentrated to 100–200 μl using Amicon Ultra-4 Ultracel 50 K centrifugal filters (Millipore, UFC805024).Mice aged 12 months were anaesthetized with an intraperitoneal injection (0.1 ml per 10 g body weight) of a mixed anaesthetic solution containing 0.03 mg ml−1 medetomidine (Kyoritsu Seiyaku), 0.4 mg ml−1 midazolam (Astellas Pharma) and 0.5 mg ml−1 butorphanol (Meiji Seika Pharma). Then, 1 µl of virus was injected over 1 min at a stereotaxic location 6.84 mm posterior to bregma, along the midline and 1.5 mm below the dural surface. After injection, the incision was sutured and the mice received an intraperitoneal injection of 0.3 mg ml−1 atipamezole (Kyoritsu Seiyaku) for anaesthesia reversal. Animals were kept in a warm (37 °C) recovery cage until fully awake. Then, 1 week after injection, mice were perfusion-fixed. Brains were post-fixed, washed in PBS, and embedded in 4% low-melting-point agarose. Coronal sections of 100 µm thickness were prepared using a vibratome. Immunostaining for GFP and VGLUT1/2 was performed as described. Images were acquired using a laser-scanning microscope (Andor Dragonfly 500) equipped with a ×100 oil-immersion objective (NA 1.49) and Fusion software (v.2.3.0.50).Electron microscopyBrains fixed in 4% PFA/PB were washed in PB followed by distilled water. First post-fixation was carried out on ice using 2% osmium tetroxide (OsO4) with 1.5% potassium ferrocyanide for 2 h. After rinsing, second post-fixation was performed at room temperature using 1% OsO4 in PB for 2 h. Tissues were then dehydrated through graded ethanol (50–100%), cleared in propylene oxide and infiltrated with EPON resin through graded propylene oxide: EPON mixtures, followed by overnight incubation in 100% EPON. Polymerization was conducted at 45 °C for one night and 60 °C for two nights. Semi-thin sections (700 nm–1 μm) were prepared for light microscopy screening and ultrathin sections (60–80 nm) were used for electron microscopy. The sections were stained with uranyl acetate and lead citrate, and images were captured using a transmission electron microscope (Hitachi, H-7650 or JEOL, JEM-1400Flash).RNA-seqTotal RNA was extracted from dissociated CGNs from WT P6 ICR mice cultured for 8 h on normal dishes and Transwell inserts; control and Lig4ND1-cre cerebella at 2 months using the miRNeasy Mini Kit (Qiagen, 217004) and assessed for quality using a BioAnalyzer (Agilent Technologies). The libraries were prepared using the TruSeq Stranded mRNA Library Prep Kit (Illumina) and sequenced on the NovaSeq 6000 system (Illumina) with 100 bp single-end reads. Raw Fastq files were trimmed and aligned to the mouse reference genome (mm10) using STAR (v.2.7.11a)58. The mapped reads were assembled with FeatureCounts (v.2.0.8)59, and differential gene expression was analysed using DESeq2 (v.2.11.40.8)60 based on read counts. GO analysis was performed using upregulated and downregulated DEGs (P < 0.05, determined by DESeq2) using the DAVID functional annotation tool61,62.For public data analysis, raw sequence files were obtained from the BioProject database (PRJNA281127)35 and from the GEO database (GSE212336 (ref. 36), GSE221124 (ref. 37) and GSE174265 (ref. 38)). The reads were mapped to mouse genome (mm10) using hisat2 (v.2.1.0)63, and mapped reads were assembled with FeatureCounts (v.2.0.0).scRNA-seq data analysis of cerebellar cell typesA publicly available Seurat object containing single-cell RNA-seq (scRNA-seq) data from cerebellar tissue (24,409 genes across 611,034 cells) was obtained from a previously published study (https://singlecell.broadinstitute.org/single_cell/study/SCP795/a-transcriptomic-atlas-of-the-mouse-cerebellum). The object was loaded into R (v.4.1.2) and was updated from v.2.X to v.3.X using the UpdateSeuratObject function to ensure compatibility with our Seurat version (v.4.1.0). No additional quality-control or filtering steps were applied beyond those performed in the original study. Raw counts were log-normalized with a scaling factor of 10,000. The dataset was subset into 17 distinct cell type clusters, including macrophages, microglia, astrocytes, Bergmann glia, fibroblasts, endothelial mural and stalk cells, ependymal cells, oligodendrocyte precursor cells, oligodendrocytes and neuronal populations (granule cells, Purkinje cells, Golgi cells, molecular layer interneurons 1 and 2, Purkinje layer interneurons and unipolar brush cells). To optimize computational efficiency for dot plot generation, cells were downsampled to a maximum of 5,000 cells per cluster using a random seed, resulting in 57,833 total cells. Gene expression patterns were visualized using custom dot plots generated with ggplot2, where average normalized expression values were calculated using the AverageExpression function from the normalized RNA assay slot, and percent expression was computed as the fraction of cells within each identity with expression greater than zero.ChIP–seqDissociated CGNs cultured on poly-d-lysine and laminin-coated dishes (Corning) were collected with Accutase as described above. For tissue preparation, cerebella were dissected from P15 mice. Nuclei were isolated according to a previously reported protocol64. The nucleus pellets were resuspended and filtered through a 30-μm cell strainer (Miltenyi Biotec, 130-098-458) into prechilled tubes. ChIP for H3K4me1, H3K27ac, H3K4me3, H3K9me3 and lamin B1 was performed according to previously published methods65. In brief, isolated nuclei or cell pellets were resuspended in prewarmed medium and fixed with 1% formaldehyde (Sigma-Aldrich, F1635) at 37 °C for 10 min. Fixation was quenched by adding 1 M glycine/PBS to a final concentration of 125 mM. Cells were washed twice with cold PBS. For lysis, fixed cell pellets were resuspended in cold RIPA buffer (10 mM Tris-HCl pH 7.5, 1 mM EDTA, 0.1% SDS, 0.1% sodium deoxycholate, 1% Triton X-100) supplemented with protease inhibitors (Thermo Fisher Scientific, 78442). Chromatin was sheared using a Covaris S220 sonicator (20% duty cycle, 175 peak powers, 200 cycles per burst) for 30 min at 4 °C. Lysates were cleared by centrifugation and precleared with Dynabeads Protein A (Invitrogen, DB10002) for 30 min at 4 °C. Antibodies (10 μg) were conjugated to prewashed Dynabeads in PBS for 10 min at room temperature, washed and incubated with chromatin overnight at 4 °C with rotation. Beads were then sequentially washed: twice with RIPA buffer, twice with RIPA + 0.3 M NaCl, twice with LiCl buffer (0.25 M LiCl, 0.5% Igepal-630, 0.5% sodium deoxycholate), once with TE + 0.2% Triton X-100 and once with TE. Crosslinks were reversed by incubation at 65 °C for over 4 h in 0.3% SDS and 1 mg ml−1 proteinase K (Nacalai, 15679-06). DNA was purified and eluted in 10 mM Tris-HCl. DNA obtained from ChIP was used to construct sequencing libraries using the KAPA HyperPrep Kit (KAPA Biosystems). Libraries were sequenced on the NextSeq 500 platform (Illumina) using 75 bp single-end reads.ATAC–seqDissociated CGNs cultured on poly-d-lysine- and laminin-coated dishes (Corning) were collected with Accutase as described above. Cells were resuspended in ice-cold lysis buffer (10 mM Tris-HCl pH 7.4, 10 mM NaCl, 3 mM MgCl2, 0.1% IGEPAL CA-630) and centrifuged again under the same conditions. The supernatant was removed. For transposition, 2× Tagmentation buffer (Diagenode, C01019043) and Tagmetases (Diagenode, C01070012-10) were diluted in water to make reaction mixture. The reaction mixture was then added to cell pellet and incubated at 37 °C for 30 min. DNA was purified using the Qiagen PCR Purification Kit (QIAGEN, 28104) and eluted in elution buffer. Purified ATAC DNA was used for library amplification using the Q5 Hot Start High-Fidelity 2× Master Mix (NEB, M0494S). The libraries were sequenced on the NextSeq 500 platform (Illumina) using 75 bp single-end reads.END-seqDissociated CGNs were seeded on 3-μm or 8-µm Transwell inserts and incubated for 6 h in the presence of palbociclib (5 µM). Cells were collected from the bottom side of the Transwell inserts with Accutase. For tissue samples, nuclei were isolated from P15 control and Lig4ND1-cre cerebella as described above. Isolated nuclei or cells were embedded in agarose plugs and END-seq was performed as previously described34. Agarose plugs were treated with proteinase K for 1 h at 50 °C and then for 7 h at 37 °C. Plugs were washed in wash buffer 10 mM Tris-HCl pH 8.0, 50 mM EDTA) and in TE (10 mM Tris-HCl pH 8.0, 1 mM EDTA) followed by RNase A treatment for 1 h at 37 °C. Inside the plugs, DNA ends were blunted for 1 h at 37 °C with exonuclease VII followed by exonuclease T (NEB) for 1 h at 25 °C to detect TOP2 breaks. After blunting, A-tailing was performed, followed by biotinylated END-seq hairpin adaptor 1 ligation using NEB Quick Ligase. The agarose plugs were melted and dialysed and DNA was sonicated using Covaris S220 sonicator for 4 min at 10% duty cycle, peak incident power 175, 200 cycles per burst, at 4 °C. DNA was ethanol precipitated and dissolved in 80 μl TE buffer. Biotinylated DNA was isolated using MyOne Streptavidin C1 Beads (Thermo Fisher Scientific, 650–01), followed by end repair (dNTPs, T4 polymerase (NEB), Klenow (NEB), T4 PNK) and dA-tailing (Klenow exo- (NEB), dATP). The second end was ligated to END-seq hairpin adaptor 2 using NEB Quick Ligase. Hairpins were digested using USER (NEB), and the resulting DNA fragments were PCR amplified using Illumina double barcoded primers. PCR fragments were isolated by size selection from agarose gel and purification using NEB Monarch Gel Extraction Kit. Libraries were quantified using KAPA Library Quantification Kit and sequenced using Illumina NextSeq 550 and NovaSeq X.Genomic analysisEND-seq, ATAC–seq and ChIP–seq reads were mapped to the mouse (GRCm38p2/mm10) genomes using Bowtie2 (v.2.5.1-1)66 using the default parameters. For END-seq, peaks were called using MACS (v.1.4.3)67 with the parameters: -nolambda, -nomodel and -keep-dup = all (keep all redundant reads) and subsequent analysis were done using bedtools (v.2.31.1)68 and R (v.4.3.2). For peak calling, the corresponding sample (condition/genotype) was used as control, and specific peaks were selected as not called in the other condition/genotype. Peaks were later filtered by >1.5 RPKM and >3-fold RPKM to the control for Transwell assay and >1.3 RPKM and >twofold for cerebellum.The UCSC database69 was used to obtain the RepeatMasker annotations and TSS, transcription end site, exons and intron positions (RefSeq annotation table). H3K9me3, H3K4me3, H3K4me1, H3K27ac ChIP–seq peaks were called using epic270 (v.0.0.41, with -bin 10000 for H3K9me3 and 500 for the rest). Lamin B1 domains (regarded as LADs) were called using Enriched domain detector (edd, v.1.1.18)71 with --bin-size 37 and -g 37. ATAC–seq peaks were called using the Genrich default parameters, available at GitHub (https://github.com/jsh58/Genrich). RNA-seq, ATAC–seq and histone mark ChIP–seq peaks in control samples were used to define chromatin categories (active promoters, active enhancers, active exons and introns, transcriptionally inactive and unlabelled euchromatin, heterochromatin with LADs and heterochromatin without LADs) using bedtools as follows: active promoters: H3K4me3 peaks that overlap with ATAC–seq peaks; active enhancers: ATAC–seq peaks that do not overlap with H3K4me3; active exons exons of genes in RNA-seq with DESeq2 base mean value ≥5 after subtracting H3K4me3 and ATAC–seq peaks; active introns: introns of genes in RNA-seq with DESeq2 base mean value ≥5 after subtracting H3K4me3 and ATAC–seq peaks; heterochromatin LADs: lamin B1 LADS after subtracting the union of active promoters, active enhancers, active exons, active introns; heterochromatin noLADs: H3K9me3 peaks after subtracting lamin B1 LADS, active promoters, active enhancers, active exons and active introns; Euchromatin: genome mm10 after subtracting heterochromatin; transcriptionally inactive and unlabelled euchromatin: euchromatin after subtracting active promoters, active enhancers, active exons and active introns.Chromatin categories in cerebellar cells from P15 control and Lig4ND1-cre mice were defined using bedtools as follows. Active promoters: H3K4me3 peaks that overlap with H3K27ac peaks; active enhancers: H3K4me1 peaks that overlap with H3K27ac peaks after subtracting active promoters; poised enhancers: H3K27ac peaks after subtracting active promoters and active enhancers; heterochromatin: H3K9me3 peaks; euchromatin: genome mm10 after subtracting heterochromatin; transcriptionally inactive and unlabelled euchromatin: euchromatin after subtracting active promoters, active enhancers and poised enhancers. For each category, we compared the percentage of peaks between two conditions (Transwell 8 µm versus 3 µm, and cerebellum P15 control versus control and Lig4ND1-cre). Significance was estimated by 95% bootstrap confidence interval (CIs) for the difference in means between conditions using a nonparametric bootstrap: for each chromatin category (for example, active promoters) the four observed values were pooled and resampled rows (value + group label) with replacement 5,000 times, computed the difference of means in each resample, and took the 2.5th and 97.5th percentiles (percentile CI). A comparison was called significant when the 95% bootstrap CI for the difference did not include 0, and not significant when CI included 0. All analyses were performed in R (v.4.3.2) using the boot package (v.1.3.32, R = 5,000; seed = 123).CTCF and RAD21 ChIP–seq peaks were called using MACS (v.1.4.3) with the default parameters. The position weight matrix (PWM) of CTCF was taken from JASPAR database (v.2024)72 and significant CTCF motifs (P < 1 × 10⁻⁴) in the mouse genome were selected using the FIMO tool (v.4.12.0)73. Significant CTCF motifs at double CTCF/RAD21-bound peaks were used for the analysis. For data visualization, bedgraphs generated with bedtools were converted to .bigwig files using bedGraphToBigWig (v.302.1)74. Visualization of genomic profiles was performed using the UCSC browser75. Genome browser profiles were normalized to present RPM. For aggregate plots around CTCF sites, TSSs and gene bodies, the signal was smoothed using smooth.spline function in R.Behavioural testsAll behavioural tests were conducted during the light phase in the room where the mice were kept. Age- and weight-matched male mice were used for all behavioural tests. Mice of different genotypes were group-housed and tested in a random order. Investigators were blinded to genotype during behavioural experiments and data analysis. Control mice were included in each experimental session.Footprint analysisEach mouse was guided to walk along a straight runway lined with paper toward a dark box at the end. The forepaws and hindpaws were coated with non-toxic black and red paints, respectively. Each mouse completed three consecutive trials. A fresh sheet of white paper was placed on the floor of the runway for each run. Parameters measured included stride length, width based on forelimb or hindlimb placement, and the distance between the same-side forepaw and hindpaw prints (gait overlap)76.Balance beam testMice were encouraged to cross a narrow cylindrical plastic beam (12 mm diameter, 1 m length), placed horizontally 1 m above the bench surface, toward a dark goal box. Each mouse was trained for the task for 2 days before trial experiments. Mice performed three trials per day with a 5-min interval between trials. Mice were allowed to cross the beam voluntarily without external stimuli during trials. Hindlimb slips were recorded only while the mouse was passing through the middle 80 cm of the beam. The average number of slips from three trials was calculated for each mouse.Rotarod testMice were trained to remain on a rod (Rota-rod treadmill, Muromachi Kikai, MK-600) rotating at a constant speed of 2 rpm for 180 s (ref. 77). After a 1 h interval, a 180 s test session was conducted on a rotating rod with acceleration from 2 rpm to 20 rpm. One trial was run for each mouse per day for three consecutive days, with the training session performed only on day 1. The latency to fall (time spent on the rod) was recorded for each mouse in each session.Grip strength measurementGrip strength was assessed using a grip strength meter (force gauge A and D, AD-4932A-50N) with a rectangular grid handle. The mice were allowed to grasp the mesh of the grid handle with all four limbs. Once they had a firm grasp, they were slowly pulled horizontally by the tail until all limbs released the grid. The maximum force exerted during the trial was recorded. Five trials were performed for each mouse, with a 5 min rest period between the trials. The maximum force recorded from the five trials was used for analysis. Grip strength was normalized by calculating the ratio of grip strength to body weight, expressed as the raw grip strength (N)/weight (g) × 100.Image analysis and data representationAll image processing and analysis was performed using FIJI (ImageJ), except for the images presented in Extended Data Fig. 6a, which were processed using Imaris (Oxford Instruments). For fluorescence images, maximum projections of multiple z stacks were used in all figures except the magnified viewed enlarged in the Extended Data Fig. 3e, a single z stack was used to show the mono-structure of γH2AX. StarDist v.0.3.0, a tool plug-in on FIJI, was used to count the number of nuclei.Statistical analysisStatistical analysis was performed using GraphPad Prism v.7 or R v.4.3.3. Details regarding the number of biological replicates are provided in the figure legends. Error bars in the graphs indicate the s.d. The statistical methods applied are specified in each figure legend.Reporting summaryFurther information on research design is available in the Nature Portfolio Reporting Summary linked to this article.
Confined migration induces non-lethal DNA damage in developing neurons - Nature
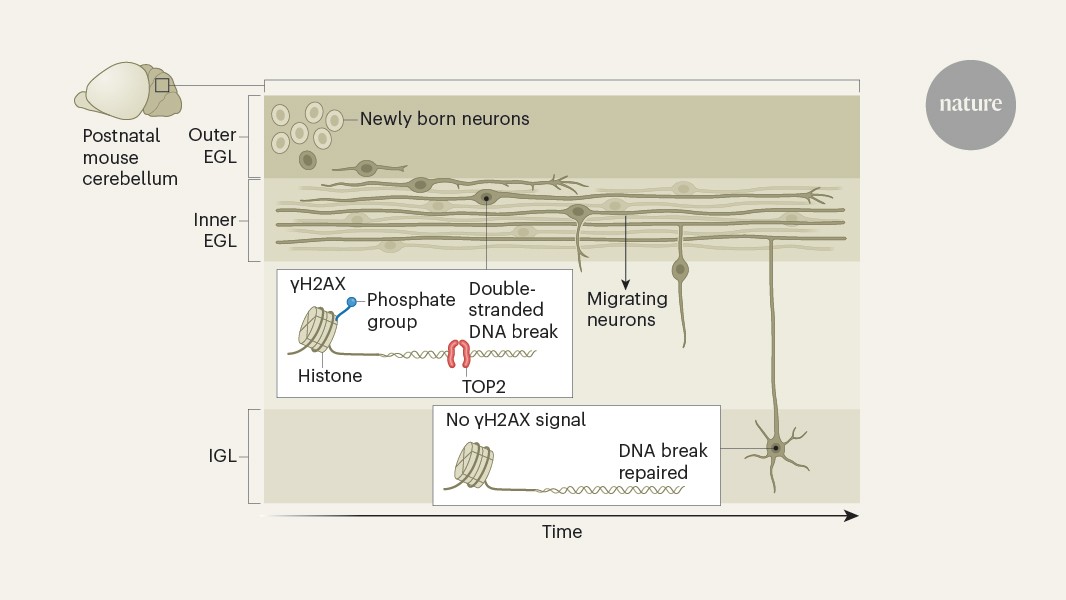
The migration of neurons in developing cerebral and cerebellar cortices is accompanied by massive DNA double-strand breaks due to mechanostress during passage through narrow interstitial spaces.
16,322 words~74 min read