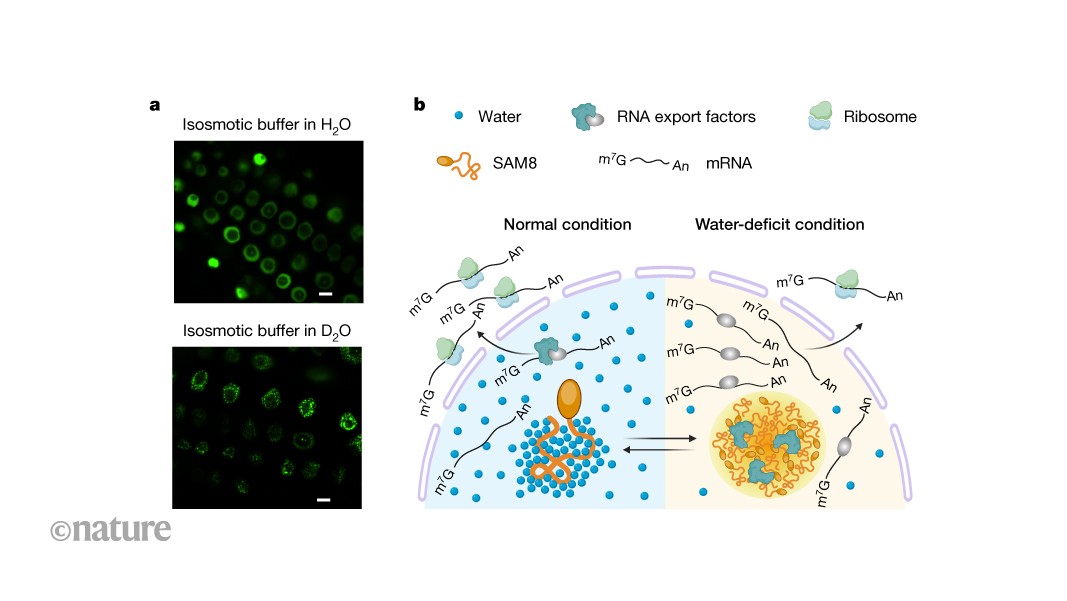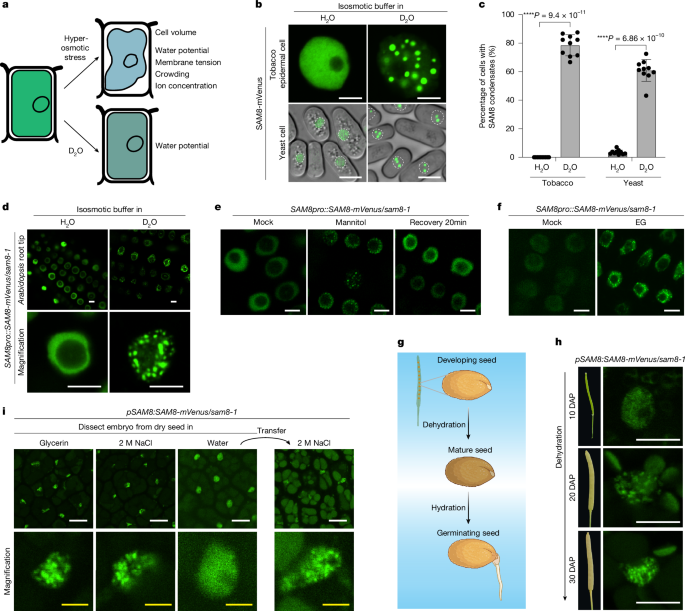
MainWater molecules are central to life, providing a solvent that maintains the functional structures and activities of biomolecules within cells. Cellular water molecules are bound by macromolecules, forming the hydration layer or freely diffuse in the bulk. These two portions of water are referred to as interfacial water and free water, respectively1. Water potential, which can be understood as the availability of free water, governs water uptake from the soil and transport within the plant3,4. The cellular water potential is sensitive to environmental fluctuations, particularly drought, high salinity and temperature stress1,2,5. Biomolecules in living cells are surrounded by at least a molecular layer of hydrated water6. Cellular water-potential reduction decreases hydration of biomolecules, compromising membrane integrity, disrupting the three-dimensional structures of proteins, impairing enzymatic activities, and so on7. Therefore, cellular water-potential sensing and response are crucial for plant development and adaptation to various environmental stresses, but the mechanisms underlying them remain unknown.SAM8 undergoes water-dependent condensationBiomolecular condensation is emerging as a key mechanism for sensing and responding to environmental stress8,9. Hyperosmotic stress often induces cell volume shrinkage, resulting in membrane tension changes, water-potential reduction and subsequent dehydration of biomolecules, increased molecular crowding and ion concentration10 (Fig. 1a and Extended Data Fig. 1a). Both nuclear and cytoplasmic proteins were reported to sense hyperosmotic stress by molecular crowding-dependent condensation in plants11,12. We reasoned that biomolecular condensation can be a way of sensing cellular water-potential changes because water tunes the strength of hydrophobic interactions, electrostatic interactions or the cation–π interactions, all of which are the driving force for condensation. Deuterium oxide (D2O) forms stronger hydrogen bonds than H2O, strengthening water–water interactions while reducing water–protein interactions13,14,15,16,17. Therefore, we used D2O treatment to reduce the water bound to proteins without affecting cell volume (Fig. 1a and Extended Data Fig. 1b).Fig. 1: SAM8 undergoes water-potential-dependent condensation in vivo.The alternative text for this image may have been generated using AI.Full size imagea, Illustration of the impact of osmotic stress and D2O on plant cells. b, Representative confocal images of tobacco epidermal cells (top) or Schizosaccharomyces pombe cells (bottom) expressing SAM8-GFP. The cells were treated for 10 min with an isosmotic buffer prepared with H2O or 90% D2O. The white dotted circles indicate the nuclei of yeast cells. Scale bar, 5 μm. c, Quantification of the percentage of cells containing SAM8 condensates as indicated. Error bars indicate mean ± s.d. (n = 10 independent experiments). d, Representative confocal images of Arabidopsis thaliana root tip cells that were treated with an isosmotic buffer prepared with H2O or 90% D2O. Scale bar, 5 μm. e,f, Representative confocal images of Arabidopsis root tip cells expressing SAM8-mVenus. The cells were treated with 0.3 M mannitol or 0.5 M EG for 10 min. Scale bar, 5 µm. g, Illustration of the dehydration and hydration process during seed development and germination. h, Representative confocal images of embryos dissected from the different stages of seeds expressing SAM8. DAP, days after pollination. Scale bar, 5 μm. i, Representative confocal images of embryos dissected from the dry and imbibed seeds expressing SAM8. Scale bar, 10 μm (white); 2 μm (yellow). Representative images of n independent experiments (n = 3 (d–f, h and i)). Asterisks indicate significant differences (two-tailed t-test).Source dataTo understand how plant cells directly sense water potential, we searched for D2O-dependent condensation by expressing proteins with the potential to undergo phase separation18 in cells and challenged the cells with an isosmotic buffer prepared with D2O. From this screen, we discovered a few proteins that formed condensates in tobacco cells in response to D2O treatment (Supplementary Table 1). Among them, At5g23680, which encodes a sterile alpha motif (SAM) domain-containing protein named SAM8, formed nuclear condensates in tobacco and yeast cells on D2O treatment (Fig. 1b,c). We next generated SAM8 complementation lines (SAM8pro::SAM8-mVenus) in sam8-1 knockout plants (Extended Data Fig. 3b–d). In root tip cells, SAM8-mVenus was diffuse in the nucleoplasm but formed nuclear condensates when plants were transferred into an isosmotic buffer containing more than 40% D2O for 5 min (Fig. 1d, Extended Data Fig. 1c,d and Supplementary Video 1). D2O-induced condensation of SAM8 was confirmed by immunostaining (Extended Data Fig. 1e). As a comparison, two known phase-separating proteins SEUSS and DCP511,12, did not form condensates on D2O treatment (Extended Data Fig. 1f). These observations indicate that the response of SAM8 to D2O is genuine and specific.We next tested whether SAM8 condensation is responsive to water-potential change induced by hyperosmotic stress. SAM8 rapidly formed condensates in tobacco epidermal cells (Extended Data Fig. 1g), yeast cells (Extended Data Fig. 1h) and Arabidopsis root tip cells (Fig. 1e) when cells were treated with hyperosmotic stress. The threshold of water-potential change for SAM8 condensation was approximately 0.3–0.35 MPa (Extended Data Fig. 1i,j). The condensates are highly dynamic as they dissolved within 20 min on stress removal (Fig. 1e) and exhibited fast recovery of fluorescence after photobleaching (Extended Data Fig. 1k). Ethylene glycol (EG), which does not cause molecular crowding but reduces cellular water potential12, triggered SAM8 condensation (Fig. 1f), indicating that SAM8 condensation is not dependent on molecular crowding. Treatment with abscisic acid (ABA) and reactive oxygen species (H2O2), both of which are early signals in osmotic signalling, did not induce SAM8 condensation (Extended Data Fig. 1l). Moreover, chemical inhibition of calcium influx by LaCl3 or genetic ablation of Raf-like kinases (ok130-null mutant)19 had negligible impact on SAM8 condensation (Extended Data Fig. 1m,n). These results indicate that SAM8 condensation is independent of known osmotic signalling pathways.The processes of seed ripening and germination experience marked changes in cellular water potential (Fig. 1g). SAM8 is highly expressed in seed and root tissues (Extended Data Fig. 3a), prompting us to examine SAM8 condensation during seed development and germination. In the course of seed development, when the embryos are still wet, SAM8 was diffused within the nucleus (Fig. 1h). Concomitant with dehydration during the late stages of seed development and in dry seeds, SAM8 formed condensates (Fig. 1h, i). On imbibition in water but not in NaCl solution, SAM8 condensates rapidly dissolved within 10–20 min (Fig. 1i). When water-imbibed seeds were transferred to NaCl solution, SAM8 condensates reappeared (Fig. 1i), suggesting that SAM8 condensation dynamically responds to water-potential changes in seeds.Temperature also tunes cellular water potential5,20. It has been reported that temperature increases and decreases antagonize and synergize with hyperosmotic treatments, respectively, in terms of cellular water potential1. Indeed, we found that hyperosmotic treatment at 35 °C induced fewer SAM8 condensates than at 25 °C, whereas treatment at 15 °C markedly enhanced its condensation in yeast cells (Extended Data Fig. 1o,p). Statistical analysis showed a significant interaction between external osmotic strength and temperature for SAM8 condensation (Extended Data Fig. 1p), indicating that temperature and osmotic stress jointly regulate SAM8 condensation. Similarly, in Arabidopsis roots, although hyperosmotic treatment at 25 °C triggered SAM8 condensation within 5 min, the same osmotic strength at 37 °C failed to induce SAM8 condensation even within 20 min (Extended Data Fig. 4a).Taken together, these data indicate that SAM8 undergoes water-potential-dependent condensation in cells.The driving force of SAM8 condensationSAM8 contains an SAM domain at its C terminus21 (Fig. 2a and Extended Data Fig. 2a). The remaining regions were largely unfolded (Extended Data Fig. 2a) and predicted as intrinsically disordered regions (IDRs; Fig. 2a). The SAM domain is a classic oligomerization domain that undergoes head-to-tail assembly and was reported to mediate phase separation22,23. Sequence-based predictions indicated that three positively charged amino acids (280 R, 281 R, 282 K) in the end helix surface are important for SAM8 oligomerization (Fig. 2a and Extended Data Fig. 2b). In vitro purified SAM domain mainly existed as oligomers, but substituting the three RRK residues with negatively charged glutamic acid residues (SAMRRKm) converted SAM to a monomer (Fig. 2b). To investigate the contribution of each region to SAM8 condensation, we generated truncation or mutation variants and tested their condensation in tobacco cells. Deletion of IDR1 resulted in partial cytoplasmic distribution of SAM8 but retained osmotic-dependent condensation, whereas deletion of IDR2 abolished SAM8 condensation (Fig. 2c). SAM8 with the SAM domain deleted (SAM8∆SAM) or mutated (SAM8RRKm) failed to form condensates (Fig. 2c). In line with this, co-expression of SAM8∆IDR2 and SAM8RRKm is sufficient to reconstitute osmotic-dependent condensation (Extended Data Fig. 2c). The necessity of IDR2 and SAM domain in SAM8 condensation was further confirmed in yeast cells (Extended Data Fig. 2d). In Arabidopsis stable transgenic plants, SAM8∆IDR2 and SAM8RRKm failed to form condensates on mannitol (Fig. 2d) or D2O (Extended Data Fig. 2e) treatment. These results indicate that both IDR-mediated multivalent interactions and SAM-mediated oligomerization are required for SAM8 condensation.Fig. 2: SAM8 condensation is required for hyperosmotic tolerance.The alternative text for this image may have been generated using AI.Full size imagea, Top and bottom, domain structures of SAM8 and its variants. IDR, intrinsically disordered region. Middle, IDR prediction by the indicated algorithms. b, Size-exclusion chromatography coupled with multi-angle laser light scattering assay showing the size of the SAM domain and SAMRRKm. Both proteins were fused with an MBP tag to prevent misfolding. Left y-axis, the light scattering intensity from the 90° detector (detector 11). Right y-axis, molecular weight. c, Representative confocal images of tobacco epidermal cells expressing SAM8 and its variants. The cells were treated with or without 0.3 M mannitol. Scale bars, 5 µm (white); 50 µm (red). d, Representative confocal images of Arabidopsis root tip cells expressing SAM8 and variants treated with or without 0.3 M mannitol for 10 min. Scale bar, 5 µm. e, Quantification of the root extension rate of Arabidopsis seedlings that were transferred to medium supplemented with 100 mM mannitol. Error bars indicate mean ± s.e. (n = 30). Statistical significance details are provided as Source Data. f, Representative images of Arabidopsis seedlings that grew for 10 days after transferring to medium supplemented with or without 100 mM mannitol. Scale bar, 1 cm. g,i, Representative images of 12-day-old seedlings of the indicated genotypes grown on medium containing 300 mM mannitol. Scale bar, 1 cm. h,j, Quantification of the survival percentage shown in g and i, respectively. Error bars indicate mean ± s.d. (n = 6 replicates with each replicate containing 36 plants for h; n = 3 with each replicate containing approximately 24 plants for j). For e,h and j, asterisks indicate significant differences (two-tailed t-test). NS, not significant. For c and d, n = 3 independent experiments.Source dataSAM8 condensation is functionalWe next assessed the functional significance of SAM8 condensation. We obtained two mutant alleles: sam8-1 contains a T-DNA insertion that abolishes SAM8 expression (Extended Data Fig. 3b–d); sam8-2 is a CRISPR mutant with a 1-bp insertion that causes a premature stop codon (Extended Data Fig. 3b). Under normal growth conditions, sam8 mutants were phenotypically indistinguishable from wild-type Col-0 (Fig. 2f,g). When plants were exposed to hyperosmotic stress, both root apical meristem cell growth and root extension rate were inhibited in Col-0 during the first few days and partially recovered later (Fig. 2e,f and Extended Data Fig. 3e–h), whereas this inhibition and recovery were significantly compromised in sam8 mutants (Fig. 2e,f and Extended Data Fig. 3e–h). This led to the hypothesis that impaired growth inhibition under osmotic stress increases stress sensitivity and possibly cell death. SYTOX Green staining showed substantially higher cell death rates in the sam8 mutants than in Col-0 (Extended Data Fig. 3i,j), and the survival of sam8 seedlings under hyperosmotic stress was significantly reduced (Fig. 2g,h). The hypersensitivity of the sam8-1 mutant can be fully rescued by wild-type SAM8 but not by the condensation-defective variants (Fig. 2i,j). These data indicate that SAM8 condensation is essential for osmotic stress adaptation and tolerance.In nature, hyperosmotic stress frequently coincides with higher ambient temperature or heat stress24. The dependence of SAM8 condensation on both osmotic potential and temperature (Extended Data Fig. 4a) prompted us to test whether SAM8 condensation mediates the combined effects. We found that hyperosmotic treatment at higher ambient temperature (26 °C) markedly increased death rates of wild-type plants compared with the same osmotic strength at 22 °C (Extended Data Fig. 4b–e). The sam8-1 mutant plants invariably displayed minimal root growth on osmotic treatment at both temperatures (Extended Data Fig. 4c–e). Consistent with this, when germinated and grown on hyperosmotic stress medium at two different temperatures, most of the Col-0 seedlings survived at 22 °C, but approximately 35% of them died at 26 °C (Extended Data Fig. 4f,g). The sam8 mutant plants showed no difference between 22 °C and 26 °C, and SAM8-complemented plants behaved like Col-0 (Extended Data Fig. 4f,g). By contrast, overexpression of SAM8 increased the propensity for condensation (Extended Data Fig. 4h) and enhanced plant survival at both 22 °C and 26 °C (Extended Data Fig. 4f,g). SAM8 thus represents one of the intracellular modules for integrating osmotic stress and temperature by water-potential-dependent condensation.Given that SAM8 condensation also responds to water-potential changes in seeds (Fig. 1h,i), we explored the function of SAM8 in seed germination. The results showed that both sam8-1 and sam8-2 exhibited a delayed germination rate compared with Col-0 (Extended Data Fig. 4i). This defect was fully rescued by wild-type SAM8 but not by condensation-defective variants (Extended Data Fig. 4j). Taken together, these data indicate that water-potential-dependent condensation of SAM8 is physiologically functional.SAM8 responds to water-potential change in vitroTo provide a mechanistic understanding of water-potential-dependent condensation, we purified SAM8 (Extended Data Fig. 5a,b) and assessed the phase behaviour in vitro. SAM8-GFP protein was homogenously diffused but formed sphere droplets on addition of PEG8000 (Fig. 3a and Extended Data Fig. 5c). However, addition of dextran or ficoll, which are widely used as model crowders in phase separation assays25, failed to trigger SAM8 phase separation (Fig. 3a). We confirmed this using a previously described crowding sensor, IDR1 of SEU11, finding that although 4% PEG and 7.5% dextran similarly induced IDR1SEU phase separation, 4% PEG but not 7.5% dextran induced SAM8 phase separation (Extended Data Fig. 5c).Fig. 3: The molecular basis of water-potential sensing by SAM8.The alternative text for this image may have been generated using AI.Full size imagea, In vitro phase separation assay of 2.5 μM SAM8 in the presence of indicated crowders. b, Vapour-pressure osmometry measurement of the osmotic potential (n = 5 independent experiments). c, Illustration of the hydration radius (Rh) and gyration radius (Rg). d, Measurement of Rg and Rh of SAM8 (n = 6 and 3 samples for DLS and SLS, respectively). e, DLS measurement of the hydration radius of the indicated solutions. f, Top, the amino acid sequence of IDR3 or IDR3mQ. Bottom, the net charge per residue of SAM8 as predicted by the CIDER webserver. g, Measurement of Rh and Rg of SAM8IDR3mQ (n = 30 and 3 samples for DLS and SLS, respectively). h, In vitro phase separation assay of 2.5 μM SAM8 and SAM8IDR3mQ. i, Illustration of the donor and acceptor in the FLIM-FRET experiments. j,k, The lifetime of the donor in the presence of PEG 8000 (j) or dextran (k) (n = 20 events). l, The lifetime of donor GFP for the indicated proteins (n = 30 events). m, Confocal imaging of 5 μM SAM8 and SAM8IDR3mQ in the presence of DI-4-ANEPPS dye. n, The ratio of emission at 535–545 nm and 610–640 nm shown in m (n = 98 condensates). o, FLIM images of dual SBD-labelled SAM8 and SAM8IDR3m condensates. p, Quantification of the lifetime of dual SBD shown in o (n = 9 independent samples). Asterisks indicate significant differences (two-tailed t-test). NS, not significant. q, Imaging of SAM8 and SAM8IDR3mQ that are expressed in sam8 mutant background. Error bars indicate mean ± s.d. Asterisks indicate significant differences (two-tailed t-test). NS, not significant. Scale bar, 10 μm (a,m,o), 5 μm (h,q). For a,e,h,m,o and q, n = 3 independent experiments.Source dataAlthough PEG and dextran are similar in their ability to induce crowding, PEG can constrain many more water molecules than dextran and thus markedly lowers the water potential1,26. We verified this by vapour-pressure osmometry measurements (Fig. 3b). The hypersensitivity of SAM8 to PEG but not to dextran suggests that SAM8 phase separation in vitro is dependent on water potential. Consistently, SAM8-GFP formed condensates in D2O- but not H2O-prepared buffer (Extended Data Fig. 5d), and the small molecule 2,2,2-trifluoroethanol (TFE), which has a strong ability to displace the hydrating water molecules from biomolecules27, induced the condensation of SAM8 (Extended Data Fig. 5e).SAM8 condensation was not affected by GFP tag, as untagged SAM8 also formed condensates on addition of D2O or PEG (Extended Data Fig. 5d,f). As a control, the condensation of SEUSS-IDR111, DCP5-ICS12 and FREE128, was unaffected by D2O (Extended Data Fig. 5d). Consistent with in vivo observations, the ability of SAM8 to phase-separate in vitro was largely dependent on IDR2 and the SAM domain (Extended Data Fig. 5g,h). These data indicate that SAM8 condensation is intrinsically sensitive to reductions in water potential.SAM8 possesses a thick hydration layerTo understand the molecular basis of water-potential response, we interrogated the hydration of SAM8. We used dynamic light scattering29 and multi-angle light scattering30 to measure the hydration radius (Rh) and actual size (or radius of gyration, Rg) of SAM8, respectively (Fig. 3c). We found that Rh of SAM8 was significantly bigger than Rg (Fig. 3d), consistent with an unusually hydrated state and/or expanded conformation. As a control, there is no obvious difference between the Rh and Rg of SOSEKI131 and SAM721 (Extended Data Fig. 5i), both of which contain polymerization domains. In line with the ability of PEG to compete for hydration, the Rh of SAM8 was decreased by the addition of PEG (Fig. 3e). PEG has less impact on water potential at higher temperature1 (Extended Data Fig. 5j,k). We found that the size of SAM8 droplets decreased significantly at 37 °C compared with that at 25 °C in the presence of the same amount of PEG (Extended Data Fig. 5l,m). By comparison, the droplets of IDR1SEU showed no noticeable change at two temperatures (Extended Data Fig. 5l,m). Taken together, these results demonstrate that SAM8 possesses a thick hydration shell and that a reduction in water potential leads to its phase separation in vitro.Molecular basis of water-potential sensingWe next explored the mechanism underlying SAM8 hydration. Analysis of net charge showed that the IDR3 of SAM8 is highly negatively charged (Fig. 3f and Extended Data Fig. 6a). Energy calculations using the AMOEBA force field showed that Asp and Glu have very low intrinsic free energies of hydration32. We, therefore, proposed that the negative charges within IDR3 are the main determinant for SAM8 hydration. To test this, we generated a SAM8 variant (SAM8IDR3mQ) by mutating Asp and Glu within IDR3 into Asn and Gln, respectively (Fig. 3f). Distinct from wild-type SAM8, SAM8IDR3mQ showed no difference in its Rh and Rg (Fig. 3g) and formed condensates without the need for PEG (Fig. 3h). To decouple the contribution of electrostatic repulsion and hydration in SAM8 condensation, we mutated 10 core aspartate/glutamate residues within IDR3 into serine (SAM8IDR3mS; Extended Data Fig. 6b,c) to preserve hydration but not electrostatic interactions, as serine is polar and attracts water molecules by dipole–dipole interactions. We also generated SAM8IDR3mK and SAM8IDR3mR (Extended Data Fig. 6b,c) to preserve electrostatic repulsion and disrupt hydration, as lysine and arginine are less potent at hydration than aspartate and glutamate32. Biophysical analyses confirmed that the Rh and Rg of SAM8IDR3mS showed a significant difference, whereas those of SAM8IDR3mK and SAM8IDR3mR showed less or no difference (Extended Data Fig. 6d). Consistently, SAM8IDR3mS formed condensates in a PEG-dependent manner, whereas SAM8IDR3mK and SAM8IDR3mR formed constitutive condensates without PEG (Extended Data Fig. 6e). These results indicate that the negatively charged IDR3 controls SAM8 condensation primarily by its potent hydration.Next, we performed FLIM-FRET assays to examine the intermolecular interactions of SAM8 under changing water potentials (Fig. 3i). SAM8∆SAM was used to avoid the dominant impact of SAM oligomerization on FRET signal. The results showed gradual enhancement of SAM8 intermolecular interactions on increasing the concentration of PEG (Fig. 3j), NaCl (Extended Data Fig. 6f,g), mannitol (Extended Data Fig. 6h,i), but not dextran (Fig. 3k). It is noteworthy that the water-potential threshold for SAM8 interactions in vitro (Fig. 3b) is similar to that of SAM8 condensation in vivo (Extended Data Fig. 1i,j), suggesting that SAM8 senses water-potential thresholds of physiological relevance. Disruption of the negative charges within IDR3 significantly enhanced the intermolecular interactions (Fig. 3l). Collectively, these data demonstrate that reduced water potential directly promotes SAM8 self-interaction and triggers condensate formation.Given the strong charge–dipole interactions and hydrogen bonding capacity of negatively charged amino acids, we next tested whether the negative charges set up an electric field around SAM8, which could polarize and constrain water molecules33. To this end, we probed the microenvironment of SAM8 condensates. The Di-4-ANEPPS can be used to measure local electric field34,35. We found that SAM8 condensates exhibited a significantly higher ANEPPS signal ratio than condensates of SAM8IDR3mQ (Fig. 3m,n) and other mutant variants (Extended Data Fig. 6j,k), indicating a stronger electric field within SAM8 condensates. The SBD-related fluorophore has been used to measure the micropolarity of condensates as its fluorescence lifetime decreases with increasing micropolarity36. SAM8 condensates exhibited shorter fluorescence lifetime than SAM8IDR3mQ condensates (Fig. 3o,p). Together, these results indicate that negative charges within IDR3 endow SAM8 hydration, preventing its condensation under water-rich conditions.Conservation analysis of SAM8 condensationWe performed a phylogenetic analysis and identified SAM8 homologues in all land plants (Extended Data Fig. 7a). These SAM8 homologues contain a highly conserved C-terminal SAM domain, juxtaposed by a conserved negative patch (Extended Data Fig. 7a). Notably, the degree of negative charge varies among SAM8 homologues, prompting us to test if this correlates with the threshold of water potential for condensation. We found that SAM8 from Camelina sativa (Cs), a drought-tolerant crop that can be grown in environment with limited water availability37, showed high sequence homology with Arabidopsis SAM8 but contains longer stretch of negatively charged amino acids in IDR3 region (Extended Data Fig. 7b). In vitro, CsSAM8 required slightly higher PEG8000 concentrations to induce its phase separation compared with AtSAM8 (Extended Data Fig. 7c). When expressed in yeast cells, both AtSAM8 and CsSAM8 formed more condensates on increasing sorbitol concentration, supporting the conservation of SAM8 response to water potential. However, CsSAM8 formed fewer condensates than AtSAM8 on the same sorbitol treatment (Extended Data Fig. 7d), suggesting that CsSAM8 has a more negative water-potential threshold. We then generated complementation Arabidopsis plants expressing CsSAM8 under the AtSAM8 promoter in the sam8-1 mutant background. Compared with AtSAM8, a smaller number of condensates were observed for CsSAM8 on treatment by the identical concentration of mannitol or percentage of D2O (Extended Data Fig. 7e). In the root extension assay, we found that CsSAM8/sam8-1 plants were less inhibited by the same osmotic stress than AtSAM8/sam8-1 plants (Extended Data Fig. 7f–i). In line with this observation, SAM8IDR3mQ constitutively formed nuclear condensates in root tip cells under normal growth condition (Fig. 3q), and SAM8IDR3mQ/sam8-1 plants showed retarded growth and development compared with wild type or SAM8/sam8-1 plants (Extended Data Fig. 7j). Together, these results indicate that the ability to sense water-potential change by SAM8 is conserved and crucial for balancing growth and osmotic tolerance.SAM8 condensates recruit RNA export factorsNuclear mRNA export is an essential RNA surveillance step for proper gene expression38,39. Recent structural analysis of human mRNA export complex showed that ALYREF (ALY) recognizes mRNA ribonucleoprotein complexes (mRNPs) through exon junction complex (EJC) and connects it with transcription–export complex (TREX) through UAP56, forming TREX-mRNP complexes that are competent for subsequent export40,41 (Fig. 4a). To explain the molecular function of SAM8 condensation, we searched for SAM8-interacting proteins by immunoprecipitation under hyperosmotic stress. Gene ontology analysis showed significant enrichment for mRNA surveillance pathway and RNA splicing (Extended Data Fig. 8b). Notably, several RNA export factors were identified in the interactome, including all four members of the ALY family42 and EJC subunit EIF4A343 (Extended Data Fig. 8a and Supplementary Table 2). The interactions between SAM8 and ALYs and EIF4A3 were validated by co-immunoprecipitation (Fig. 4b), bimolecular fluorescence complementation (Extended Data Fig. 8c) and FLIM-FRET (Extended Data Fig. 8d) assays. In tobacco epidermal cells, ALYs and EIF4A3 were diffused in the nucleolus and nucleoplasm, consistent with their localization in Arabidopsis42,43 (Fig. 4c). On hyperosmotic treatment, ALYs and EIF4A3 were highly enriched in SAM8 condensates (Fig. 4c), suggesting that SAM8 condensates partition ALYs and EIF4A3. Similarly, ALYs and EIF4A3 were recruited by SAM8 droplets in vitro (Fig. 4d).Fig. 4: SAM8 condensates selectively recruit RNA export factors.The alternative text for this image may have been generated using AI.Full size imagea, Schematic of the key steps of RNA export. b, Co-IP analyses of the interactions between SAM8 and ALYs on co-expression in tobacco epidermal cells. For gel source data, see Supplementary Fig. 1. c, Representative confocal images of tobacco nuclei showing the colocalization of ALYs-GFP with SAM8-Cerulean condensates. Scale bar, 5 μm. d, In vitro phase separation assay showing the colocalization of ALY1 with SAM8 droplets. Scale bar, 5 μm. e, In vitro phase separation of 2.5 μM ALY1-BFP and UAP56B-mCherry in the presence of increasing amounts of SAM8-GFP (0 μM, 2.5 μM, 5 μM and 12.5 μM, respectively). Scale bar, 5 μm. f, The mean fluorescence intensity inside droplets shown in e. Error bars indicate mean ± s.d. (n = 6 independent experiments). Asterisks indicate significant differences (two-tailed t-test). g, Co-expression in tobacco epidermal cells showing that SAM8 condensates enrich ALY1 and EIF4A3 but exclude UAP56B. Scale bar, 5 μm. Intensity plots are shown at right. For b–d and g, n = 3 independent experiments.Source dataThe ALY family proteins possess a conserved central RRM domain and nonspecifically bind single-stranded RNAs42. We found that ALY1 formed droplets together with a 35-nucleotide PolyA RNA (Extended Data Fig. 8e). When ALYs/RNA was incubated with SAM8, ALYs/RNA droplets formed subphases within SAM8 droplets (Extended Data Fig. 8f), reminiscent of coexisting multiphases formed by nucleolar proteins44. The ALY–RNA subphase formation occurs irrespective of the order of component addition or incubation duration (Extended Data Fig. 8g,h). This is probably due to the higher micropolarity of SAM8 condensates or to differences in the interaction strengths between SAM8, ALYs and RNA. Nevertheless, these observations further support that SAM8 condensates partition ALYs/RNA complexes.Arabidopsis ALYs interact directly with UAP5642. Consistently, UAP56 was recruited into ALY1 droplets in vitro (Fig. 4e). However, UAP56 was found neither in SAM8 immunoprecipitation (Supplementary Table 1) nor in SAM8 condensates (Extended Data Fig. 8i). When increasing concentrations of SAM8 were added to ALY1/UAP56, ALY1 but not UAP56B was partitioned into SAM8 droplets (Fig. 4e,f). Co-expression in tobacco cells confirmed that SAM8 condensates recruited ALY1 and EIF4A3 but excluded UAP56 (Fig. 4g). These findings suggest that SAM8 condensates can disrupt the association between ALY and UAP56 by selective partitioning.SAM8 mediates nuclear retention of mRNAsThe selective recruitment of RNA export factors by SAM8 condensates prompted us to propose that SAM8 condensation inhibits mRNA transport. To test this, we detected mRNA localization by fluorescence in situ hybridization (FISH) with oligo(dT) probes. In wild-type Col-0, the mRNA signal was distributed evenly in the nucleus and cytoplasm under normal growth conditions (Fig. 5a,b), but showed a significantly higher nuclear-to-cytoplasmic ratio on osmotic treatment (Fig. 5a,b). By contrast, the sam8-1 mutant showed a similar nuclear-to-cytoplasmic mRNA ratio under normal and osmotic stress conditions (Fig. 5a,b). These findings indicate that osmotic stress elicits nuclear retention of mRNA in a SAM8 condensation-dependent manner.Fig. 5: SAM8 mediates mRNA nuclear retention and translational reprogramming under osmotic stress.The alternative text for this image may have been generated using AI.Full size imagea, RNA FISH with oligodT probes in Arabidopsis root tips under mock and osmotic stress conditions. Scale bar, 5 μm. b, Quantification of the nuclear-to-cytoplasmic ratio of the mRNA signal shown in a. Error bars indicate mean ± s.d. (n = 271, 292, 288 and 297 cells, respectively). Asterisks indicate significant differences (one-way analysis of variance followed by the least significant difference test). NS, not significant. c, Representative images of 12-day-old seedlings of indicated genotypes grown on medium containing 300 mM mannitol. Scale bar, 1 cm. d, Quantification of survival percentage shown in c. Error bars indicate mean ± s.d. (n = 6 replicates with each replicate containing approximately 24 plants). e,f, The TE change in Col-0 (e) and sam8-1 (f) under mannitol treatment compared with mock. (TE fold change ≥1.2 and P < 0.05, two-tailed t-test). g, The overlap of TE-changed genes in Col-0 and sam8-1. h, Top 20 enriched gene ontology terms for TE up- and downregulated genes in sam8-1 compared with Col-0 under mannitol treatment (P < 0.05, Benjamini–Hochberg correction). Stress- and development-related items are highlighted in red and blue, respectively. i, TE of candidate genes as determined by polysome profiling. Error bars indicate mean ± s.d. (n = 3 independent experiments). j, A working model for SAM8. Under normal growth conditions, when cellular water is enough to keep SAM8 hydrated, SAM8 condensation is inhibited. Once cellular water content is reduced on encountering water-deficit stress, SAM8 hydration decreases, activating SAM8 condensation. SAM8 condensates selectively include and exclude RNA export factors, thereby disrupting mRNA export and resulting in translation reprogramming. Diagram in j created in BioRender; Fang, X. (2026) https://BioRender.com/65fgbep. Asterisks indicate significant differences (two-tailed t-test). NS, not significant.Source dataTo test whether the nuclear retention of mRNAs under osmotic stress is important for osmotic stress adaptation, we overexpressed ALYs as well as EIF4A3 to boost mRNA nuclear export. The results showed that this led to hypersensitivity to osmotic stress compared with the wild type (Fig. 5c,d and Extended Data Fig. 9a–c). These data indicate that SAM8 condensation-dependent regulation of RNA export promotes osmotic tolerance.SAM8 regulates translational reprogrammingTo test how this retention regulates translation, we calculated the global translation efficiency (TE) using parallel mRNA sequencing (mRNA-seq) and Ribo-seq (ribosome profiling) in Col-0, sam8-1 and sam8-2 under normal conditions and on hyperosmotic treatment (see Extended Data Fig. 10a,b for quality control). The results showed substantial differences in hyperosmotic-induced TE changes in Col-0 (Fig. 5e). Gene ontology analysis showed that TE-upregulated genes were enriched in responses to various stresses, whereas TE-downregulated genes were enriched in growth and development (Extended Data Fig. 10c), indicating that plants balance growth and stress defence by reprogramming translation. By contrast, TE changes induced by hyperosmotic treatment were much smaller in sam8 mutants (Fig. 5f and Extended Data Fig. 10d) and showed less than 1% of overlap with those of wild-type (Fig. 5g), supporting that SAM8 is important for the translation reprogramming in response to osmotic stress. Comparison of translational efficiency between sam8-1 and wild-type showed marked changes under both mock and osmotic stress conditions (Extended Data Fig. 10e,f). Gene ontology analysis showed that these TE-changed genes were mainly enriched in development- and stress-related processes (Fig. 5h and Extended Data Fig. 10g), indicating a role of SAM8 in balancing growth and stress defense. To confirm the translation of candidate transcripts, we performed a polysome profiling assay (Extended Data Fig. 10h). Translational efficiency was calculated as the ratio of RNA levels in polysomal fractions to total transcripts by quantitative reverse transcription polymerase chain reaction (RT-PCR). Consistent with the Ribo-seq results, the translation of ABF4 (ABRE BINDING FACTOR 4) and DREB2A (DEHYDRATION-RESPONSIVE ELEMENT-BINDING PROTEIN 2), which encode important osmotic stress regulators, were upregulated by osmotic stress in Col-0 but not in sam8-1 mutant (Fig. 5i). Translation of transcripts encoding key regulators of root meristem cell growth, such as LHW (LONESOME HIGHWAY) and RGI4 (RGF1 INSENSITIVE 4), were significantly downregulated by osmotic stress in Col-0 but remained largely unchanged in sam8-1 mutant (Fig. 5i). As a control, the translational efficiency of UBC10 was unaffected (Extended Data Fig. 10i). Taken together, these results indicate that SAM8 condensation under osmotic stress promotes stress-adaptive translation and suppresses growth-related translation via regulating mRNA export.DiscussionOur results collectively support that SAM8 is a direct cellular water-potential sensor. SAM8 possesses SAM-mediated oligomerization and IDR-mediated weak multivalent interactions, making it prone to condensation. However, a negatively charged region within SAM8 establishes an electric field that enables thick hydration. As such, under conditions in which cellular water is abundant, SAM8 hydration prevents its condensation. Under water-scavenging conditions such as drought or high salinity, reduction of hydration activates SAM8 condensation (Fig. 5j). SAM8 condensates selectively include and exclude RNA export factors, leading to mRNA retention and translational reprogramming (Fig. 5j).Although biomolecular condensate formation is generally affected by water–protein interactions45, protein–protein interactions also contribute substantially to the thermodynamic driving forces of biomolecular condensation46. SAM8 is unique in that it has both strong protein–protein interactions that are mediated by the SAM domain and protein–water interactions enabled by the negatively charged patch. We believe that the combination and balance between protein–protein and protein–water interactions are crucial for water-potential sensing. Many other polymerization domains and hydrophobic regions are involved in biomolecular condensation16,23. Our findings shed light on the discovery or engineering of different water-potential sensors.In response to diverse stresses, eukaryotic cells activate the integrated stress response (ISR), the core of which is to attenuate global protein synthesis while promoting the selective translation of specific mRNAs47. Translation of many mRNAs was inhibited under hyperosmotic stress in plants12. RNA export is an important process to ensure the continuity between transcription and translation48. Our results indicate that SAM8 condensation reprograms translation by controlling mRNA export, representing one of the strategies to adjust translation under hyperosmotic stress in plants. A previous study49 reported that RNA export acts as a surveillance mechanism under heat stress in Saccharomyces cerevisiae. Heat induces the dissociation of RNA export factor Mex67 from regular mRNAs to prevent general mRNA export. By contrast, heat-shock mRNAs are rapidly exported and preferentially translated, facilitating cell survival under extreme situations49. It is well-established that the balance between stress resistance and growth is finely tuned50. SAM8 condensation could be a mechanism for maintaining this balance. Our next step is to test whether certain stress-related mRNAs can evade SAM8-dependent retention and be selectively exported to the cytoplasm in plants.MethodsPlant materials, growth conditions and stress treatmentAll the Arabidopsis thaliana mutants and transgenic plants used in this study were in the Columbia (Col-0) background. The T-DNA insertion mutant sam8-1 (SALK_065676) was ordered from the AraShare. The sam8-2 is a CRISPR-edited allele carrying a 1-bp insertion 39 bp downstream of the start codon, which introduces a frameshift and premature stop codon. The resulting protein is MAELQLVEGHQINRRFYPAGDNKLNRSTGNIRRSRSFSRIETIEKT*. The ok130-null mutant was provided by Prof. Pengcheng Wang (Southern University of Science and Technology). Seeds were surface sterilized with 2.5% (v/v) sodium hypochlorite and 70% (v/v) ethanol, stratified for 3 days in the dark at 4 °C, and sown on half-strength Murashige and Skoog (MS), 0.8% (w/v) agar plates supplemented with 1% (w/v) sucrose. Plate media were transferred to a growth chamber under a long-day (16 h light 22 °C/8 h dark 18 °C) photoperiod.For the germination kinetic assay, all seeds of the indicated genotypes were harvested on the same date from plants grown under identical conditions. They were then uniformly dried at 37 °C for 2 weeks to ensure a consistent after-ripening process. Subsequently, the seeds were sown on the same batch of medium and placed in a growth chamber without stratification under a long-day photoperiod (16 h light at 22 °C/8 h dark at 18 °C). Germination rate was calculated as the mean percentage of seeds that had ruptured their seed coats. Each genotype was evaluated in three biological replicates, each comprising approximately 300 seeds.For direct osmotic stress treatment, sterilized seeds of different genotypes were germinated on 1/2 MS medium supplemented with 300 mM d-mannitol (Solarbio, M8141) and grown at 22 °C or 26 °C. The phenotypes were recorded at 12 days post-germination. Survival was determined by the ability of seedlings to resume growth after stress removal. Specifically, seedlings were returned to 1/2 MS medium following stress treatment, and survival was assessed 7 days later. Seedlings that remained green and produced new tissues (for example, true leaves) were counted as survivors, whereas those that became white or brown and failed to resume growth were scored as non-survivors. For the transfer assay, sterilized seeds of Col-0 and sam8-1 were germinated on standard half-strength MS medium at 22 °C for 3 days, then transferred to a medium containing 750 mM d-mannitol and grown vertically at 22 °C or 26 °C for 5 days. After treatment, the seedlings were transferred back to normal medium and grown at 22 °C for 10 days before phenotypes were recorded.For the root extension assay, 5-day-old seedlings grown on standard half-strength MS medium were transferred to a medium containing mannitol and grown vertically for 10 days. For meristem zone measurement, the seedlings were imaged under differential interference contrast of a Nikon AXR with NSPARC confocal microscope system using a 100×/1.45 oil objective 2 days after transfer. The length of the meristem zone was quantified from the QC (Quiescent Center) to the first elongated cell. For the extension rate analysis, root length was measured every day, and the rate was calculated as mm per day.Plasmid constructionTo generate the pSAM8::SAM8-mVenus construct, a 2.2-kb promoter and a 1-kb 3′ untranslated region (UTR) were amplified from wild-type Col-0 genomic DNA and cloned into the pCAMBIA1300-mVenus vector51, giving rise to the pSAM8::mVenus-UTR construct. The coding sequence of SAM8 was amplified and inserted between the promoter and mVenus. For SAM8 variants, site-directed mutagenesis or domain deletion was performed with a standard two-step polymerase chain reaction (PCR) and verified by DNA sequencing to generate the coding sequences of SAM8ΔIDR1, SAM8ΔIDR2, SAM8IDR3mQ, SAM8IDR3mS, SAM8IDR3mK, SAM8IDR3mR, SAM8ΔSAM and SAM8RRKm. All coding sequences were cloned into the pSAM8::mVenus-UTR vector.To generate the sam8-2 mutant, two sgRNAs were designed and inserted into the BbsI sites of the pAtU6-26-M vector. The Cas9 cassettes were subcloned into pCambia1300-UBQ:Cas9-P2A-GFP-rbcS-E9t vector52 (digested with KpnI and EcoRI). All constructs were introduced into Agrobacterium tumefaciens strain GV3101 and transformed into sam8-1 mutant plants using the standard floral-dipping method. Positive transformants were selected on half-strength MS medium containing 30 mg l−1 hygromycin (AMRESCO, K547). Homozygous transgenic lines were used for experiments. For the sam8-2 mutant, Cas9-free plants were used for experiments.For the constructs used in transient expression in tobacco epidermal cells, the coding sequences of SAM8 and its variants, ALY1/2/3/4, eIF4A3, UAP56B and NUL1 were amplified and inserted into the pCAMBIA1300-35S-mVenus/NmVenus/CmVenus/Flag/mCerulean/mCherry vector51 (digested with KpnI). The same construct was used for generating overexpression transgenic lines where necessary.To generate the constructs used for heterologous expression in yeast cells, the coding sequences of SAM8 and its variants were amplified and inserted into the pDUAL-Pnmt1-yeGFP vector53 (digested with NheI and BamHI).To generate the constructs used for in vitro protein expression, the coding sequences of SAM8 and its variants, ALY1/2/3/4, eIF4A3, UAP56B, SAM7 and SOSEKI1 were amplified and inserted into the pET11-6×His, pET11-6×His-GFP, pET11-6×His-mCherry or pET11-6×His-BFP expression vector11 (digested with NheI). Where necessary, a maltose-binding protein (MBP) solubility tag was placed at the N-terminus of the construct, followed by a tobacco etch virus protease (TEV) cleavage site. To generate the constructs used for micropolarity assay, the coding sequences of MBP-SAM8 or MBP-SAM8IDR3mQ were amplified and inserted into the p1-Halo-pET29b expression vector (digested with NheI and BamHI).All cloning was performed using the ClonExpress II One Step Cloning kit (Vazyme, C115). The primer sequences used in this study are provided in Supplementary Table 3.In vitro protein expression and purificationAll proteins were expressed and purified from Escherichia coli (Rosetta) cells using Ni-NTA resin as described previously54. Briefly, protein expression was induced by 0.4 mM isopropyl-β-D-1-thiogalactopyranoside (IPTG) at 15 °C overnight. Cells were collected by centrifugation and resuspended in lysis buffer (40 mM Tris-HCl pH 7.4, 500 mM NaCl, 10% glycerol). The suspension was sonicated for 20 min (3 s on, 6 s off, SCIENTZ) and centrifuged at 12,000g for 60 min at 4 °C. The supernatant was incubated with Ni-NTA agarose for 20 min and washed five times with wash buffer (40 mM Tris-HCl pH 7.4, 500 mM NaCl, 20 mM Imidazole) and eluted with elution buffer (40 mM Tris-HCl pH 7.4, 500 mM NaCl, 500 mM Imidazole). Proteins were purified by gel filtration chromatography (Superdex-200; GE Healthcare) and stored in the buffer (40 mM Tris-HCl pH 7.4, 500 mM NaCl, 1 mM DTT) at 4 °C.Size-exclusion chromatography coupled with multi-angle laser light scatteringSize-exclusion chromatography coupled with multi-angle laser light scattering was performed as described previously55. Briefly, chromatography was performed in 40 mM Tris-HCl, pH 7.4 and 500 mM NaCl using a Superdex-200 10/300 GL size-exclusion column (GE Healthcare). The concentrations of MBP-SAM, MBP-SAMRRKm, MBP-SAM8, MBP-SAM7 and MBP-SOSKEI1 used for this assay are 2 mg ml−1, 2 mg ml−1, 5 mg ml−1 and 5 mg ml−1, respectively. The chromatography system was connected to a Wyatt DAWN HELEOS laser photometer and a Wyatt Optilab T-rEX differential refractometer. Wyatt ASTRA v.7.3.2 software was used for data analysis.Dynamic light scattering measurementSAM8 protein of 2 mg ml−1 in 40 mM Tris-HCl, pH 7.4, 100 mM NaCl was used for Dynamic light scattering (DLS) measurement. The protein sample of 100 μl was transferred into a quartz cuvette (WYATT, JC-0247). DLS measurements were performed using DynaPro NanoStar (Wyatt). Each data point was collected from 10 to 30 acquisitions. The data were analysed using the DYNAMICS software using a cumulant fit to the autocorrelation function.Yeast transformation for heterologous expressionThe plasmids were linearized with NotI, and the resulting fragments were gel-purified and transformed into the fission yeast strain LD328 (genotype his3-D1 leu1-32) as described previously56. Briefly, yeast cells were cultured until the OD600 reached 0.4–0.8. For each reaction, 500 μl of cultured cells were collected, washed three times with sterilized water and resuspended in buffer I (240 μl of 50% PEG3350, 36 μl of 1.0 M LiAc and 50 μl of 2.0 mg ml−1 carrier DNA). The linearized DNA (34 μl, up to 1 μg) was added to the resuspended cells, mixed vigorously and incubated at 42 °C for 40 min. The cells were collected and resuspended in 100 μl of water, then plated on EMM + HT (EMM medium supplemented with 45 mg l−1 histidine and 15 μM thiamine) plates. After incubation at 30 °C for 2–3 days, individual colonies were selected on EMM + H (EMM medium supplemented with 45 mg l−1 histidine) plates. The cells were used for subsequent imaging analyses.Fluorescence imaging of cells and tissuesFive-day-old Arabidopsis seedlings or tobacco leaves were soaked in liquid half-strength MS medium supplemented with or without d-mannitol, PEG8000, EG, or isosmotic buffer prepared with heavy water (SIGMA, 151882). After treatment, the root tip or a small leaf disc was mounted on a slide, covered with a coverslip and immediately imaged under a Zeiss LSM880 confocal microscope using a 100×/1.40 oil objective or a Nikon AXR with NSPARC confocal microscope system using a 100×/1.45 oil objective. GFP was excited at 488 nm and detected at 491–535 nm; mVenus was excited at 514 nm and detected at 529–570 nm; mCherry was excited at 561 nm and detected at 575–625 nm; and mCerulean or BFP was excited at 405 nm and detected at 410–507 nm. The channels of mVenus, mCerulean and mCherry were acquired sequentially to avoid emission crosstalk.For imaging of SAM8 during seed development, developing siliques from pSAM8::SAM8-mVenus/sam8-1 plants were collected. The seeds were dissected to remove their seed coats and then imaged. For imaging of SAM8 during seed germination, dry seeds were imbibed in glycerin, NaCl or water solutions for 10–20 min, then dissected to remove the seed coats. The embryos were mounted on a slide, covered with a coverslip and immediately imaged under a Nikon AXR with NSPARC confocal microscope system using a 100×/1.45 oil objective.For imaging of yeast cells, three colonies were streaked on a medium plate and cultured overnight. Before imaging, a colony was resuspended in liquid medium containing either 1.2 M sorbitol or 0.6 M NaCl. The cells were sprayed onto a slide and covered with a coverslip. Imaging was performed on a Zeiss LSM880 confocal laser microscope. GFP was excited at 488 nm and detected at 491–535 nm. Imaging at 35 °C was performed on a Nikon AX R confocal microscope equipped with an Okolab microscope incubator using a 40× 0.95-NA (numerical aperture) objective.In vitro phase separation assayFor the in vitro phase separation, the solubility tag MBP was removed by TEV protease cleavage. The proteins were diluted to the desired concentrations with the indicated ionic strengths. The protein samples were incubated for 30 min before imaging. For D2O treatment, the same buffer was prepared with heavy water (SIGMA, 151882). To analyse the effect of PEG8000, Dextran 40 and Ficoll 400 on SAM8 phase separation, the indicated concentrations of those crowders were added to the protein samples in 40 mM Tris-HCl, pH 7.4, 150 mM NaCl, and incubated at the indicated temperatures. The protein samples were imaged in a 384-well low-binding microscopy plate (Greiner bio-one, 781090) using a Zeiss LSM880 confocal microscope equipped with a 63×/1.40-NA oil objective. The quantification of mean intensity and droplet sizes and numbers was performed using ImageJ.Measurement of the electric fieldThe electric field was measured using Di-4-ANEPPS as previously described34. Briefly, Di-4-ANEPPS (ThermoFisher) was mixed with protein samples with a final concentration of 1 µM before imaging. Confocal fluorescence images were performed on a Nikon AXR confocal microscope equipped with a 100×/1.49-NA objective. The fluorescence was excited at 470 nm and collected at both 535–545 nm and 610–640 nm. The electrical potential of condensates was calculated as the fluorescence ratio of 535–545 nm and 610–640 nm of the same condensate.Micropolarity measurementThe proteins were mixed in a 1:1 molar ratio with Halo-SBD and incubated overnight at room temperature in 40 mM Tris-HCl and 500 mM NaCl. Unlabelled dye was removed using a PD MidiTrap G-25 desalting column (Cytiva). The labelled protein was then mixed with the unlabelled protein to achieve a labelling ratio of approximately 10% to minimize potential fluorophore-induced artefacts. The mixed protein sample was treated with 1 µM TEV protease to remove the MBP tag and diluted to a final concentration of 5 µM. PEG8000 of a final concentration of 6% was added to the protein sample. An aliquot of 10 μl was transferred to the glass slide with a 500-μm spacer. A cover slip (0.17 mm) was placed on the top of the spacer. The slide was inverted and allowed to settle for 30–60 min before FLIM imaging. FLIM was performed using a Leica STELLARIS 8 FALCON microscope equipped with a pulsed white laser using 63× oil-immersion objective (Leica, HC PL Apo 63×/1.40 oil CS2). The SBD was excited at 448 nm with 10 MHz rate. Fluorescence lifetime fitting and image analysis were performed using LAS X software.Fluorescence lifetime imaging–Förster resonance energy transferProteins at a final concentration of 2.5 µM were diluted in 384-well microscopy plates and incubated for 30 min before imaging. Fluorescence lifetime imaging–Förster resonance energy transfer (FLIM-FRET) was performed using a Leica TCS SP8 laser-scanning confocal microscope equipped with a 100×/1.40-NA oil-immersion objective. The samples were scanned with a slow speed of 100 Hz with a repetition rate of 80 MHz. mGFP fluorescence was excited at 488 nm and detected at 500–540 nm using the in-built hybrid detector. A time-correlated single-photon counting (TCSPC) system was used to record photon events.All FLIM data analysis was performed using Leica LAS X FLIM FCS software. The minimum recorded photon count for modelling was 100. The recorded TCSPC photon arrival time histogram showed a multi-exponential decay. Therefore, the photon arrival times were fitted to a double-exponential reconvolution function, allowing the calculation of mean lifetime by intensity weight. A minimum of 30 regions of interest were selected for analysis. The lifetime of each group was calculated.Phylogenetic analysis of SAM8To examine the conservation of SAM8, SAM8 homologues were identified in OrthoDB (https://www.orthodb.org/). A total of 143 SAM8 homologues were identified, and 29 of them from representative species were subjected to neighbour-joining tree construction using ClustalW2. The IDRs were predicted using the IUPred2A algorithm (https://iupred2a.elte.hu/).Fluorescence recovery after photobleaching assayFRAP of SAM8 condensates was performed on a Nikon AXR confocal microscope system using a 60×/1.42 oil objective. After one acquisition, three regions of interest corresponding to SAM8-mVenus condensates were bleached at 100% laser intensity at 488 nm. Recovery was recorded for every second for a total of 68 s after bleaching. The fluorescence intensity was measured with ImageJ.Turbidity measurementsSAM8 and its variants were diluted to a final concentration of 2.5 µM in 40 mM Tris-HCl, pH 7.4, 150 mM NaCl, with or without 6% PEG, and transferred into flat-bottom 96-well plates (Corning, 3364). Turbidity of protein samples was measured at 600 nm using VARIOSKAN FLASH (Thermo).Quantitative RT-PCRTotal RNA was extracted from Arabidopsis seedlings or other tissues using TRIzol reagent (Invitrogen, 15596018). Contaminating DNA was removed using DNase I (Promega, M6101). Reverse transcription was performed by M-MLV reverse transcriptase (Invitrogen, 28025013) using oligo(dT) primer. Quantitative PCR reactions were performed using the Applied Biosystems 7500 Fast with 2×M5 HiPer SYBR Premix EsTaq (Mei5 Biotechnology, MF787-T) in a final volume of 20 μl. Actin or UBC was used as an internal control. The primers used for qPCR are listed in Supplementary Table 3.Osmotic potential measurementVapour-pressure osmometry was performed on the Vapro 5600 (ELITechGroup) system according to the instructions of the manufacturer. The instrument was allowed to equilibrate to ambient temperature overnight, and the reading stability was validated before measurements were performed. Osmometry readings were assessed for solutions of varying composition and confirmed to be normally distributed in the following tests: Anderson–Darling, D’Agostino–Pearson, Shapiro–Wilk and Kolmogorov–Smirnov. For the measurement of osmotic potential in the FLIM-FRET assay, the buffer containing 40 mM Tris-HCl, pH 7.4, 100 mM KCl was used to prepare PEG8000, NaCl, mannitol or Dextran 40 solutions. For measuring osmotic potential in the seedling treatment, a 1/2 MS liquid medium was used to prepare mannitol or PEG solutions. The water potential is calculated by osmolarity × R × T (where R is the gas constant and T is the absolute temperature).ImmunostainingImmunostaining of Arabidopsis root tip nuclei was performed as described previously11. Briefly, 7-day-old Col-0 seedlings were treated with an isosmotic buffer prepared with H2O or D2O for 15 min and fixed immediately with 4% paraformaldehyde plus 0.1% Triton X-100 in PBS buffer by applying a brief vacuum. Samples were digested with 3% cellulase R-10 and 0.3% Macerozyme R-10 (Yakult Pharmaceutical Industry) at 37 °C for 5–10 min. Root tips were then cut and squashed on a Polysine-coated slide in a drop of PBS buffer. The slide was then blocked with blocking solution (3% bovine serum albumin in PBS buffer) and incubated with primary antibody to Flag (anti-Flag, dilution by 1:2000, Merck, F1804) and secondary antibody Donkey anti-Mouse IgG (H + L) Highly Cross-Adsorbed Secondary Antibody, Alexa Fluor 488 (dilution by 1:800, Invitrogen, A-21202). After secondary antibody incubation, a drop of DAPI Fluoromount-G (Southern Biotech) was added to each slide. The slide was sealed with a coverslip and imaged with a Nikon AXR with NSPARC confocal microscope system using a 100×/1.45 oil objective. Alexa Fluor 488 was excited at 488 nm and detected at 499–550 nm, and DAPI was excited at 405 nm and detected at 429–474 nm.RNA fluorescence in situ hybridizationRNA fluorescence in situ hybridization (FISH) was performed as previously described57. Roots from 7-day-old Col-0 and sam8-1 seedlings were treated with liquid medium containing 300 mM d-mannitol for 1 h, then fixed in 4% paraformaldehyde for 15 min at room temperature under gentle vacuum. The roots were washed twice with 1× PBS, placed on a slide, and covered with a coverslip. The samples were squashed, flash-frozen for about 5 s in liquid nitrogen, and air-dried at room temperature for 30 min. The samples were then permeabilized in 70% ethanol for 2 h and washed twice with wash buffer (10% formamide, 2× SSC). A volume of 100 μl hybridization buffer (100 mg ml−1 dextran sulfate, 10% formamide, 2× SSC) containing 1 μM 5′-Cy5-dT35 probe was added to each slide and incubated in the dark chamber at 45 °C overnight. After hybridization, the samples were washed twice in wash buffer (10% formamide, 2× SSC), incubated with 100 μl of 10 μg ml−1 DAPI at 37 °C for 1 h in the dark, washed twice with wash buffer (10% formamide, 2x SSC), and imaged by Zeiss LSM880 microscope system using a 100×/1.45 oil objective. The probe sequences used in this study are provided in Supplementary Table 3.Mass spectrometry and data analysisMass spectrometry was performed as described previously18. Briefly, the protein samples were separated by SDS-PAGE and digested in-gel with trypsin (0.5 ng μl−1). The peptides were extracted from gel slices, separated by HPLC, and sprayed into an LTQ Orbitrap Elite System mass spectrometer (Thermo). A database search was performed on the MASCOT server (Matrix Science) against the IPI (International Protein Index) Arabidopsis protein database. The relative amount of each protein was determined by label-free quantification. The 35S::YFP-TurboID/Col-0 data were used as a background control. Proteins with an adjusted P < 0.05 and fold change ≥2 were considered as being enriched by SAM8.Co-immunoprecipitationApproximately 5 g of Nicotiana benthamiana leaves co-expressing SAM8-GFP and other Flag-tagged proteins were ground into fine powder in liquid nitrogen. The powder was lysed with 10 ml lysis buffer (20 mM Tris-HCl, pH 7.4, 150 mM NaCl, 4 mM MgCl2, 0.5% NP-40, 5 mM DTT, 1× protease inhibitor cocktail, 1 mM PMSF) at 4 °C for 30 min. After filtration through Miracloth (Millipore, 475855-1RCN) and brief centrifugation, the supernatant was incubated with 10 μl of GFP-Nanoab-Magnetic Beads (LABLEAD, GNA-50-1000) for 30 min at 4 °C. The beads were washed four times with lysis buffer and boiled in SDS loading buffer. The immunoprecipitates were subjected to western blot analyses.Western blot analysisProtein samples were resolved by SDS-PAGE and transferred to PVDF membranes. Antibodies against GFP (anti-GFP, dilution by 1:7000, 11814460001, Roche) and Flag (anti-Flag, dilution by 1:2000, F1804, Sigma/Merck) were used as primary antibodies. After the primary antibody incubation, horseradish peroxidase (HRP)-conjugated secondary antibodies Goat Anti-Mouse IgG, HRP Conjugated (dilution by 1:10,000, CWBIO, CW0102) were used for protein detection by chemiluminescence (Thermo, 34095).Bimolecular fluorescence complementationBiFC assays were performed as described previously58. Briefly, the Agrobacterium cells were resuspended in infiltration buffer (10 mM MgCl2, 10 mM MES, pH 5.7 and 100 μM acetosyringone) to an OD600 of 1.0. The cells containing BiFC pairs were mixed in equal ratios and infiltrated into N. benthamiana leaves. Two days after infiltration, N. benthamiana leaves were imaged under a Zeiss 880 confocal microscope. The whole procedure was repeated independently at least three times.Ribo-seq, RNA-seq and data analysisTen-day-old seedlings were treated with or without 300 mM d-mannitol for 1 h and divided into two groups for Ribo-seq and RNA sequencing (RNA-seq) analysis, respectively. For mRNA-seq, total RNA was purified with oligodT-beads to obtain polyA+ mRNAs. RNA-seq libraries were constructed using the NEXTflex RNA-Seq Kit (Bioo Scientific). Briefly, RNAs were fragmented and reverse-transcribed to produce the first and second strands of cDNA. The cDNA was purified and ligated with DNA adapters. The ligated DNA was used as a template for PCR amplification using primers specific to adaptors. The resulting PCR products were purified using AMPure XP beads and sequenced on the Illumina NovaSeq 6000. Raw sequencing data were filtered by fastp20 (v.0.19.7) to remove low-quality reads (reads with more than 50% nucleotides having a phred score ≤5, or reads with more than 10% unmapped nucleotides). The cleaned reads were mapped to the TAIR10 reference genome using HISAT2 (v.2.2.1). Read pairs were assigned to CDS of TAIR10 genes using featureCounts (v.2.0.6). Differential gene expression analysis was performed using the DESeq2 R package (v.1.42.0).For Ribo-seq, samples were fast-frozen and ground in liquid nitrogen. The resulting fine powder was resuspended in lysis buffer (20 mM Tris-HCl pH 7.4, 150 mM NaCl, 5 mM MgCl2, 1 mM DTT, 100 μg ml−1 cyclohexane, 1% Triton X-100, 25 U ml−1 DNase I). The lysate was treated with nonspecific endoribonuclease RNase I. Isolation of monosomes was performed by size-exclusion chromatography with MicroSpin S-400 HR columns (Cytiva, 27-5140-01). Ribosome-protected fragments (RPFs) were isolated from monosome fractions and subjected to rRNA depletion using QIAseq FastSelect –rRNA Plant Kit (Qiagen, 334315). Following PAGE purification, both ends of RPFs were phosphorylated and ligated with 5′ and 3′ adapters, respectively. The purified RNA fragments were reverse-transcribed into cDNAs and amplified by PCR. After library construction using NEBNext Multiplex Small RNA Library Prep Set for Illumina (Set 1) (NEB, E7300S), the concentration of DNA was measured by Qubit 2.0 Fluorometer and adjusted to 1 ng μl−1. After quality control of the insert size and concentration using Agilent 2100 Bioanalyzer and quantitative PCR, the library was sequenced on the Illumina platform.For Ribo-seq data analysis, low-quality reads were filtered by in-house scripts. Reads mapped to rRNA and tRNA by Bowtie (v.1.1.2) were discarded. Cleaned reads were mapped to the TAIR10 genome using TopHat2 (v.2.0.12). Mapped reads were assigned to CDS of TAIR10 genes using HTSeq (v.0.9.1). The fold changes of RPFs were determined by edgeR25 (v.3.24.3) using the quasi-likelihood method. TE was calculated as the ratio of Ribo FPKM to total mRNA RPKM. Genes with a 1.2-fold change and a P < 0.05 were identified as significantly changed genes. The clusterProfiler (v.4.8.1) was used for functional enrichment analyses in NovoMagic.Polysomal profiling and analysisPolysome profiling was performed as previously described59 with minor modifications. Five-day-old seedlings (about 0.2 g per sample) were treated with or without 0.3 M Mannitol for 1 h, ground into fine powder in liquid nitrogen, homogenized in 0.8 ml pre-chilled polysome extraction buffer [200 mM Tris-HCl, pH 9.0, 200 mM KCl, 35 mM MgCl2, 25 mM EGTA, 1% sodium deoxycholate, 1% detergent mix (20% Briji, 20% Triton X-100, 20% Igepal CA630, 20% Tween 20), 1% polyoxyethylene 10 tridecyl ether (PTE), 5 mM DTT, 1 mM PMSF, 50 μg ml−1 cycloheximide, 50 μg ml−1 chloramphenicol, and 100 U ml−1 RNasin ribonuclease inhibitor (Promega)], and incubated on ice for 20 min. The resulting slurry was centrifuged at 13,000 rpm, 4 °C for 15 min. A total of 100 μl of the resulting supernatant was saved for total mRNA isolation. Another 700 μl was loaded on top of a pre-chilled 10–50% sucrose gradient (10× sucrose salt buffer: 400 mM Tris-HCl, pH 8.4, 200 mM KCl, 100 mM MgCl2) and centrifuged in a Beckman SW41Ti rotor at 33,500 rpm for 3 h at 4 °C. The absorbance of separated subunits, monosomes and polysomes was detected at UV260, and 14 fractions were collected using a gradient fractionator (Biocomp). Polysomal RNAs were isolated from the mixed polysomal fractions (fractions 9–14) using the TRIzol/chloroform method. The translational efficiency was calculated as the ratio of RNA level in polysomal fractions compared with total transcripts by quantitative RT-PCR.StatisticsStatistical analysis was performed using either an unpaired two-tailed Student’s t-test or a one-way analysis of variance, followed by the least significant difference test. For the statistical significance of the interaction between two factors, Shapiro–Wilk and Levene’s tests were used to assess normality and homogeneity, respectively. A two-way analysis of variance with Tukey’s post hoc analysis was performed (α = 0.05). Statistical details of experiments are specified in the figure legends. The fluorescence intensity was measured with ImageJ. All statistical analyses were performed in IBM SPSS Statistics v.19.Reporting summaryFurther information on research design is available in the Nature Portfolio Reporting Summary linked to this article.
Cellular water-potential sensing through biomolecular condensation - Nature
Plants sense water deficiency through SAM8 protein condensation, which responds to reduced hydration and triggers stress adaptation by altering RNA export and gene translation.
14,471 words~66 min read