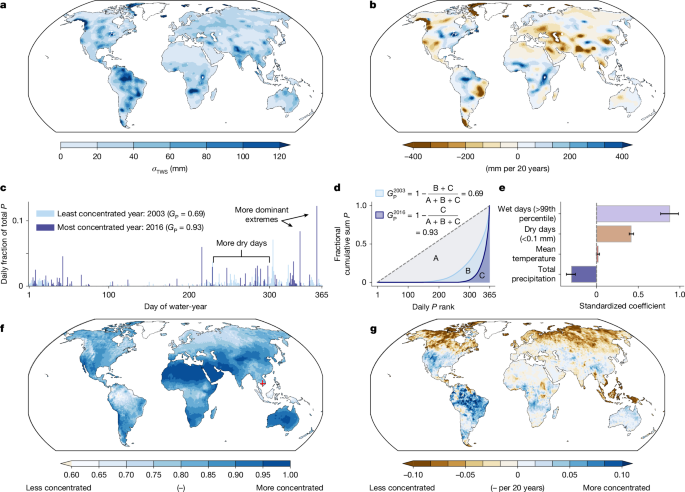
MainThe land water balance is essential for the well-being of ecosystems and people1,2. Yet, its future is uncertain because of sparse observations and a lack of theory unifying climate and hydrologic changes11,12. Although water availability emerges from the balance of mean precipitation and evaporation, a key uncertainty resides with how warming-forced changes to the character and distribution of daily precipitation will alter the long-term land water balance. The right-skewed daily precipitation distribution means a minority of days contribute most to annual precipitation13. At the same time, the highest percentiles of this distribution are over three times more sensitive to warming than annual mean precipitation itself (>7% K−1 compared with about 2% K−1)5,14. The asymmetry in the precipitation distribution and its unequal response to warming implies a concentration of rain and snow into fewer, more intense and localized events, separated by longer dry intervals, with ambiguous implications for terrestrial water availability5,6,7,8,9,15,16.Debates over future aridity tend to focus on the climatological precipitation–evaporation balance3,4, whereas research on the impacts of precipitation intensification generally centre on flood risks17,18. Yet precipitation concentration could exert an important control on the climatological land water balance by reshaping hydrologic partitioning of rain and snow into rivers, soils and vegetation. Saturation and infiltration excess runoff on the land, for example, can be controlled by the duration and intensity of rainfall, whereas the dry intervals between rain events articulate the energetic space for evapotranspiration. Experimental treatments in a US grassland, for example, found reduced soil moisture in response to more concentrated watering19, whereas daily rainfall variability affected satellite vegetation indices over 42% of vegetated lands20. But the extent, spatial pattern and magnitude of the impact of precipitation concentration on climatological water availability, both historically and in future climates, remain unknown.We analyse the observational relationship between satellite-derived annual-scale terrestrial water storage (TWS) anomalies and precipitation concentration estimated by a Gini coefficient with multiple precipitation datasets21,22,23. The annual Gini coefficient of daily precipitation quantifies how evenly precipitation falls over a year. Our empirical models demonstrate that precipitation concentration reduces continental water availability across all climates globally. The magnitude of the drying effect of concentration on TWS variability rivals the effect of total annual precipitation itself, suggesting a first-order control of precipitation concentration on the land water balance, beyond the long-term balance between precipitation and evapotranspiration.Using a simple land-surface model that captures the nonlinear behaviour among energy and moisture, we then reproduce our empirical results and show that precipitation concentration enhances evaporation through changes in surface hydrologic partitioning and increased shortwave radiation between precipitation events—consistent with first-principles of land–atmosphere interactions. These observed and idealized results are also consilient with the response in more complex land-surface components of Earth system models. Finally, we combine our empirical model with observed and projected concentration trends to estimate historical and future TWS impacts. Wherever possible, we rely on observations given known deficiencies in daily precipitation simulation by global atmospheric models. Our findings indicate that the utility of precipitation for land water availability depends as much on its high-frequency distribution as on its annual total and that this utility decreases under warming.Terrestrial water and precipitation concentrationSince 2002, the Gravity Recovery and Climate Experiment (GRACE) satellite has provided a record of TWS anomalies, capturing observed variations of water held in soils, aquifers, vegetation and surface bodies24,25 (Fig. 1a). The emergent climatological record from GRACE has positioned analyses on drivers of the land water balance26,27 and its couplings to wider ecosystem processes28 and climate feedbacks29. The interannual standard deviation in TWS (σTWS) ranges between approximately 10 mm and 100 mm across global land areas (Fig. 1a), whereas its 2002–2022 long-term trends are of mixed sign spatially (Fig. 1b). The ice-loss-driven declines in Patagonia, Alaska, the Himalaya and the Arctic Cordillera (around 500 mm over 2002–2022); wetting in the Sahel and Amazon (about 300 mm)30; and groundwater depletion in northern India and the North China Plain31 are evident. For our subsequent analyses, we remove these long-term trends to isolate interannual variability. We also omit Greenland and Antarctica because of the dominant influence of their ice caps.Fig. 1: Trends and variability in TWS and rainfall concentration.The alternative text for this image may have been generated using AI.Full size imagea, Standard deviation of detrended water-year mean TWS from GRACE satellite observations25, over 2002–2022. b, Linear trend in water-year mean GRACE TWS over 2002–2022, shown as change per 20 years. c, Illustrative daily precipitation time series from Phnom Penh, Cambodia, for water-years 2003 (light blue) and 2016 (dark blue), the years with maximum and minimum daily precipitation concentrations, respectively, in the study period as quantified using the Gini coefficient. Data are from the Climate Prediction Center (CPC)22. Annotations indicate contrasting features of concentration in 2016 compared with 2003. d, Lorenz curves (fractional cumulative sum of ranked daily precipitation) for the two time series in a (light and dark blue). The grey dotted line shows the hypothetical Lorenz curve for equal daily precipitation. The daily precipitation Gini coefficient (GP) is calculated from the shaded integrals A, B and C, as annotated. e, Global dependence over 2002–2022 among interannual variations in GP and key hydroclimate variables, including extreme precipitation days (exceeding the 99th percentile of climatological nonzero daily precipitation), dry days (days with less than 0.1 mm precipitation), annual mean 2 m air temperature and annual total precipitation. Error bars show the range of estimates across three precipitation data products. f, Mean GP over 1980–2022, with the location of Phnom Penh indicated with a red cross. g, GP trends over 1980–2022, expressed as changes per 20 years. Data shown in f and g averages across the CPC, Global Precipitation Climatology Center (GPCC)23 and Global Precipitation Climatology Project (GPCP)21 daily precipitation datasets; results for individual data products are shown in Extended Data Fig. 3. Base map adapted from Natural Earth (https://www.naturalearthdata.com).To assess daily-scale precipitation concentration and its change over time, we adapt the Gini coefficient (originally used in economics to assess income inequality) to summarize the inequality in the daily distribution of annual precipitation across three precipitation datasets (Fig. 1c,d). The daily-scale precipitation Gini coefficient (GP) ranges from 0 (equal daily precipitation) to 1 (all precipitation falling in a single day). We illustrate its calculation and interpretation for Phnom Penh, Cambodia, because of the stark difference between its least (2003, GP = 0.69) and most (2016, GP = 0.93) concentrated year in our study period (Fig. 1c,d). The high concentration in 2016 is evident from longer dry periods, higher mean event intensity and the dominance of extreme events (>5% of annual precipitation, Fig. 1c). The fractional sorted cumulative sum of these time series forms their Lorenz curves (Fig. 1d, light and dark blue), with annual GP defined as the area between the Lorenz curve and the one-to-one line of perfect equality (Fig. 1d, grey dotted line).Globally, interannual GP variation is strongly and statistically significantly associated with both wet days (>99th percentile) and dry days (<0.1 mm, P < 0.001; Fig. 1e). Precipitation concentration is ubiquitously negatively related to total precipitation (P < 0.001; Fig. 1e and Extended Data Fig. 1), but shows little dependence on mean temperature. The three observational precipitation datasets agree on these drivers (Fig. 1e). Although precipitation on Earth is generally quite concentrated13, its spatial variation falls along climate classes, with less concentration in humid regions (high latitudes, deep tropics, GP ≈ 0.7) and more concentration in deserts (GP ≈ 1; Fig. 1f and Extended Data Figs. 2 and 3). Since the 1980s, GP trends are of mixed sign, decreasing to be less concentrated in high latitudes and in Southeast Asia, but increasing in the western USA, northern South America and Central Africa5,8,16 (Fig. 1g and Extended Data Fig. 3). Reduced concentration in the northern high latitudes is consistent with strong mean annual precipitation increases much closer to the intensity scaling rates32, which enable intensification without increased intermittency.Drying effect of precipitation concentrationWe expect that higher GP values are associated with lower TWS, as hydrologic partitioning preferences evapotranspiration to the detriment of soil and land water recharge. More intense precipitation is more likely to exceed soil infiltration capacity, increasing ponded surface water, a more easily evaporable pool. Furthermore, evaporation from such surface water stocks is enhanced by longer dry spells, attendant high incident shortwave radiation and lower surface resistance to evaporation compared with over soils and vegetation.To test these hypotheses, we use a panel regression model with fixed effects commonly used in causal inference. We link observed interannual variation in TWS to that for GP, with controls for annual total precipitation and mean temperature to isolate the influence of rainfall concentration absent other drivers of TWS variability (Fig. 1e). Our fixed-effects regression model interacts GP with average total precipitation to explicitly assess variation in the effect of GP on TWS across the global aridity gradient. It also controls both for unobserved spatially varying factors that might be consistent across time (such as land surface properties or groundwater usage) and any time-varying shocks or trends that are common across all places (such as modes of variability such as El Niño–Southern Oscillation or anthropogenic warming). As such, the identification strategy we use characterizes the relationship between GP and TWS anomalies conditioned on mean precipitation, providing an estimate of the causal relationship between the two (Methods).Higher GP is statistically significantly associated with negative TWS anomalies across all climatological precipitation values globally, indicating a drying effect of precipitation concentration on water availability (Fig. 2 and Supplementary Table 2). Standardizing the effects across terms shows that the GP effect is comparable—but of opposite sign—to the effect of total annual precipitation itself (\(-0.16{\sigma }_{\mathrm{TWS}}/{\sigma }_{{G}_{{\rm{P}}}}\), compared with \(0.2{\sigma }_{{\rm{T}}{\rm{W}}{\rm{S}}}/{\sigma }_{{\rm{P}}}\) at the global population-weighted climatological mean precipitation of 1,000 mm) (Fig. 2a). Furthermore, the drying effect of GP is about three times larger than that of temperature. These results are consistent across the three precipitation datasets, indicating a robust, leading-order influence of the distributional character of precipitation—irrespective of its annual total—on TWS.Fig. 2: Land-drying effect of more concentrated precipitation.The alternative text for this image may have been generated using AI.Full size imagea, Standardized regression coefficients of water-year total precipitation (dark blue), mean 2 m air temperature (red) and daily rainfall Gini coefficient (GP, light blue) anomalies on GRACE TWS25 anomalies. The effect of GP on TWS, being conditional on climatological mean precipitation, is shown for mean precipitation of 1,000 mm (the global population-weighted mean). Error bars show 2 standard errors of the estimate. b, Marginal effect of GP on TWS, conditional on mean precipitation, for three precipitation data products. Shaded areas show 2 standard errors of the estimate. c, Marginal GP effects on TWS estimated at the scale of HydroSHEDS main river basins51, averaged across the three data products. Results for individual data products are shown in Extended Data Fig. 5. Effects are significant at P < 0.05 and of like sign across in at least two of the three data products, except in hatched basins. Base map adapted from Natural Earth (https://www.naturalearthdata.com).The magnitude of the GP effect on TWS varies with climatological mean precipitation, with larger magnitudes of TWS loss from precipitation concentration in wetter climates (Fig. 1b). However, the drying effect of precipitation concentration is universally and significantly negative, ranging from about 10 mm to 30 mm per 10 percentage-point change in GP (0.1ΔGP) in deserts to about 20–130 mm per 0.1ΔGP in very humid climates. At 1,000 mm of annual mean precipitation, the effect is 16–49 mm per 0.1ΔGP (Fig. 2b, vertical dotted line). Comparing these absolute estimates to the interannual standard deviation of TWS (of the order of 10–100 mm; Fig. 1a), the drying effect of GP is substantial, ranging from 0.4 to nearly 3 standard deviations (σTWS) per 0.1ΔGP (Extended Data Fig. 4). When normalized by TWS variability, the relative GP effects on TWS are larger in arid (mean annual precipitation <500 mm) and very humid (>2,000 mm) climates, and smaller in humid climates (500–2,000 mm per year; Extended Data Fig. 4).We find consistent drying effects of GP on TWS even when the empirical model is instead estimated at the river basin scale on which hydrologic mass closure occurs (Fig. 2c and Extended Data Fig. 5). Across the three precipitation datasets, GP effects on TWS are statistically significant across 84% of global river basins, 80% of which are negative. Some of the most economically and ecologically important global river basins exhibit a drying effect of rainfall concentration, including the Amazon, Nile, Mississippi, Ganges and Yangtze. However, we note a few exceptions in which more concentrated rainfall increases TWS, notably in the Lake Chad and Volta basins.Irrigation has influenced TWS locally, particularly as groundwater extraction has intensified in recent decades. We find a localized influence of interannual variation in irrigation on the GP effect on TWS. The drying effect of GP is amplified in the most intensively irrigated regions (≥10% of area equipped for irrigation; Extended Data Fig. 6a, darker blue lines), but TWS effects are indistinguishable from the global average over the 95% of land area that is not intensively irrigated (<10% of area equipped for irrigation; Extended Data Fig. 6a, lighter blue lines). We find no significant relationship between TWS effects and area equipped for irrigation at the river basin scale (Extended Data Fig. 6b). These results suggest that more concentrated precipitation dries the land globally as an intrinsic feature of hydroclimate, irrespective of irrigation. However, farmer responses to drying may locally amplify this drying by groundwater extraction.Mechanisms of land dryingTo explain the drying effect of precipitation concentration on TWS, we analyse how key water and energy budget terms depend on GP within our empirical framework (Fig. 3). Concentration necessarily implies increased dry days between precipitation events (Fig. 1e); it also implies higher net surface shortwave radiation overall, a response we confirm in the annual mean using the GEWEX-SRB and NASA-EBAF radiation budgets (the average effect across these two datasets is shown in Fig. 3a). The average water-year marginal effect of GP on shortwave radiation ranges from 1 W m−2 to 10 W m−2 per 0.1ΔGP and is statistically significant in climates with annual precipitation up to about 2,000 mm, beyond which its effects are ambiguous, probably because of ubiquitous daily precipitation in those humid climates.Fig. 3: Mechanism of concentration effects on TWS.The alternative text for this image may have been generated using AI.Full size imagea, Dependence of water-year mean net surface shortwave (SW) radiation on the daily rainfall Gini coefficient (GP), conditional on climatological mean precipitation. b, Marginal GP effect on TWS controlling for shortwave radiation anomalies, to isolate the effect of temporal precipitation distribution, averaged across the three precipitation data products (blue line). The full GP effect on TWS from Fig. 2 is shown in black, for comparison, with dotted lines showing full range covered by 2 standard errors of the estimate across data products. c, Intensity-partitioning effect contribution to the full effect of GP on TWS, estimated as the ratio of median distribution to full effects, for the mean of the three precipitation data products (thick solid line) and individually. In a–c, the average effect across the GEWEX-SRB52 and NASA-EBAF53 radiation budget datasets is shown; results for individual data products are shown in Supplementary Fig. 1. d, Marginal effect of GP on water-year total simulated evaporation (ET) from GLEAM54, conditional on climatological mean precipitation. The shaded areas in a, b and d show 2 standard errors of the estimate.The number of dry and heavy precipitation days both increase during higher-GP years, suggesting at least two mechanisms by which concentration affects the land water balance. The first mechanism is radiative: additional dry days allow more shortwave radiation (a key driver of evaporation) to reach the surface, regardless of changes in precipitation intensity. The second mechanism relates to the impact of the temporal distribution of the precipitation on hydrologic partitioning, with intensified precipitation favouring the partitioning of water to more evaporable reservoirs. To isolate this latter intensity-partitioning effect, we regress TWS on GP while controlling for shortwave radiation anomalies, effectively removing the covarying impact of additional dry days. We then compare this effect to the full TWS effect from Fig. 2b, which includes both the radiative and intensity-partitioning effects (Fig. 3b and Supplementary Fig. 1).The intensity-partitioning effect of GP on TWS through changes in hydrologic partitioning is statistically significant and negative in all but the most humid climates in which climatological precipitation exceeds 3,000 mm (Fig. 3b, blue line and shaded interval). This intensity-partitioning effect accounts for nearly all of the full GP–TWS effect (Fig. 3b, black lines) in arid climates, but weakens with increasing climatological precipitation (Fig. 3b,c). This result highlights that the radiative effect is minimal where evaporation is limited by water and sizeable where evaporation is limited by energy, consistent with theory33,34. Nevertheless, changes in hydrologic partitioning from precipitation intensity are more important than the additional shortwave radiation across all climates, accounting for more than 50% of the full effect (Fig. 3c). The weaker relative contribution of radiative anomalies is, in part, a function their small magnitude (of the order of 1% of annual mean insolation; Fig. 3a). These results are consistent across the GEWEX-SRB and the NASA-EBAF radiation budgets individually, although the tendency for greater dominance of the intensity-partitioning effect in more arid climates is clearer in the former (Supplementary Fig. 1).Thus, the drying effect of more concentrated precipitation is mainly attributable to its arrival at the surface in more intense but more intermittent bursts, with likely attendant changes in surface precipitation partitioning, regardless of the fact that greater intermittency implies sunnier conditions on average. In short, the time distribution of daily rainfall itself is chiefly responsible for the drying effect of GP, whereas the consequent radiative effects are secondary, but gain importance in wetter (more energy-limited) climates.As reliable evaporation observations are not globally available, we analyse simulated evaporation from the Global Land Evaporation Amsterdam Model (GLEAM) to assess whether evaporation explains the drying effect of GP on TWS. We find some support for our proposed positive relationship of GP and evaporation: two of three datasets are consistent with expectations, showing significant evaporation increases (about 10–200 mm per 0.1ΔGP) in subhumid to humid climates. In very arid regions, in which evaporation is always water-limited, evaporation shows small annual-scale decreases (Fig. 3d), suggesting even more water-limited conditions. However, as GLEAM incorporates reanalysis-based precipitation data with known biases, we interpret these results cautiously. Still, these results indicate that heightened evaporation may plausibly drive GP-induced TWS drying, especially outside arid zones.Because of the observational limits to identifying culpable mechanisms, we also test whether enhanced evaporation causes GP-induced TWS drying using an idealized land-surface model forced with observed daily precipitation and shortwave radiation data (Extended Data Figs. 7 and 8). The model, which simulates the land water balance given nonlinear interactions between energy and water at the land–atmosphere interface, is run at about 1,500 grid points to sample across the observed global climatological precipitation gradient. The simulations position a direct comparison to our observationally derived effect of GP on TWS (Fig. 4a–c). Our experimental approach is to identify the minimal physics required to reproduce the observed effect and to facilitate a scrutable diagnosis of culpable mechanisms. These goals are difficult to achieve in more complex land-surface models, in which the many processes and parameters forced with transiently evolving climate make it difficult to assess the drivers of a given response. However, we also analyse land-surface reanalyses from more complex land-surface models, finding consistent responses (Fig. 4d).Fig. 4: Drying effect of precipitation concentration in land-surface simulations.The alternative text for this image may have been generated using AI.Full size imagea, Effect of daily precipitation Gini coefficient (GP) on TWS, as simulated by an idealized land-surface model at a sample of around 1,500 grid points across the mean annual precipitation distribution (solid blue line). The dotted blue lines show 2 standard errors of the estimated fit between the TWS effect and climatological mean precipitation. The shaded dark and light orange areas show the 5th–95th and 25th–75th percentile ranges of the same simulated effects across a 243-member perturbed-parameter ensemble. The black lines show the full empirical TWS effect from Fig. 2b, averaged across the three precipitation data products, for comparison. b, GP effect on key water budget terms, including evaporation from surface water reservoirs (green), surface ponding rate (precipitation less infiltration, light blue), runoff (dark blue) and land evaporation (brown). c, Schematic visualizing the same GP effects on water budget terms as in b, on average across the mean annual precipitation domain. d, GP effect on TWS, as simulated by the MIROC6 and CNRM-CM6-1 climate models under the land-hist experiment (land component of the models forced by observations, 1960–2014) from the Coupled Model Intercomparison Project, phase 6, Land Surface, Snow and Soil Moisture Model Intercomparison Project (CMIP6-LS3MIP)55.Our simulated TWS response to precipitation concentration (Fig. 4a; blue lines) recovers the observed effect from Fig. 2b (Fig. 4a, black lines), with both sets of confidence intervals overlapping for all climatological precipitation values. Tracking water budget terms in our idealized land model (Fig. 4b,c) supports the evaporation-driven mechanism suggested by our empirical analysis (Fig. 3). In higher-GP years, more precipitation ponds at the surface (light blue curve, QS), and this surface excess water readily evaporates (green curve, EL) rather than running off the land (Fig. 4b, dark blue curve, QL, and Extended Data Fig. 7). At the same time, reduced infiltration suppresses soil evaporation (ES, brown curve), but not enough to offset increased evaporation from the simulated surface water stock (ML, Fig. 4b). As a result, total evaporation (ΔE = ΔES + ΔEL) increases in higher-GP years (about 240 mm per 0.1ΔGP; Fig. 4b,c), in general agreement with empirical results from GLEAM (Fig. 3d).We explore the sensitivity of these results by jointly perturbing all of the free parameters in the idealized model, producing about 365,000 simulations. The perturbed-parameter ensemble shows that the consilience between our empirical and process-based models is insensitive to parameter choices (Fig. 4a, orange shaded areas). A variance-based decomposition of parametric uncertainty emphasizes the importance of the geometry parameters controlling the depth and area of the surface water stock—these two parameters account for approximately 99% of the modelled variance in TWS drying (Supplementary Fig. 3). The magnitude of TWS drying is, therefore, most sensitive to the spatial extent of ponded surfaces after heavy rain events, reflecting the dominant role of GP in shaping hydrologic partitioning at the surface and driving evaporation from surface water stocks. However, the overall drying effect of GP remains robust across all tested surface geometries.We also find a consistent GP effect on TWS in the more complex land-surface components of the MIROC6 and CNRM-CM6-1 climate models, forced by historical observations (Fig. 4d). This suggests that climate models may accurately capture the TWS effect in future hydroclimate projections, provided they reliably simulate daily precipitation variability in fully coupled mode. Most fundamentally, the consilience among our observational, idealized and full-complexity model results indicates that more concentrated precipitation dries the land by partitioning water into easily evaporated pools through saturation- and infiltration-excess processes. Our simple land model reproduces empirical drying effect of the precipitation concentration on the land, indicating that its mechanism is traceable to elementary land-atmosphere dynamics.Past and future implicationsObserved GP trends have affected TWS over recent decades (Fig. 5 and Extended Data Fig. 3). We estimate this impact by convolving the historical GP trend field (around 1980–2022; Fig. 1g) with our empirical GP–TWS relationship (Fig. 2b). The results reflect the spatial pattern of GP trends (Fig. 5a), with slightly more (about 5%) of the global population experiencing GP-driven drying than GP-driven wetting (Fig. 5a, inset). As these results are based on detrended anomalies of the same data, the GP-driven effects are already embedded in long-term TWS trends. As such, our results indicate that increasing precipitation concentration has, for example, partly offset wetting trends in Amazonia and worsened drying trends in southeastern Brazil (Figs. 1b and 5a).Fig. 5: Historical and projected future impacts of precipitation concentration on TWS.The alternative text for this image may have been generated using AI.Full size imagea, Estimated TWS change inferred from GP trends and the historical dependence of GP on TWS, averaged across the CPC, GPCP and GPCC (refs. 21,22,23) precipitation datasets and expressed as total change over 1980–2022. b, Future TWS change from precipitation concentration under an additional 1 °C of warming beyond present, projected based on a simply thermodynamic precipitation intensification model forced by local mean annual warming. In a,b, the inset histograms show global population exposure to standardized TWS changes. Base map adapted from Natural Earth (https://www.naturalearthdata.com).Although historical GP-driven TWS impacts are mixed, continued warming should further concentrate precipitation into fewer, heavier events5,8. Using a simple thermodynamic model of precipitation intensification (Methods), we estimate GP changes under 1 °C of additional warming (about 2 °C above pre-industrial temperatures; Extended Data Fig. 9). We then combine these changes with our empirical model to project future mean TWS changes under future precipitation concentration. Our approach assumes that current irrigation practices hold into the future; yet the association between historical irrigation and TWS suggests that future irrigation intensification and expansion would exacerbate projected TWS drying, whereas increased irrigation efficiency could alleviate it (Methods and Extended Data Fig. 6a,b). Although the future balance of these effects over irrigated lands is unknown, they will all occur against a backdrop of physically based GP-driven TWS drying.We project widespread relative TWS reductions from future rainfall concentration alone, with 50% of the global population experiencing drying of ≥1/3σTWS and 27% of people experiencing drying of ≥1/2σTWS, which is roughly equivalent to a mean shift to abnormally dry conditions10 (Fig. 5b). Key regional impacts include intensified drying in Amazonia, a reversal of wetting in Southeast Asia and boreal drying that could counteract projected precipitation increases. Beyond water availability concerns, these changes may influence carbon-cycle and land-atmosphere feedbacks governing climate responses to greenhouse forcing29,35.DiscussionDebates over future terrestrial water availability have generally focused on projected long-term changes in mean total precipitation and evaporation. Our findings advance this framework by showing that the character of the daily precipitation distribution itself exerts a first-order influence on TWS, independent of total precipitation. The concentration effect—encompassing both radiative and hydrologic partitioning changes—reduces the water retained on land almost as much as total precipitation increases it. These results reframe aridity beyond cumulative fluxes, highlighting the role of land-surface processes and their interaction with warming-induced precipitation concentration in integrating daily precipitation variability.The drying effect of precipitation concentration arises primarily from increased evaporative losses, as shown in both observations and land model simulations. Intense precipitation can exceed soil infiltration capacity, accumulating at the surface where lower aerodynamic resistance increases evaporation, particularly during longer and sunnier dry periods. Enhanced evaporation explains why higher-GP years are not warmer (Fig. 1e) despite increased shortwave radiation (Fig. 3a). Although shortwave radiation anomalies contribute to enhanced evaporation, the temporal distribution of daily precipitation largely explains the drying effect of concentration. Further clarity on the nature of evaporation responses to precipitation concentration may be obtained in future research through further analysis of sub-annual timescales and in situ observations from flux towers (Supplementary Fig. 2), soil moisture probes and gauged catchments.Despite increased surface ponding, our results show no significant total runoff response to precipitation concentration. This contrasts with basin-scale studies, and is probably due to differences in scale and how hydrologic budget terms are classified. For example, some models count ponded water as surface runoff, whereas our approach considers it a distinct internal water flux, one that preferentially evaporates before export downstream36,37 (Fig. 4b,c, Methods and Extended Data Fig. 7). In arid regions, inconsistencies between empirical and modelled evaporation responses suggest unresolved complexities in dryland hydrology, warranting further investigation. Nevertheless, our results point to the importance of overland flow and its associated evaporation for TWS variability in the context of hydrologic intensification, challenging prevailing hydrologic theory38,39.The global TWS effect that we identify seems to be an intrinsic feature of the physical climate system that is also amplified by feedbacks from human irrigation water use. More concentrated precipitation dries the land most strongly in intensively irrigated areas (about 5% of land area in our sample; Extended Data Fig. 6a), including the North China and Gangetic Plains and the Mississippi and Nile Deltas. At the same time, the global TWS effect is observed over land areas with little or no irrigation (about 95% of our sample; Extended Data Fig. 6a), indicating that it is an independent effect borne of land-atmosphere dynamics. Where this physical effect occurs over heavily irrigated areas, it intensifies irrigation water use, further depleting TWS locally.Collectively, our results indicate that precipitation concentration shapes long-term hydrologic trends, but several important areas for work remain. First, our water-year scale analysis does not account for snow and ice, despite their important role in seasonal water storage and potential concentration of snowfall under warming40,41. Second, although soil characteristics and land-use changes likely modulate precipitation partitioning across regions, our analysis can only control for their aggregate impacts using fixed effects because of limited observations42. Complex land-surface models run with varying land use and land cover changes could help explain how such boundary conditions shape the TWS response. Third, although intense rainfall events or flooding can recharge groundwater43, our results can only indicate that these gains are insufficient to offset increased evaporative losses, or localized to a few specific basins (Fig. 2c). Fourth, we do not separate transpiration from evaporation, but vegetation responses to the radiative and partitioning facets of precipitation concentration probably contribute to the TWS effect20,44,45,46. Finally, future analyses should explore how the seasonality and surface moisture memory of concentration influence TWS responses to GP (refs. 47,48). Although antecedent dry conditions increase soil storage, they can also induce hydrophobicity that limits infiltration. That we detect a consistent TWS response without an explicit antecedent soil moisture control suggests that, on average, more concentrated precipitation reduces TWS regardless of previous moisture conditions. Any influence of antecedent moisture is probably picked up by our temperature and precipitation controls or is comparatively small.We show that precipitation concentration has already influenced TWS trends, notwithstanding the continued impact of total annual precipitation variability49. As concentration increases nonlinearly with continued warming, its effect on TWS is likely to become larger and more negative in the future, weighing the scales towards drying irrespective of local changes in annual precipitation. Although the sign of forced annual precipitation changes remains uncertain over many land areas, precipitation concentration consistently increases with warming, and its effect on TWS is ubiquitously negative. Our results may thus serve as a new basis for reducing uncertainty in land water availability projections, beyond a reliance on uncertain long-term precipitation changes50.At present, the theories of hydrologic response to climate change do not adequately capture the links we identify between the daily precipitation distribution, shortwave radiation, evaporation and the land water balance. Precipitation concentration arises from the differing responses of daily and annual precipitation to warming. Consequently, changes in dry day frequency, precipitation intensity and solar radiation are inherently coupled by cloud and land-atmosphere feedbacks, and jointly shape the surface supply of and atmospheric demand for evaporable water. A more complete theory would integrate these land-atmosphere processes alongside the long-term precipitation–evaporation balance. Our study provides an observational basis for such a theory, which could serve as a valuable counterbalance to the growing complexity and decreasing interpretability of Earth system models11.MethodsDataTWS data come from the GRACE and GRACE-FO mass concentration solutions (RL06) developed by the Center for Space Research at the University of Texas25. The dataset represents monthly total water mass variations (expressed as equivalent water height) at a gridded resolution of 0.25°. We omit data before August 2002 (due to sensor calibration at the outset of the GRACE mission) and for water-year 2017 (due to incomplete data during the mission gap between GRACE and GRACE-FO). We use GRACE TWS because it is an observational data product that holistically measures land water, capturing all surface and underground stocks.To account for observational uncertainty, we use three daily gridded precipitation data products: the Global Precipitation Climatology Project (GPCP) Daily Precipitation Analysis v.1.3 (ref. 21), the Global Precipitation Climatology Center (GPCC) Daily Analysis v.2022 (ref. 23) and the National Oceanic and Atmospheric Administration Climate Prediction Center (CPC) Unified Gauge-Based Analysis22. GPCC is a station-based product (1° resolution) with coverage over 1982–2020, whereas CPC (0.5°) and GPCP (1°) integrate station and satellite observations over 1979–2022 and 1997–2022, respectively. We repeated our analysis for the more recent GPCP v.3.3 and find consistent main effects56 (Supplementary Fig. 4), but use the more complete earlier version for our main analysis (GPCP v.3.3 contains missing daily values at high latitudes after 2020).We use two net all-sky surface shortwave radiation datasets: the Global Energy and Water Exchanges Surface Radiation Budget (GEWEX-SRB, limited here to 2002–2017)52 daily dataset and the NASA Clouds and the Earth’s Radiant Energy System Energy Balanced and Filled monthly dataset (NASA-EBAF, limited here to 2002–2022)53, each at 1° resolution. We use monthly evapotranspiration from the GLEAM v.3.8a, at 0.25° resolution for the overlapping GRACE period (2002–2020; ref. 54). Main river basin boundaries are from the HydroBASINS v.1.0 dataset, which is derived from Shuttle Radar Topography Mission elevation data collected in 2000 (ref. 51). All data URLs are enumerated in Supplementary Table 1.Daily climate model data are from the land-hist experiment of the Coupled Model Intercomparison Project, Phase 6, Land-Surface, Snow and Soil Moisture Intercomparison Project (CMIP6-LS3MIP)55. In the land-hist experiment, the land-surface components of climate models are forced by atmospheric forcings from the Global Soil Wetness Project phase 3, whose precipitation data are derived from the NOAA-CIRES-DOE Twentieth Century Reanalysis (20CR). We include results from the two models that report all required variables: MIROC6 with land component MATSIRO and VISIT-e57, and CNRM-CM6-1 with land component ISBA-CTRIP58. We use the mrtws (total water storage), tas (mean surface air temperature) and pr (precipitation rate) variables. No participating models report these required variables plus evaporation, precluding extending our climate model analysis towards mechanisms.Data aggregation and precipitation Gini coefficientAll data are temporally aggregated to the water-year scale, using October to September for the Northern Hemisphere water-year and July to June in the Southern Hemisphere. On this water-year scale, snow and ice storage changes are negligible. We further limit our spatial domain to regions without permanent snow and ice accumulation. We compute daily mean temperature data using the average of daily maximum and minimum temperatures from CPC. We also compute climatological mean precipitation as the average of the annual total over the full precipitation data record.We linearly detrend GRACE data to isolate interannual variability, which is largely governed by hydroclimate variability, from long-term trends that include anthropogenic water use and management26,31. The rationale for this focus on interannual variability is to establish whether more concentrated daily precipitation distributions lead to cumulative water balance changes, averaged across the water-year, absent the influence of coincident economic, demographic and mean warming trends.Correspondingly, and because GRACE only estimates TWS relative anomalies, we detrend and demean all other hydroclimate variables (except climatological precipitation, which is time-invariant). Finally, we interpolate all datasets to a common 0.5° grid as a compromise across the resolutions of the datasets. We repeated our analyses at alternative coarser common resolutions (1°, 2° and 3°) and found consistent results (Supplementary Fig. 5). We present long-term linear trends in terms of changes per 20 years to ease interpretation.To quantify the annual concentration of daily precipitation, we apply the Gini coefficient, a common economic measure of income inequality59, to the three daily precipitation datasets. The Gini coefficient is based on the Lorenz curve, which plots the cumulative share of the total quantity (that is, cumulative share of annual precipitation) against the cumulative share of the population (that is, days per year), sorted from least to greatest (Fig. 1d). The Gini coefficient is defined as the area between the Lorenz curve and the 1:1 line of equality. For more concentrated distributions, such as all of the annual precipitation falling in 1 day, the Lorenz curve deviates further from the line of equality, giving a Gini coefficient closer to 1. If all days are equally rainy, the Gini yields a value of 0. We use a computationally efficient discrete formulation to calculate the annual Gini coefficient of sorted daily precipitation (GP):$${G}_{{\rm{P}}}=\frac{1}{n}\,\left(n+1-2\frac{{\Sigma }_{i}^{k}{\Sigma }_{i}^{n}{P}_{i}}{{\Sigma }_{i}^{n}{P}_{i}}\right)$$
More concentrated precipitation decreases terrestrial water storage - Nature
Concentration of precipitation in large events decreases land water availability, and this effect will further increase with a future warming climate.
13,792 words~63 min read