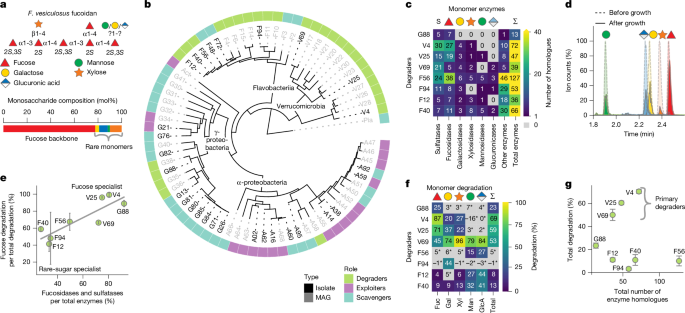
MainPlant and algal polysaccharides are among the most abundant and diverse biopolymers on Earth7,8. Their degradation by microbial communities drives carbon cycling9,10, promotes gut health11 and enables sustainable biotechnologies12,13. As the main component of protective extracellular matrices in plants and algae, the chemical diversity of polysaccharides has escalated a co-evolutionary arms race, driving the diversification of carbohydrate-active enzymes and their reshuffling among microbial degraders via horizontal gene transfer14,15,16,17. Although these distributed metabolic capabilities are evident in many microbial ecosystems, it remains unclear how multiple degraders coexist on a single complex polysaccharide resource and engage in synergistic interactions rather than competition18,19,20,21,22,23. Consequently, we lack a quantitative, mechanistic framework linking the metabolism and interactions of individual degraders to degradation on a community level. This gap hinders our understanding of microbial contributions in carbon cycling and our ability to design microbial consortia for efficient degradation of diverse substrates.In marine ecosystems, brown algae and diatoms produce the recalcitrant polysaccharide fucoidan, giving them a key role in carbon sequestration. They account for one-fifth of marine primary production and, through sinking biomass and particles, export 5 GtC yr−1 to the ocean depths, where the carbon can be stored for millennia24,25,26. These natural processes are increasingly harnessed in brown algal aquaculture, which is projected to contribute at least 0.5% of the 1 GtCO2 yr−1 sequestration target set for nature-based climate solutions by 205027. Fucoidan is a major agent of algal carbon export, as it constitutes 25–50% of the cell wall and mucilage6,28, promotes particle formation, and resists microbial degradation for up to several months1,29. This stability is probably attributable to its complex structure, which comprises a sulfated fucose backbone that varies across algal species in linkage patterns and sulfation, as well as in the heterogeneous composition and linkage architecture of non-fucose side chains6. Because of this complexity, only a few bacterial species are known to degrade fucoidans, and those that do typically only achieve incomplete degradation despite encoding dozens of fucoidan-active enzymes3,4,5. Metagenomic studies reveal co-occurring degraders with complementary enzyme repertoires that potentially target different regions of the polysaccharide30,31,32, suggesting that complete degradation may depend on positive interactions among specialized microorganisms—an ecological hurdle that could stabilize fucoidan in a dilute environment such as the ocean and help explain why many algae rely on this polysaccharide as a protective layer.Enzymatic specialization among degradersTo understand the role of microbial interactions in fucoidan degradation, we enriched a bacterial community from coastal seawater using fucoidan from the common brown alga Fucus vesiculosus as the sole carbon source (Supplementary Table 1). The previously characterized structure of this fucoidan (Fig. 1a) can be conceptualized as two compositionally and structurally distinct resource pools: a sulfated fucose backbone (about 80% of monomers) comprising an α-(1→3) or α-(1→4)-linked main chain with short α-(1→4)-linked fucose branches, and side chains composed of the ‘rare-sugar monomers’ xylose, galactose, mannose and glucuronic acid6,33,34,35 (Supplementary Note 1). After 12 sequential growth–dilution cycles, enrichments achieved 90% substrate degradation (Extended Data Fig. 1a–c). Metagenomic analysis recovered 73 metagenome-assembled genomes (MAGs), with Verrucomicrobiota—a phylum known for degraders of complex polysaccharides—dominating the community at over 80% relative abundance (Supplementary Table 2). Notably, the final points of all enrichments were dominated by Luteolibacter, a close relative of known fucoidan degraders that inhabit algal surfaces32,36. Based on gene content, MAGs were classified into three ecological guilds37,38: (1) ‘degraders’, which harbour fucosidases and sulfatases in their genomes and initiate polysaccharide breakdown; (2) ‘exploiters’, which lack these enzymes but possess genes for fucose catabolism, enabling them to compete with degraders for released fucose; and (3) ‘scavengers’, which do not contain either class of enzymes and instead rely on metabolic byproducts for growth (Fig. 1b and Extended Data Fig. 1d).Fig. 1: Fucoidan degraders in communities specialize through complementary monomer degradation.a, Schematic structure of the main repeating unit of fucoidan from F. vesiculosus and corresponding monosaccharide composition shown as bar graph. Monosaccharides are depicted following the Symbol Nomenclature for Glycans; glycosidic linkages are indicated as text and the question mark denotes unresolved linkages of mannose, galactose and glucuronic acid. b, Phylogenetic tree of marine bacterial strains enriched on fucoidan as sole carbon source. The outer ring indicates inferred metabolic roles; names are coloured to distinguish isolates from metagenome-assembled genomes. c, Number of fucoidan-associated enzymes across isolated degraders. Enzymes were grouped by inferred activities targeting similar fucoidan linkages: sulfatases (S1_15, S1_16, S1_17, S1_22 and S1_25), fucosidases (GH29, GH95, GH107, GH141 and GH168), galactosidases (GH36, GH97 and GH2), xylosidases (GH39, GH120, GH3, GH30 and GH31), mannosidases (GH92) and glucuronidases (GH115). ‘Other enzymes’ denotes fucoidan-associated CAZymes with unresolved activity. Σ indicates total fucoidan-associated enzymes per genome. Values indicate homologue counts, grey cells indicate zero counts and colour bar is capped at 40. d, Representative targeted LC–MS chromatograms of acid hydrolysed culture supernatants of V69 before (dotted) and after (solid) growth on fucoidan used to infer monomer degradation. Peaks are coloured by monomers identified by multiple reaction monitoring and retention time. For visualization, ion counts of monomers are normalized to before-growth samples. e, Correlation between proportion of enzymes targeting sulfate and fucose per total enzymes and the proportion of fucose degraded per total degradation. Dots and error bars show mean ± s.d. of three biological replicates. f, Heat map showing the mean monomer degradation obtained from three biological replicates; grey indicates no significant change from control. g, Number of fucoidan-degrading enzymes versus total fucoidan degradation across degraders. Dots and error bars show mean ± s.d. of three biological replicates.Source dataFrom these enrichments, we established a strain collection that reflects the taxonomic and functional diversity of the community (Fig. 1b). We isolated 5 exploiters, 16 scavengers and 7 degraders, namely V25 (Luteolibacter), V69 (Roseibacillus), G88 (Pseudocolwellia) and four members of the Flavobacteriia (F12, F40, F56 and F94). We additionally included the previously characterized degrader Lentimonas sp. CC4 as strain V43. Isolate classification was experimentally validated by confirming that degraders grow on fucoidan, exploiters grow on fucose (but not fucoidan), and scavengers are unable to utilize either substrate (Supplementary Fig. 1). Although several degraders were not previously described, we found that in particular V69 and V4 co-occur across many macroalgae-associated coastal habitats (Supplementary Fig. 2 and Supplementary Note 2), highlighting the ecological relevance of this strain collection. Collectively, these 29 strains provide a foundation for dissecting the mechanisms of fucoidan degradation in microbial communities.Genome analysis of the isolated degraders revealed an unexpectedly large and diverse repertoire of fucoidan-degrading enzymes. We identified 34 genomic polysaccharide utilization loci (PULs) associated with fucoidan degradation, each encoding a different combination of enzymes (Extended Data Fig. 2 and Supplementary Table 3). Characterized enzyme families that target sulfate and fucose linkages3,4,39,40,41,42,43,44,45 co-localized with 44 additional enzyme families, including 10 families predicted to act on rare-sugar monomers (Extended Data Fig. 3 and Supplementary Note 3). The characteristic polysaccharide-binding and transport pair SusC/D was only found in Flavobacteriia (Supplementary Fig. 3). Individual degraders encoded 13–127 distinct enzymes, defined at a 60% amino acid identity threshold. Repertoires overlapped by only 9% on average between strains, yielding 547 unique enzymes across all enrichment-culture genomes (Extended Data Fig. 2b,c). Notably, all enzymes of strain G88 were encoded on a 112 kb plasmid, whereas strain F56 harboured a 623 kb genomic island containing five PULs (Supplementary Fig. 4). These observations are consistent with the lateral acquisition of large carbohydrate-active enzyme (CAZyme)-rich gene clusters14,17. Together, these findings indicate that enzyme repertoires are shaped by gene mobility and partial sampling from a vast environmental pool, culminating in a highly diverse enzymatic landscape for fucoidan degradation.Despite the unique enzyme repertoires found across genomes, a distinct functional differentiation emerged between fucose and rare-sugar degraders. Independent of the total enzyme count, the proportion of enzymes targeting sulfate and fucose linkages within the total fucoidan enzyme repertoires varied considerably—ranging from under 30% in F40 to over 90% in G88 (Extended Data Fig. 4)—indicating different levels of genomic specialization for the cleavage of fucose or other monomer linkages. Furthermore, the fucose specialists V25, V4 and G88 lacked glucuronidases and encoded few enzymes required for cleaving side chains of rare-sugar monomers (Fig. 1c). Conversely, the rare-sugar specialists F12, F40 and F94 contained fewer fucosidases and sulfatases. Strains F56 and V69 appeared to be generalists, possessing enzymes from both functional classes, although V69 lacked exo-acting fucosidases from families GH29 and GH95 (Extended Data Fig. 3c). These patterns suggest distinct preferences for fucoidan monomers across degraders.Complementary monomer degradationWe validated our genomic predictions of enzymatic specialization using a targeted liquid chromatography mass spectrometry (LC–MS) assay to analyse fucoidan degradation at the monomer level. Monomers bound in fucoidan were released through acid hydrolysis of culture supernatants and quantified using established derivatization protocols and an optimized 3.5 min LC–MS method46,47. Time-resolved measurements across all eight degraders showed that monomer depletion closely aligns with growth, saturating once cultures entered stationary phase (Extended Data Fig. 5a–c and Supplementary Table 4). During exponential growth, we also observed a transient accumulation of free monosaccharides, most prominently fucose, which reached up to 150 µM in V4, as reported previously3. This suggests that extracellular fucoidan hydrolysis releases monosaccharides at rates that temporarily exceed their uptake rate. Subsequently, we quantified fucoidan degradation as the change in fucoidan-bound monomers before and after growth (Fig. 1d and equation (1)). This approach effectively captures the combined effect of enzymatic cleavage of the polysaccharide and microbial uptake of the released monomers—a process that we refer to as monomer degradation. The results confirmed that only the degraders contribute substantially to fucoidan turnover (Extended Data Fig. 5d). To assess metabolic specialization, we determined the monomer preference for each degrader as the fraction of consumed carbon derived from fucose. This metric strongly correlated with the genomic proportion of enzymes targeting sulfate and fucose linkages relative to the total fucoidan repertoire (r = 0.75, P < 0.001; Fig. 1e). This confirms that V69 and F56 function as generalists, whereas V4, V25 and G88 are fucose-specialists and F12, F40 and F94 are rare-sugar specialists.None of the degraders were able to completely break down any specific monomer type. The fucose specialists V4 and V25 achieved only 87% and 71% degradation of fucose, respectively (Fig. 1f), but exhibited limited activity on galactose and xylose, and did not degrade mannose or glucuronic acid. By contrast, mannose or glucuronic acid were effectively consumed by F12, F40, F56 and V69, but exhibited low levels of fucose degradation. This metabolic specialization resulted in limited total degradation, even among the strongest degraders V4, V25 and V69 that achieved 69%, 59% and 53%, respectively—substantially lower than the ~90% degradation observed in enrichment cultures. Notably, a larger enzymatic toolkit does not necessarily mitigate this bottleneck (Fig. 1g). For example, F56, despite encoding >100 enzymes, achieves negligible total degradation, whereas G88 reaches 23% with only 13 enzymes. This decoupling indicates that access to complementary substrate fractions—rather than enzyme count—limits fucoidan degradation, such that complete breakdown emerges from interactions among metabolically complementary degraders.Synergism in pairwise co-culturesTo assess the impact of microbial interactions on fucoidan degradation, we measured the fold changes in growth yields and total degradation for the primary degraders V4, V25 and V69 when co-cultured individually with each of the 29 strains, comparing the results to monoculture controls (Fig. 2a, Extended Data Fig. 6 and Supplementary Table 5). Of the 87 co-culture pairs tested, 33 exhibited significant changes that broadly aligned with predictions based on genome-based guild classifications: Eight pairs with scavengers increased biomass without influencing degradation, supporting their role in recycling byproducts that are not directly linked to the degradation pathway. Conversely, seven pairs with predicted exploiters reduced both growth and fucoidan degradation. Surprisingly, 16 degrader–degrader co-cultures showed positive interactions, characterized by increases in both biomass and degradation, as well as higher growth rates (Extended Data Fig. 6c). The only exception was G88, which increased degradation when paired with V69, but acted as an exploiter when paired with V4 and V25. On the subset of co-cultures with altered degradation outcomes, we classified interaction types using absolute species abundances determined by strain-specific quantitative PCR (qPCR)48 (Fig. 2b and Supplementary Table 6). Exploiters increased in biomass at the expense of primary degraders, consistent with opportunistic consumption of released fucose. Degrader–degrader interactions with increased total degradation and biomass were predominantly commensal, but also included cases of amensalism and competition; only the V69–G88 pair was mutualistic. These results distinguish ecological interaction types at the species level from positive interactions at the functional level, showing that reciprocal benefits to both strains are not necessarily required for enhanced community function.Fig. 2: Synergistic interactions between complementary degraders in pairwise co-cultures.a, log2-transformed fold changes (FC) in growth yield and total fucoidan degradation in 87 pairwise co-cultures of Verrucomicrobiota strains with other community members, relative to the corresponding Verrucomicrobiota monoculture. Only significant changes are shown; dots are colour-coded according to the metabolic role of the partner strain. b, Network of pairwise interactions inferred from changes in strain abundance in co-culture relative to monoculture, measured by strain-specific qPCR. Nodes denote strains and edges interaction types. c, Synergism score (σ(i,j)) for Verrucomicrobiota strains paired with other community members. Scores quantify deviations from a null model of independent substrate utilization. Grey indicates no significant (NS) change from null expectation. d, Relationship between synergism score and metabolic similarity of strain pairs, calculated as the pairwise correlation between z-score normalized monomer degradation profiles in monoculture. e, Fucoidan degradation by three primary degraders and the corresponding residual substrate used in cross-feeding assays. f, Additional degradation of primary residual fucoidans by secondary degraders, scaled to the initial fucoidan pool (residual fraction × fraction degraded by secondary degrader). Grey indicates no significant (NS) change compared to controls. Data in a–f represent means of 3 biological replicates (n = 3); replicate-level data and exact P values are provided in the Source Data file. g, Relationship between additional degradation in co-cultures and degradation of purified residual fucoidans. Co-culture values were calculated as total degradation in the co-culture minus degradation by the primary degrader alone. Residual values indicate degradation achieved by the secondary degrader on purified residual fucoidan. Dots show individual biological replicates. h, Release of monosaccharides from fucoidan and fucoidan-derived residual substrates by purified enzymes, normalized to the total amount of the respective monosaccharide present in the substrate. Monosaccharide symbols and text indicate the type of released monosaccharide for each enzyme. Values represent the mean of three biological replicates (n = 3) and grey indicates no significant (NS) release.Source dataThe observed positive interactions among degraders could not be explained solely by resource partitioning, indicating the emergence of a synergism on a functional level. To quantify this, we defined a synergism score, denoted as σ(i,j), by calculating the difference between observed total degradation and a null hypothesis that assumed no interaction among strains beyond mere resource partitioning (Fig. 2c and equation (2)). The strongest synergism of 18% occurred between V25 and F56, which together achieved 79% total degradation. The highest degradation levels overall were found in the pairs V25/V69 (82%) and V4/V69 (93%), each exhibiting synergistic contributions of about 8%. Overall, a strong negative correlation was discovered between the calculated synergism σ(i,j) and the dissimilarity of monomer degradation profiles between paired strains (r = – 0.79, P < 0.001; Fig. 2d), indicating that complementary metabolic capabilities amplified degradation in a non-additive manner. Additionally, the relationship between synergism and complementarity was reflected in the genomes of degraders, as we identified a positive association between σ(i,j) and the difference in the genomic proportion of sulfate- and fucose-targeting enzymes relative to total enzymes (r = 0.53, P = 0.02; Supplementary Fig. 5). Collectively, these results indicate that synergism emerges through the combination of fucose and rare-sugar specialists when enzymatic and metabolic capabilities are maximized.Mechanism of synergismTo determine whether interactions among degraders were purely resource-mediated or involved additional metabolic exchanges, we measured degradation using cell-free, purified residual fucoidans (larger than 1 kDa) obtained from three stationary-phase Verrucomicrobiota cultures (Fig. 2e). These residual fucoidans contain carbon that is enzymatically inaccessible to the producing strain, even when supplied as a fresh carbon source (Fig. 2f). When offered to other degraders as the sole carbon source, LC–MS measurements showed that all degraders except F94 utilized at least one of the three residual substrates, and F56 exhibited a threefold increase in degradation of residuals compared to untreated fucoidan. This additional degradation quantitatively matched the enhanced performance observed in the corresponding co-cultures (R2 = 0.90, P < 0.001; Fig. 2g and equation (3)), indicating that synergism among degraders does not require direct cell–cell contact or cross-feeding of small molecules, but instead arises from complementary enzymatic activities that unlock otherwise inaccessible carbon.To test whether synergism arises from enzymatic complementarity, we purified and characterized nine predicted exo-acting enzymes targeting rare-sugar monomers. These enzymes, assigned to CAZyme families GH39, GH36, GH130, GH115, GH92 and GH97, were selected because of their uncharacterized roles in fucoidan degradation and their unique distribution among degraders (Extended Data Fig. 3, Supplementary Table 7 and Supplementary Figs. 6 and 7). Assays with pNP-labelled substrate analogues, native F. vesiculosus fucoidan and residual fucoidans derived from three Verrucomicrobiota degraders confirmed the expected substrate specificities for six enzymes, including α-galactosidases (V25|GH36, V25|GH97_A, V69|GH97_A, V69|GH97_B), an α-mannosidase (F56|GH92_E) and a β-xylosidase (F56|GH39), whereas three showed no detectable activity (Extended Data Fig. 7). Kinetic analyses yielded Michaelis constant (Km) values of 15.79 mM for F56|GH39 and 1.25 mM for V25|GH36, consistent with reported values49,50. Notably, several active enzymes are encoded in distinct fucoidan PULs, providing functional support for these loci (Supplementary Fig. 8). Monomer release from fucoidan substrates was low (0.01–7.48% of the initial pool), indicating that only a limited fraction of linkages is accessible to individual enzymes (Fig. 2h). By contrast, most enzymes exhibited substantially higher activity on residual fucoidan, indicating that prior enzymatic processing exposes otherwise inaccessible linkages, with up to tenfold increases for F56|GH92_E and V25|GH97_A. Additionally, the distinct activity profiles among GH97 homologues further indicate substrate partitioning across structurally heterogeneous side chains. Together, these results show that complementary hydrolase repertoires expand substrate accessibility and drive synergistic degradation in co-culture.Quantitative prediction of synergismTo explore whether synergistic effects extend beyond pairs, we measured degradation across all 127 combinations of the seven consistent degraders, excluding G88. Total degradation increased with community richness, ranging from 4% to a maximum of 97.1% in the 5-member community F40, F56, V69, F94 and V4 (Fig. 3a). A notable example of emergent synergism was observed between F56 and F94, which showed minimal degradation in monoculture but reached 50% degradation when combined (Extended Data Fig. 8).Fig. 3: Functional complementarity enables predictable degradation synergies across different fucoidan structures.a, Total fucoidan degradation in all 127 possible combinations of up to 7 degraders. Data points show the mean of three biological replicates; the grey line denotes the mean degradation per community size. b, Synergism score in 127 communities compared to expected degradation under a null model assuming no interactions. Left, scatter plot of expected degradation versus synergism score. Right: density plot of synergism score distribution. All individual data points from three biological replicates are shown. c, Predictive model of community degradation based on strain-specific substrate preferences. Left, heat map of inferred degradation capacities for fucose and rare-sugar monomers across seven strains. Middle, nonlinear Hill function (n = 2.1, Km = 0.4) mapping cumulative strain capacity to predicted degradation. Right, predicted versus observed degradation across 127 communities; dots are coloured by training or test set and show the mean of three biological replicates. a.u., arbitrary units. d, Monosaccharide composition and estimated fucoidan purity of nine brown algal fucoidans. Bars show the relative abundance of fucoidan-derived monosaccharides. The estimated fucoidan content provides an approximate measure of the fraction of fucoidan-derived material within the total hydrolysable carbohydrate pool. e, Observed versus predicted degradation of nine fucoidan substrates across seven selected communities. Dots are coloured by substrate identity and all data points from three biological replicates are shown.Source dataOur results revealed a high degree of functional redundancy, with near-complete degradation achieved across multiple community configurations. Some configurations depended on a few high-performing strains (for example, V69 paired with V25), whereas others relied on synergistic combinations of individually weaker degraders (Supplementary Fig. 9). For example, four Flavobacteriia strains, although ineffective alone, collectively approximated the degradation performance of V69. This functional redundancy implies that diverse communities can serve as a buffer against the stochastic variation in species composition typical of particle-associated marine microbiomes51,52. Remarkably, even when approaching near-complete degradation, 80% of interactions were still synergistic beyond what would be expected from simple resource partitioning, while negative interactions were infrequent and weak (equation (2) and Fig. 3b). These findings indicate a smooth structure–function landscape with minimal higher-order effects and a high degree of predictability in community function53.To further assess the predictability of degradation in complex communities, we developed a mechanistic model that links community composition to degradation outcome (Fig. 3c). This model was inspired by the observed resource partitioning between fucose and rare-sugar specialists and represents fucoidan as two monomer pools (fucose and rare) in which strains are characterized by their ability to degrade each type (equation (4)). Given that degradation tended to saturate in richer communities, we hypothesized that community-level degradation could be predicted by a nonlinear combination of the capabilities of individual strains, captured through a Hill function (equations (5) and (6)). Model parameters—strain-specific degradation potentials and Hill coefficients—were inferred from data on one-, two- and three-member communities (Extended Data Fig. 9). This straightforward framework proved to be highly effective, accurately predicting degradation across all 127 community combinations (R2 = 0.96, P < 0.001; Fig. 3c and Supplementary Table 8), including the emergent interaction between F56 and other degraders. These results highlight that, despite the structural complexity of fucoidan and the diversity of enzymatic pathways involved, community-level degradation can be reliably predicted from the synergistic contributions of individual strains to fucose and rare-sugar monomer utilization.Given that the monomer composition, structure and degradation pathways of fucoidan vary substantially between brown algal species54, we validated the generality of our results across eight different types of fucoidan (Supplementary Note 4). We quantified degradation using full monosaccharide analysis to resolve co-extracted polysaccharides and degradation across seven communities. Most substrates were highly pure, with more than 90% of measured monosaccharides attributable to fucoidan, and fucose comprising 63–96% of these (Fig. 3d, Extended Data Fig. 10a and Supplementary Table 9). Two preparations (D. potatorum and F. serratus), however, contained elevated glucose levels (45% and 73%, respectively), potentially from co-extracted laminarin, which was almost completely depleted across communities, showing rapid consumption of labile glucans (Extended Data Fig. 10b). By contrast, fucoidan degradation depended strongly on community composition: simpler communities showed limited degradation, consistent with constraints imposed by incomplete enzymatic repertoires. Also consistent with our previous observations, communities that only contain rare-sugar specialists F12, F40 and F94 achieved higher degradation on substrates enriched in rare-sugar monomers (Extended Data Fig. 10c).Remarkably, without any refitting, our predictive model generalized well to these chemically distinct fucoidans (R2 = 0.90, P < 0.001; Fig. 3e). Using the parameters trained on fucoidan from F. vesiculosus, the model accurately predicted degradation across all substrates by accounting solely for the stoichiometry of fucose and rare-sugar monomers. These out-of-sample predictions demonstrate an extraordinary degree of accuracy, considering the complexity of the degradation pathways involved. This suggests that the metabolic capabilities of the degraders and their synergistic interactions remain conserved across different substrates, despite variation in overall monomer composition and polysaccharide structure.Global metagenomic evidence for synergismSo far, we have seen that fucoidan degradation is controlled by synergistic interactions among degraders, rooted in the complementarity of their enzyme repertoires. To assess whether these interactions constrain fucoidan cycling at a global scale, we leveraged metagenomic data to quantify the abundance and co-occurrence patterns of organisms classified as degraders (Fig. 4a–c). In 12,347 ocean metagenomes from the mOTUs database55, we identified 1,632 putative degrader species encoding between 5 and 175 fucoidanase genes. Degrader abundance and prevalence exhibited highly right-skewed distributions (median relative abundance: 1.6%, maximum: 33%), consistent with previous reports of Lentimonas spp.3,56. Critically, multispecies assemblages were near-universal: 94% of samples harboured multiple degrader species (median: 15 species per sample). This ubiquity of co-occurring degraders across diverse ocean habitats suggests that the synergistic interactions identified in culture are likely to constrain fucoidan flux at global scales.Fig. 4: Potential for synergistic fucoidan degradation in marine microbial communities.a, Overview of the analysis workflow used to identify fucoidan-degrading species and their functional repertoires across marine metagenomes. GH, glycoside hydrolase. b,c, Distribution of the number of degrader species (b) and their relative proportion of the community per sample (c) (from 10,543 metagenome samples), showing that multiple degraders commonly co-occur within individual communities and represent a consistent but typically low-abundance fraction. Box plots illustrate the 25th, median and 75th percentile of the distribution, with whiskers representing minimum and maximum values. Relative proportion is defined as the proportion of genomes within each community that is attributed to degraders, determined through single-copy marker gene coverage. d, Enzymatic composition of fucoidan-targeting PULs, illustrating a continuum of sulfated fucose and rare-sugar monomer targeting PULs. e, Right, global distribution of metagenome samples (n = 10,543) containing degrader species (teal) and samples with co-occurring degraders exhibiting complementary functional profiles (purple). Left, bar plot summarizing the number of samples in which degraders are detected and the subset in which potential for synergistic degradation is observed.To quantify the potential for synergism among co-occurring degraders, we focused on the 528 species for which we identified fucoidan-targeting PULs. Variations in the enzyme composition of these PULs recapitulated the functional specialization observed in our isolates, encompassing repertoires enriched in enzymes targeting sulfate and fucose linkages or other enzymes that potentially act on rare-sugar monomers (Fig. 4d). Leveraging these variations, we conservatively estimated signals of synergism across ocean samples based on the co-occurrence of degraders with high-capacity (upper quartile) and low-capacity (lower quartile) of fucose-targeting PULs. This analysis identified 806 samples containing both functional extremes and thus a potential synergism (Fig. 4e). Together, these findings suggest that functionally specialized and complementary fucoidan degraders frequently co-occur in the ocean, supporting synergistic interactions as an ecologically relevant strategy for the degradation of complex marine fucoidans.DiscussionOur results demonstrate that positive interactions among complementary degraders are both frequent and essential for the complete breakdown of fucoidan by marine microbial communities. This emphasizes that its degradation is fundamentally a collective effort. Despite being a particularly complex and variable class of polysaccharides—with dozens of glycosidic linkages and an expansive enzymatic space—the degradation of fucoidans at the community level proves remarkably predictable. This paradox is resolved by synergism among degraders, in which individual strains consistently specialize in either the fucose-rich backbone or the side chains of rare sugars, exhibiting conserved metabolic roles across diverse fucoidan structures. This allows for a quantitative mapping of community composition to degradation outcomes and underscores that the co-evolutionary arms race between the protective extracellular matrix of brown algae and microbial degraders unfolds at the monomer level.Degradation synergism does not necessarily emerge from mutualistic interactions, but rather depends on complementarity between enzyme repertoires. The single exception was the mutualistic V69–G88 pair, indicating that genuine cooperative division of labour, while rare, can occur in these systems. Evolutionary and ecological pressures appear to have driven the partitioning of complementary enzymes across organisms. Several non-mutually exclusive hypotheses are plausible. One possibility involves a metabolic trade-off between fucose and other hexoses: whereas side-chain sugars typically feed into upper glycolysis, fucose enters metabolism at the level of lower glycolysis, requiring gluconeogenic flux to generate upstream intermediates. This mismatch may favour the evolution of specialists that target either the fucose backbone or the side chains, avoiding potentially wasteful cycling in central carbon metabolism57,58. Another contributing factor may be the metabolic cost of maintaining and regulating a broad enzymatic arsenal. Fully self-sufficient degraders must coordinate the expression of hundreds of genes, many of which are needed to process low-abundance monomers, making this strategy energetically inefficient. Finally, the continual loss of genes through neutral processes such as genetic drift, together with the capacity of coexisting degraders to compensate for missing functions, suggests that complete degraders may be evolutionarily unstable. By contrast, gene loss may drive the recurrent emergence of complementary types that together achieve full degradation.Our findings have implications for both microbial ecology and biotechnology. First, they highlight the challenges associated with engineering single strains to degrade chemically complex substrates such as fucoidan, where identifying precise enzyme functions proves difficult. By contrast, harnessing microbial communities with pre-evolved metabolic complementarity presents a powerful and scalable alternative for biomass conversion. Thus, our work establishes a conceptual and practical framework to process increasingly important brown algal biomass and might extend to other polysaccharides with similar structures such as xylans21. Second, from an ecological perspective, our experimental and metagenomic analyses suggest that fucoidan degradation frequently emerges from assemblies of co-occurring degraders with complementary enzymatic repertoires. This reliance on the assembly of complementary partners may help explain how microbial diversity shapes fucoidan turnover and influences its persistence and contribution to marine carbon storage. Our research highlights an underrecognized link between microbial diversity, polysaccharide turnover and global biogeochemical cycles. In light of microbial communities responding to global ocean warming59, shifting community structures may ultimately influence the ocean’s functional capacity for carbon sequestration.MethodsChemicals and reagentsFucoidan from F. vesiculosus (Sigma-Aldrich, F8190, lot no. 0000485452) was used as the primary substrate throughout this study. Additional F. vesiculosus fucoidans were obtained from Marinova (FVF2021547) and Biosynth (YF57714). Fucoidans from other species were sourced from Fucus serratus (Biosynth, YF09360), Fucus evanescens (OceanBasis and extracted as described previously60), Cladosiphon okamuranus (Biosynth, YF146834), Durvillaea potatorum (Biosynth, YF157165), Ecklonia maxima (Biosynth, YF157166) and Laminaria hyperborea (TheFucoidanStore, LowEndo Fucoidan). For derivatization, 1-phenyl-3-methyl-5-pyrazolone (PMP) was obtained from Sigma-Aldrich (M70800). Internal standards for LC–MS analysis included d-galactose-13C6 (Sigma-Aldrich, 605379), d-mannose-13C6 (Sigma-Aldrich, 592994) and PMP-[d5] (CAS 1228765-67-0), custom-synthesized by BOC Sciences (Shirley). LC–MS-grade solvents and reagents were acetonitrile (Honeywell), methanol (Honeywell), ethanol (Sigma-Aldrich), formic acid (Sigma-Aldrich) and ammonium formate (Merck). Ultrapure water was produced using a Q-POD system (Merck). Unless otherwise stated, all other chemicals were of analytical grade and sourced from Sigma-Aldrich.Bacterial growth mediaThroughout this study, three distinct media detailed in Supplementary Table 1 were used for (1) enrichment of bacteria, (2) isolation of bacteria on solid medium and (3) routine cultivation of bacterial isolates in MBL medium52. All media mimicked the ionic composition of coastal seawater and contained 340 mM NaCl, 15 mM MgCl2, 6.75 mM KCl and 1 mM CaCl2. The pH was buffered to 8.0 with either bicarbonate in the enrichment and plate media or 50 mM HEPES in the MBL medium. Nutrients were ammonium chloride, sodium phosphate, sodium sulfate, trace metal mix and vitamin mix52. Enrichment medium contained 0.02% (w/v) fucoidan from F. vesiculosus. Solid medium was prepared with 2% (w/v) carrageenan (Sigma C1013) and a mix of carbon sources (acetate, citrate, xylose, galactose, mannose, glucose, fucose, cellobiose and tryptone) at 0.002% (w/v) each. Bacterial isolates were routinely cultured in MBL medium with carbon sources specific to their metabolic requirements. Verrucomicrobiota degraders were routinely grown with 0.2% (w/v) fucoidan from F. vesiculosus. Other degraders (Flavobacteriia and Gammaproteobacteria) and exploiters were grown on a mix of 0.2% (w/v) l-fucose and 0.2% (w/v) fucoidan from F. vesiculosus. Scavengers were grown in a mix of carbon sources (acetate, citrate, xylose, galactose, mannose, glucose, fucose, cellobiose and tryptone) at 0.02% (w/v) each.Enrichment of fucoidan-degrading communitiesSurface seawater was collected on 30 March 2019 from a rocky shoreline covered with the brown algae F. vesiculosus, Ascophyllum nodosum and Saccharina latissima near the Marine Science Center of Northeastern University (Canoe Beach, Nahant, MA, USA; 42° 25′ 10.8732″ N, 70° 54′ 25.686″ W). The seawater was pre-filtered through a 10-μm PTFE membrane filter (Millipore, JCWP04700) and diluted 1:100 to inoculate three replicate enrichment cultures (25 ml each) containing 0.02% (w/v) F. vesiculosus fucoidan in 150 ml glass bottles sealed with rubber stoppers. Cultures were incubated at 20 °C in the dark and agitated at 50 rpm.Enrichment cultures were monitored every 24–48 h for microbial growth (OD600) and fucoidan degradation, quantified via the phenol–sulfuric acid method61. For each measurement, 200 µl of culture was mixed with 1 ml of concentrated sulfuric acid and 200 µl of 5% (v/v) phenol, then incubated at 50 °C for 20 min. Absorbance was measured at 490 nm and fucoidan concentration was determined using an external standard curve of fucose. After 10 days, cultures reached 40–60% degradation of the initial fucoidan, at which point serial growth–dilution cycles were initiated by transferring 1:50 into freshly prepared medium every 2 days for a total of 12 cycles. At every second time point, 10 ml of culture was filtered onto a 0.22 μm Sterivex filter (Millipore, SVGPB1010) for DNA extraction using the DNeasy Blood & Tissue Kit (Qiagen) and subsequent metagenomic sequencing. Final enrichment communities were cryopreserved at −80 °C with 15% (v/v) glycerol.Isolation of bacterial strainsFrom each enrichment culture, cells were enumerated using a counting chamber by light microscopy. Aliquots corresponding to 102, 103 and 104 cells were plated in triplicate onto solid medium in 150 mm Petri dishes (VWR 391-0616) and incubated for 14 days at ambient temperature in the dark. A total of 768 colonies were picked and re-streaked at least 3 times until only a single colony morphotype was observed. Colonies were lysed in 0.1% (v/v) Triton X-100 in TE buffer for Sanger sequencing of the 16S rRNA gene. Pure isolates were grown in MBL medium with a mix of carbon source and cryopreserved at −80 °C in 15% (v/v) glycerol. To de-replicate repeatedly isolated strains, we selected 96 isolates based on their 16S sequences for genomic DNA extraction using the DNAadvance kit (Beckman Coulter) and draft genome sequencing. To identify redundant isolates, pairwise average nucleotide identity (ANI) was computed using OrthoANIu v1.262 yielding 28 unique bacterial strains. We additionally included the characterized degrader ‘Lentimonas’ sp. CC4 as Verruco4 in the isolate collection3 resulting in a total of 29 strains in the isolate collection.Sequencing of metagenomes and isolate genomesAll sequencing work was carried out in collaboration at the BioMicroCenter at MIT. Metagenomes of enrichment cultures were sequenced with an Illumina NovaSeq6000 S4 flow cell with 150 nt paired-end reads. Metagenomes were assembled using SPAdes v3.13.063 with the parameters --meta --only-assembler -k 21,33,55,77. MAGs were reconstructed using CONCOCT v1.0.064, MaxBin v2.2.765 and DAS Tool v1.1.266 with default settings. Draft genomes of isolates were sequenced on an Illumina NextSeq 500 platform (150 nt paired-end reads, ~200× coverage) and assembled using SPAdes v3.13.0 with the parameters --only-assembler -k 21,33,55,77 --careful. To generate closed genomes for selected degraders (Flavo12, Flavo40, Flavo56, Flavo94, Gamma88, Verruco25 and Verruco69), genomic DNA was extracted from 1 ml of culture using the DNeasy Blood & Tissue Kit (Qiagen). Long-read sequencing was performed on Nanopore PromethION FLO-PRO002 flow cells. Hybrid assemblies combining Illumina short reads and Nanopore long reads were generated using Unicycler v0.4.867 with the parameters --keep 3 --mode normal --min_fasta_length 1000 --kmers 77, yielding circularized genome assemblies. Completeness and contamination of MAGs was assessed using CheckM v1.1.268 resulting in a total of 73 medium and high-quality genomes69 summarized in Supplementary Table 2. Taxonomic classification and phylogenetic reconstruction of isolate and metagenome-assembled genomes were performed using GTDB-Tk v2.0.070 (release 202).Annotation of bacterial genomesOpen reading frames were predicted and annotated with DRAM v1.2.471. CAZymes were identified by HMMER72 v3.3 with hidden Markov models from the dbCAN database73 (dbCAN-HMMdb-V10). HMM hits were validated via Diamond74 (v0.9.14.115; blastp mode, --more-sensitive) against the CAZy database (accessed September 2022), retaining only matches with bit scores >100. Sulfatases were identified by hmmsearch against PF00884 (sulfatase domain), using an e-value threshold of <10−4 and a minimum alignment length of 100 amino acids. Sulfatases were further classified into subfamilies based on Diamond (v0.9.14.115; blastp mode, --more-sensitive) against the SulfAtlas v1.2. database75.Classification of genomes into metabolic rolesWe classified genomes into three metabolic roles, degraders, exploiters and scavengers, based on the presence or absence of key enzymes involved in fucoidan and l-fucose metabolism. Degraders were defined as genomes encoding at least five enzymes from a curated set of ten families of fucoidanase families3, comprising glycoside hydrolases (GH29, GH95, GH141, GH107 and GH168) and sulfatases (S1_15, S1_16, S1_17, S1_22 and S1_25). Exploiters lacked fucoidanases but encoded one of two alternative l-fucose catabolic pathways described in MetaCyc57: l-fucose degradation I or l-fucose degradation II. For each pathway, genomes were required to encode at least 75% of the constituent enzymes. For pathway I, this included: K07248 (lactaldehyde dehydrogenase), K02431 (l-fucose mutarotase), K00879 (l-fuculokinase), K01818 (l-fucose/d-arabinose isomerase) and K01628 (l-fuculose-phosphate aldolase). For pathway II, this included: K18333 (l-fucose dehydrogenase), K18334 (l-fuconate dehydratase), K18335 (2-keto-3-deoxy-l-fuconate dehydrogenase), K07046 (l-fuconolactonase), K18336 (2,4-didehydro-3-deoxy-l-rhamnonate hydrolase) and K01685 (altronate hydrolase). Scavengers were defined as genomes lacking all enzymes associated with both fucoidan degradation and l-fucose catabolism.Identification of fucoidan PULsWe searched closed genomes of cultured fucoidan degraders for candidate PULs using a sliding 12-gene window. Regions containing at least four CAZyme genes were flagged and those encoding two or more known fucoidanases (GH29, GH95, GH141, GH107, GH168, S1_15, S1_16, S1_17, S1_22 or S1_25) were retained as putative fucoidan PULs. To avoid misclassification, we manually curated these loci and removed those likely involved in the degradation of other polysaccharides—specifically, five loci from Flavobacteriia containing carrageenanases (GH16, GH82, GH150 and GH167). The final curated set comprised 34 fucoidan-associated PULs spanning 54 CAZyme families (Supplementary Table 3).Definition and comparison of fucoidan enzyme repertoiresFor each degrader, the fucoidanase repertoire was defined as (1) all CAZymes and sulfatases within fucoidan PULs and (2) additional chromosomal genes belonging to enzymes families that target sulfated fucose (GH29, GH95, GH141, GH107, GH168, S1_15, S1_16, S1_17, S1_22 or S1_25) or that are predicted to act on rare sugars (GH30, GH31, GH36, GH39, GH92, GH97, GH115 and GH120). For the characterized degrader3, Lentimonas sp. CC4, only enzymes that were upregulated at the protein level during growth on F. vesiculosus fucoidan were included, specifically those in co-expression clusters 2–6.To sort the sequence diversity into homologous groups of enzymes, we clustered all fucoidan-associated CAZymes using MMseqs2 v13.45111 (easy-cluster with --min-seq-id 0.6 -c 0.5 --cov-mode 0)76. This defined enzyme homologues at a threshold of ≥ 60% amino acid identity ≥ 50% alignment coverage for both query and target sequences. These clusters formed the basis for showing counts of enzyme families and comparing enzyme repertoires across isolates and pairwise similarities were calculated using the Jaccard index.To explore how enzymatic diversity scales with community size, we performed a rarefaction analysis. In each of 10,000 iterations, we randomly selected n degrader strains (n = 1–29), counted the number of unique enzyme clusters, and estimated the expected total richness using the Chao1 estimator.Refined functional annotation of fucoidan-active CAZymesThe activities of fucoidan-associated enzymes found in isolated degraders were inferred by comparison to characterized CAZymes in the CAZy database (accessed March 2026) using Diamond (v0.9.14.115; blastp mode, --more-sensitive). For each domain, the top-scoring hit was used to assign putative function and EC number, where available. Proteins containing multiple catalytic domains were annotated at the domain level. Annotation confidence was defined as high (≥ 70% identity and ≥70% coverage), medium (≥ 30% identity and ≥50% coverage) and otherwise retained as family-level assignments.Enzymes were then assigned to coarse-grained activity classes when the inferred EC number, CAZyme family or closest characterized homologue indicated an activity compatible with known fucoidan linkage chemistry. These classes included fucose-, galactose-, mannose-, xylose- and glucuronic acid-targeting activities. Specifically, GH107, GH141 and GH168 were classified as endo-acting fucoidanases; GH29 and GH95 as exo-α-l-fucosidases; GH36 and GH97 as α-galactosidases; GH2 as β-galactosidases; GH92 as α-mannosidases; GH115 as α-glucuronidases; and GH31, GH39, GH120 and GH30 as α-/β-xylosidases. Enzyme families without support for an activity on known fucoidan residues were classified as hypothetical. All inferred activities, EC numbers and annotation confidence levels are reported in Supplementary Table 3.Phylogenetic validation of representative families was performed using MAFFT (L-INS-i; --localpair --maxiterate 100) for alignment, trimAl (-gt 0.1) for trimming and FastTree (LG + Γ model) for tree inference.Characterization of fucoidan-degrading abilities in monocultureSubstrate utilization and fucoidan-degrading capabilities of all 29 isolates were assessed by growth assays on defined carbon sources. Strains were revived from glycerol stocks in 3 ml MBL medium for 3–6 days using carbon sources matched to their metabolic requirements. Cultures were subsequently washed in carbon-free MBL medium and inoculated into 200 μl of fresh medium supplemented with a single carbon source at 0.2% (w/v), including l-fucose, d-galactose, d-mannose, d-xylose, d-glucuronic acid, or fucoidan from F. vesiculosus. Cultivations were performed in biological triplicates (n = 3) at 20 °C with orbital shaking (200 rpm) in 96-well microtiter plates (flat-bottom, polystyrene; Corning). Growth was monitored by OD600 measurements over 5 days using a Tecan Sunrise plate reader. To quantify fucoidan degradation, cultures grown on fucoidan were sampled at the final time point in early stationary phase. Cell-free supernatants were obtained by centrifugation (2,200 rpm for 10 min), remaining fucoidan was hydrolysed and quantified as described below.For time-resolved characterization, the eight degraders were cultivated in 4 ml MBL medium supplemented with fucoidan from F. vesiculosus in 24-deep-well plates (Eppendorf) sealed with breathable lids (Kuhner) and sampled throughout growth. At each time point, supernatants were collected and analysed to quantify both fucoidan-derived monomers following acid hydrolysis and free extracellular monosaccharides.Acid hydrolysis of fucoidan in supernatantsTo quantify the decrease of fucoidan-bound monomers after growth, acid hydrolysis was used to cleave the glycosidic linkages of fucoidan remaining in culture supernatants releasing its monomer constituents. Sampled supernatants (5 μl) were mixed with 45 μl of ddH2O and 50 μl of 2 M HCl. The HCl solution contained d-galactose-13C6 and d-mannose-13C6 at 15 μM each that were later used as ‘processing internal standards’ to correct technical variability introduced by the sample processing workflow. PCR plates with samples were sealed with plastic strips (Thermo Fisher Scientific AB0600 and AB0784). Acid hydrolysis was carried out for 24 h at 100 °C in an oven using a custom clamping device to prevent leakage from plates. After hydrolysis, samples were neutralized by addition of 4 M NaOH.Derivatization of monosaccharides with PMPAcid hydrolysates (10 μl sample and 15 μl ddH2O) or free monosaccharide samples (25 μl sample) were derivatized with 75 μl of 0.1 M PMP in 2:1 methanol:ddH2O with 0.4 M ammonium hydroxide for 100 min at 70 °C following a previously published protocol47. For absolute quantification, we used an external calibration curve of a standard mix containing glucuronic acid, xylose, fucose, galactose, mannose ranging from 1 mM to 200 nM prepared in a matrix identical to samples. After derivatization, samples and standards were neutralized with 2 M HCl and diluted 1:50 in 0.1% (v/v) formic acid in ddH2O containing 50 nM of injection internal standards, which was used to correct variations in ionization efficiency caused by the ion source of the mass spectrometer. These internal standards consisted of a mix of glucuronic acid, xylose, fucose, galactose, mannose derivatized with heavy labelled PMP-[d5] yielding unique masses distinct from unlabelled PMP.Targeted acquisition of PMP derivatives with LC–MSPMP derivatives were measured on a SCIEX qTRAP5500 and an Agilent 1290 Infinity II LC system. The system was equipped with a Waters CORTECS UPLC C18 Column, 90 Å, 1.6 μm, 2.1 mm × 50 mm reversed phase column with guard column and 0.2 μM inline filter. The mobile phase consisted of buffer A with 10 mM NH4Formate in ddH2O and 0.1% (v/v) formic acid and buffer B with 100% acetonitrile and 0.1% (v/v) formic acid. PMP derivatives were separated by an initial isocratic flow of 13% buffer B for 30 s, followed by a binary gradient from 13% to 36% Buffer B over 2 min, followed by a 30 s wash step with 100% buffer B and 30 s re-equilibration. The flow rate was constant at 0.5 ml min−1 with a constant pressure around 430 bar. A diverter valve was used to redirect the first 1.5 min of chromatography to waste. The temperature of the column compartment was maintained at 40 °C and the autosampler was cooled to 10 °C. The ESI source settings were 625 °C, with curtain gas set to 30, collision gas to medium, ion spray voltage to 5500 and ion source gas 1 and 2 to 90 (arbitrary units).Data were acquired using multiple reaction monitoring with previously optimized transitions and collision energies in positive mode46. For example, a galactose derivative has an exact Q1 mass of 511.2 m/z and was fragmented with a collision energy of 35 V to yield the quantifier ion of 175.0 m/z and the diagnostic fragment of 217.2 m/z. All multiple reaction monitoring transitions and retention times used to identify compounds are listed in Supplementary Table 4.Typically, each run included 150–250 samples, with randomized injection order. For quality control (QC) samples, we used the highest concentrated standard mix. QC samples and a water blank were injected every 15 samples to monitor consistency and carryover. Calibration curves were prepared in triplicate and each sample was analysed in technical duplicates. Guard columns and inline filters were replaced every 500 to 1,000 injections.Absolute quantification of monosaccharidesChromatographic data were analysed using Skyline77 v24.1.0.414, with peak areas integrated using default settings and exported for downstream quantification in Python. A reproducible example workflow is provided under https://github.com/EnvSysMicroLAB/Sichert2025_Fucoidan. In brief, peak areas of target compounds and 13C-labelled processing standards were first corrected using the injection internal standards. Subsequently, the corrected 13C processing standards were used to normalize the target compound signals. Absolute concentrations of monomers were determined by linear regression against external calibration curves and technical duplicates were averaged to obtain final concentrations.Quantification of monomer degradationTo quantify fucoidan degradation at the monomer level, concentrations of the five constituent sugars—fucose, glucuronic acid, galactose, mannose and xylose—in culture supernatants were compared to an uninoculated medium control processed in parallel. Notably, the concentrations of ‘rare’ monomers are calculated from the sum of the four non-fucose sugars, while ‘total’ monomers represent the sum of all five monomers. Degradation f of a given monosaccharide i (i ∈ {Fuc, GlcA, Gal, Man, Xyl, Rare, Total}) by strain or strain combination j, was quantified as:$${f}_{i,j}=100\times \frac{{[{\rm{S}}]}_{i,{\rm{c}}{\rm{o}}{\rm{n}}{\rm{t}}{\rm{r}}{\rm{o}}{\rm{l}}}-{[{\rm{S}}]}_{i,j}}{{[{\rm{S}}]}_{i,\text{control}}}$$
Synergistic degradation of fucoidans in the ocean - Nature
Efficient degradation of fucoidans depends on complementary bacterial guilds that cooperatively break backbone and side-chain sugars, revealing a conserved, globally relevant mechanism that shapes marine carbon cycling.
15,236 words~69 min read