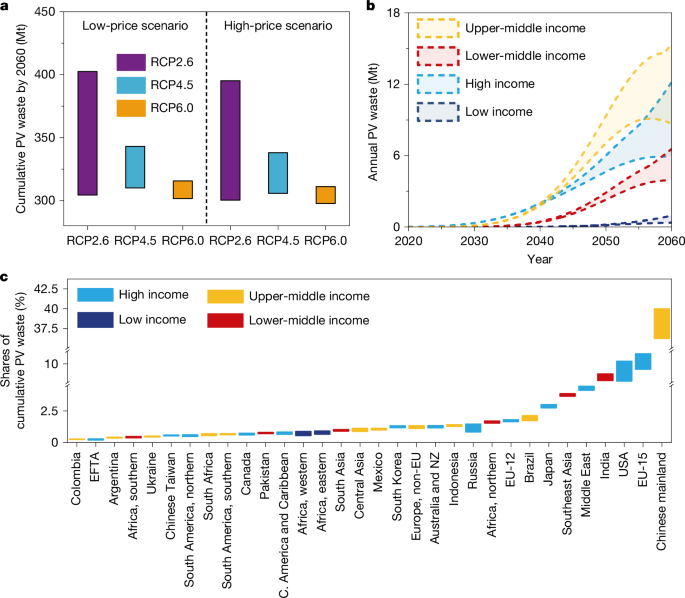
MainRapid deployment of PV systems accelerates decarbonization and expands energy access; however, the impending end-of-life (EOL) PV module waste crisis has become a global concern. By 2050, global PV waste is projected to reach 200 Mt (2 × 10⁸ t)2. Unregulated disposal of these modules presents acute environmental hazards, including the leaching of toxic heavy metals (such as lead and cadmium) into soils and groundwater systems3,4, a concern exacerbated by the untapped reservoir of valuable materials and strategic minerals (such as silicon, tellurium, silver and copper) contained within them5,6. Effectively recycling EOL PV modules is therefore not only an environmental imperative but also a strategic necessity to secure material supply chains for future PV deployment and sustain global decarbonization goals.Given the critical role of PV recycling in critical metal supply security and environmental safety, the issue has garnered worldwide attention7,8. International bodies and major economies have implemented multifaceted policies and regulations to address this pressing issue. For example, the EU has mandated the collection and recycling rate of EOL PV modules through the Waste Electrical and Electronic Equipment (WEEE) Directive, and Victoria, Australia, has implemented a landfill ban for PV waste9,10. China, the world’s largest PV installer, recently launched a comprehensive policy portfolio aiming to advance recycling technologies, reduce costs and improve resource efficiency11. These policy incentives have spurred the development of mechanical, thermal and chemical recycling technologies, each with distinct trade-offs in cost, resource recovery and emissions12,13. Compounding these dynamics is the practice of exporting EOL PV modules for recycling, driven by inadequate local capacity across regions14,15. However, the effectiveness of current PV waste management strategies remains unclear, particularly amid substantial cross-national and regional heterogeneity in socioeconomic conditions, supply-chain structures, historical PV installations, policy frameworks and technological capabilities16. Furthermore, these contextual factors are expected to evolve substantially in the future. Understanding PV waste management performance across heterogeneous regions and under plausible future scenarios (for example, climate targets, material supply constraints, installation trajectories and policy shifts) is therefore essential for developing effective, economically viable and equitable global PV waste solutions.A foundational challenge lies in forecasting PV waste generation. Existing studies have modelled waste trajectories at the global, regional and national scales13,17, but these efforts rely predominantly on demand-side factors such as historical installations, electricity demand and population growth18,19,20. Supply-side constraints, such as the price volatility of key materials such as silicon and silver, have been largely overlooked. Notably, sharp price increases for key materials (such as silicon, silver, copper) could delay global PV deployment by up to 13% (ref. 7)—a supply-side shock that shapes technology adoption, deployment scales, module lifetimes and, ultimately, waste generation dynamics. The omission of such supply-side drivers limits the accuracy and robustness of existing waste projections.Even with improved projections of waste generation, evaluating the performance of recycling technology remains a persistent challenge. Earlier studies assessing national or regional PV recycling often adopt highly simplified approaches, assuming each region will deploy a single recycling technology15,21, a ‘homogeneous scenario’ that implicitly assumes uniformity in recycling pathways across regions. In reality, technology selection is constrained by factors including existing patents, recycling infrastructure, environmental regulation stringency and waste volumes. Rather than optimal technology choices, decision-making in this space typically involves incremental adjustments within a set of feasible options, reflecting ‘bounded rationality’22, a dynamic ignored in PV waste management research. While some studies have incorporated temporal changes in recycling technologies23, they rely on exogenous assumptions of rapid cross-regional technology substitution or diffusion, failing to capture the path dependence of technological development24 driven by economic constraints, learning curves and institutional adaptability in practice.Compounding these analytical gaps, existing research also predominantly assumes local treatment of decommissioned PV modules21,25,26. Few studies have examined whether and to what extent PV waste trade drives inter-regional inequality in the distribution of economic and climate benefits from recycling. Yet the global landscape is far from uniform, characterized by an uneven distribution of recycling capabilities. Mature technologies are concentrated in high- and middle-income regions (such as the EU, the United States, China, Japan and South Korea), in contrast to low-income regions, which lack the technical expertise and industrial capacity for independent recycling and are therefore reliant on outsourced recycling. This imbalance underscores the need for cross-regional collaboration, yet the performance of outsourced recycling models remains poorly understood. Furthermore, while subsidies are widely used as a policy tool to improve the economic viability of PV recycling5,27,28, it remains unclear to what extent different subsidy designs, such as continuous versus declining support, or linkage to carbon prices, affect the overall economic benefits and their distribution across regions.To address these interconnected gaps, we developed an integrated model to evaluate multiple PV recycling scenarios (Methods). We apply this model to 32 regions and quantify disparities in economic benefits across 1,708 recycling practice scenarios (Extended Data Fig. 1). Our results show that sustained increases in material prices could delay global PV deployment and reduce module decommissioning by up to 8.4% and 2%, respectively. Under this constrained context, carbon-priority recycling technologies deliver the largest global economic and climate benefits. However, when international trade is introduced, a critical trade-off between efficiency and equality emerges. While economies of scale and technological learning lower global recycling costs, the associated benefits accrue increasingly to technologically advanced, upper-middle-income regions with large PV waste arisings, therefore widening regional disparities. Cost-based subsidies can narrow regional benefit gaps, whereas carbon-price-based subsidies may further widen global inequalities by disproportionately favouring regions with mature recycling technologies and established carbon markets. To reconcile efficiency and equality, we propose adaptive strategies—for example, phased subsidy frameworks that initially address critical deployment barriers while incentivising long-term innovation. Moreover, international cooperation mechanisms, such as Paris Agreement partnerships, should further prioritize technology transfer and targeted funding to build local recycling capacity in low-income regions. These insights offer actionable pathways toward equitable and scalable circularity for PV waste.Global and regional PV wasteDriven by the explosive expansion of PV installed capacity, global PV waste generation is projected to increase substantially. Annual global PV installations have surpassed 100 GW (1 × 10¹¹ W) annually since 2020, lifting the total installed capacity from less than 800 GW in 2020 to 3,781 (under Shared Socioeconomic Pathway 1-6.0 (SSP1-6.0)), to 5,037 GW (under SSP1-2.6) by 2030 and further to 8,703 (under SSP3-2.6) and 24,544 GW (under SSP2-2.6) by 2060. Assuming an average PV module lifetime of 25–30 years, a global peak in module retirements is anticipated during 2030–2060. Our projections show that annual global PV module retirements rise from 0.02 Mt yr−1 in 2020 to 0.5 Mt yr−1 by 2030, then over 19 Mt yr−1 by 2060, driving cumulative waste to surge by approximately 150–200-fold during 2030–2060, reaching 297 Mt (under SSP1-6.0) to 402 Mt (under SSP1-2.6) by 2060.The geographical distribution of this waste burden is shifting over time (Fig. 1b,c). From 2020 to 2040, high-income regions dominate, generating over 50% of global PV waste (12.2–12.5 Mt). Among these, the EU-15 is the primary contributor, producing 5.8–5.9 Mt (25.2–26.0% of the global total). However, by 2060, upper-middle-income regions take the lead, with China emerging as the largest single source. China alone is projected to generate 112.8–160.5 Mt, accounting for 36.2–39.9% of global PV waste, substantially surpassing the EU-15 (30.9–39.7 Mt) and the United States (25.7–39.0 Mt). Concurrently, the share of lower-middle-income regions nearly doubles, increasing from 7.7–8.1% in 2040 to 15.9–16.9% in 2060. India dominates this group, contributing 8.6–9.2% (26.8–35.2 Mt) of global waste by 2060. By contrast, low-income regions remain minor contributors, accounting for less than 2% throughout 2020–2060.Fig. 1: The global distribution of solar PV waste.a, Global cumulative solar PV waste under different PV decommissioning scenarios (n = 28) by 2060. RCP, Representative Concentration Pathway. b, Annual PV waste across income groups under different scenarios. The classification of income groups is provided in Supplementary Table 1. c, The distribution of cumulative shares of solar PV waste across scenarios by 2060. The regional classification follows that used in the global change analysis model (GCAM), as described in Supplementary Table 2. C. America, central America; EFTA, European Free Trade Association; NZ, New Zealand.Source dataMaterial prices have a pivotal role in shaping PV deployment and waste trajectories. Our modelling assesses the impacts of elevated copper, aluminium, silver and silicon prices on PV expansion and decommissioning dynamics (Extended Data Fig. 2). Compared with the low-price baseline, high-price scenarios reduce global cumulative installed PV capacity and waste volumes by 2060 by 5.7–8.4% (597–1,966 GW) and 1.0–2.0% (2.9–7.3 Mt), respectively, equivalent to a 5-year delay in meeting RCP2.6 installation targets. Even under less stringent RCP6.0 climate goals, higher material costs yield comparable reductions: 5.7–7.6% in capacity and 1.0–1.4% in waste. Regional PV waste volumes are differentially affected by material price increases (Extended Data Fig. 3). For regions with larger installed PV capacity, specifically China, the United States and India, their PV waste drops more substantially, by 0.93–2.47 Mt, 0.29–0.89 Mt and 0.31–0.68 Mt under high-price scenarios relative to the low-price scenarios, respectively. For regions with relatively small volumes of PV installations (such as Argentina), the material price has a limited impact, with PV waste dropping by 0.01–0.03 Mt.Economic and climate benefitsWe evaluated the global economic and climate performance of local PV waste recycling (excluding cross-border trade) across four technology pathways: business as usual (BAU), economic-priority, carbon-priority and technology diffusion. These pathways integrate chemical, thermal and mechanical recycling approaches, which present divergent economic returns and carbon mitigation potential (Supplementary Fig. 1).Relative to the BAU pathway, the carbon-priority and economic-priority pathways deliver substantially greater economic and climate benefits by shifting recycling capacity towards thermal technologies, which deliver the highest per-unit benefits among the three recycling technologies (Supplementary Fig. 1). Under all of the decommissioning scenarios, these two pathways yield comparable performance and significantly outperform the BAU pathway. By 2060, cumulative economic benefits reach US$670.8 billion and climate benefits reach 2.44 Gt carbon dioxide equivalent (CO2 equiv.) under the carbon-priority pathway (Fig. 2k,o), compared with US$662.0 billion and 2.40 Gt CO2 equiv. under the economic-priority pathway (Fig. 2j,n), representing gains of more than 60% relative to the BAU pathway. These outcomes are driven primarily by the larger role of thermal recycling, which accounts for 44.0–51.6% of total recycling capacity by 2060, versus 10.1% under BAU (Extended Data Fig. 4).Fig. 2: Climate and economic benefits of PV waste recycling.a–p, Climate and economic benefits of PV waste recycling under the BAU (a,e,i,m), economic-priority (b,f,j,n), carbon-priority (c,g,k,o) and technology diffusion (d,h,l,p) technology pathways between 2020 and 2060, expressed on both a per-tonne and cumulative global basis of PV waste. a–d, Unit net economic benefits. e–h, Unit climate benefits. i–l, Cumulative net economic benefits. m–p, Cumulative climate benefits. In i–l, the x axis is displayed on a log10 scale. For each recycling technology pathway (n = 28 PV decommissioning scenarios; Supplementary Table 3), the bars indicate the mean economic or climate benefits, and the whiskers indicate the minimum and maximum values across all associated PV decommissioning scenarios.Source dataMinor discrepancies between the carbon-priority and economic-priority pathways mainly originate from variations in thermal recycling market penetration. Under the economic-priority scenario, investment constraints slow the early expansion of capital-intensive thermal recycling in middle-income regions where PV waste accumulates most rapidly. For example, in 2040, thermal recycling achieves a 22.7% market share in middle-income regions under the carbon-priority pathway versus 19.8% under the economic-priority pathway (Extended Data Fig. 4a,d). By contrast, the technology-diffusion pathway yields more-moderate gains, increasing global cumulative net economic and climate benefits by 37.0–44.3% and 34.3–36.1%, respectively, relative to the BAU pathway. While this pathway extends adoption across more regions, its impact is constrained by the dominance of mechanical recycling, which exceeds 50% and delivers lower economic and climate returns than thermal and chemical recycling.PV waste recycling becomes economically viable across all scenarios between 2035 and 2040 (Fig. 2a–d,i–l), driven by rising material prices and technological progress. Higher market prices for recovered materials, especially silver, aluminium and silicon, increase unit recycling benefits from US$131.8–304.3 per tonne in 2020 to as much as US$457.1 per tonne by 2040, while the learning-by-doing effect reduces recycling costs from US$342–2,550 per tonne to US$55.9–402.7 per tonne over the same period. As a result, cumulative net economic benefits under high-price scenarios exceed those under low-price scenarios by 25.9–33.6% by 2060 across all pathways (Extended Data Fig. 5).Distinct regional heterogeneities are observed across all pathways (Fig. 3a–h). Middle-income regions consistently produce larger economic and climate benefits than other income groups. For example, under the carbon-priority pathway, benefits in upper-middle-income regions cluster in the top-right quadrant: roughly two-thirds of economic benefits range from US$1,659.2 to 2,895.8 per tonne, and roughly two-thirds of climate benefits range from 6.5 to 8.5 t CO2 equiv. per tonne. By 2060, these regions contribute over 50% of global cumulative net economic benefits and cumulative climate benefits, as they generate more than half of global PV waste and reach a thermal recycling share of up to 30%, establishing them as the primary contributors to global PV recycling benefits. Conversely, high-income regions contribute a smaller proportion. Despite accounting for 34.0–36.3% of global decommissioned PV waste, they deliver only 28.7% of cumulative net economic benefits and 37.6% of cumulative climate benefits by 2060 (Fig. 3k,o), due to higher recycling costs and lower waste throughput. Furthermore, low-income regions exhibit substantial underperformance. Even under the technology-diffusion pathway, their contribution is negligible—by 2060, they account for merely 1.3–2.1% of total economic gains (US$4.2–10.6 billion) and 1.2–1.8% of total avoided emissions (18.2–32.7 Mt CO2 equiv.), mainly owing to limited recycling scale and lower technological maturity.Fig. 3: Climate and economic benefits of PV waste recycling across income groups.a–p, The climate and economic benefits of PV waste recycling across income groups under the BAU (a,e,i,m), economic-priority (b,f,j,n), carbon-priority (c,g,k,o) and technology diffusion (d,h,l,p) technology pathways in 2060. a–d, Unit benefits per tonne of PV waste. e–h, Cumulative global totals. i–l, Mean shares (%) of cumulative net economic benefits by income group. m–p, Mean shares (%) of cumulative climate benefits by income group. The classification of income groups is provided in Supplementary Table 1. The scatter points include all region–scenario combinations. Each point represents a single region under a specific PV decommissioning scenario (Supplementary Tables 1 and 3).Source dataRegional heterogeneities are further intensified when material price effects are incorporated into recycling pathways. For example, under the carbon-priority pathway by 2060, the largest inter-regional gap in unit net economic benefits expands from US$1,945.7 per tonne under low-price scenarios to US$2,387.8 per tonne under high-price scenarios (Supplementary Fig. 2b). This growing divergence is driven by variations in recycling technology portfolios: regions with higher economic benefits (such as China and South Korea) depend more on thermal technologies, which enable superior metal recovery efficiencies. As material prices rise, these regions capture a disproportionate share of incremental value. By contrast, low-income regions dominated by mechanical recycling, a method associated with lower material recovery efficiency and output quality, accrue fewer incremental benefits.Inequalities from recycling outsourcingTo assess how cross-regional PV waste recycling influences economic and climate benefits, we extend the local recycling framework (which excludes trade) to incorporate three trade regimes: extended producer-responsibility-oriented trade (EPR), expanded global trade and regional trade (Methods). This generates scenarios combining technology pathways and trade regimes (such as BAU–EPR). For each scenario, we evaluate disparities in recycling benefits across 32 regions using economic and climate benefit variances (Fig. 4), ranging from 0 to 1. The scenarios fall into four distinct categories: high benefits with high inequality, high benefits with low inequality, low benefits with high inequality and low benefits with low inequality.Fig. 4: Changes in recycling benefits and their variance under different trade scenarios by 2060.a–f, Changes in recycling benefits and their variance under the BAU (a,d), economic-priority (b,e) and carbon-priority (c,f) trade scenarios by 2060. a–c, Normalized cumulative net economic benefits and their associated variance across different trade scenarios. d–f, Normalized cumulative climate benefits and their associated variance across different trade scenarios. All indicators are normalized using min–max normalization. The dashed lines indicate the mean of benefits and the mean of the variance under each trade scenario. The combination of technology diffusion and trade was not considered, as technology diffusion implies sufficient local recycling capacity across regions. The scatter points include all decommissioning scenarios (Supplementary Table 3). Details of the normalization methodology are provided in the Methods.Source dataThe least favourable outcomes occur under the BAU–EPR scenarios that entail low benefits and high inequality. By 2060, with mechanical recycling dominating (nearly 60%) in these scenarios, economic and climate benefits account for only 29.3–55.9% of the maximum observed potential. Meanwhile, the average normalized variance is approximately 0.12 (Fig. 4a,d), substantially higher than that observed in other trade scenarios (0.02–0.03). Similarly, local recycling scenarios show relatively high equality but lower overall benefits, as restrictions on cross-regional flows prevent PV waste from reaching middle- and high-income regions that have more advanced recycling technologies and faster learning. Consequently, the economic and climate benefits are 68.6–77.5% of those under trade-enabled scenarios (Extended Data Fig. 6).Among all scenarios, the carbon-priority-oriented EPR scenarios achieve the maximum global recycling benefits; however, they generate greater regional disparity (Fig. 4). Under these scenarios, PV waste flows towards regions with advanced technologies and low recycling costs. This leads to global cumulative net economic benefits of US$529.1–935.5 billion and emission reductions of 2.2–3.32 Gt CO2 equiv., both exceeding those of other scenarios (US$189.2–926.3 billion and 0.9–3.31 Gt CO2 equiv.). However, this concentration of recycling activities in a few ‘low-cost sinks’ substantially exacerbates inequalities in the distribution of benefits. In particular, higher material prices further intensify this economic benefit disparity, with variance values (0.47–1.0) significantly surpassing those observed under low-price scenarios (0.29–0.64). This is because high material prices disproportionately improve unit net economic returns in technologically advanced regions (such as upper-middle-income regions). Consequently, upper-middle-income regions stand out as the primary recycling stakeholders (Extended Data Fig. 7): their share of cumulative total net economic benefits increases from roughly two-thirds in locally oriented recycling scenarios to around three-quarters under carbon-prioritizing EPR frameworks, alongside a corresponding 0.5–0.7 Gt CO2 uplift in their cumulative carbon emission reductions.By contrast, expanded global and regional trade scenarios lead to a more even distribution of recycling activities, reducing benefit variance to 0.003–0.448 and 0.008–0.489, respectively. However, these gains in equality come at the expense of global benefits. This is mainly because these trade scenarios disperse PV waste to regions with weaker learning effects (for example, lower-middle-income regions) and greater cost disadvantages (for example, high-income regions) (Extended Data Figs. 8 and 9), thereby diminishing the overall benefits. For example, the average share of recycling benefits accruing to lower-middle-income regions increases from 3.6–4.3% under EPR to 4.8–6.0% under expanded global trade and 6.7–8.2% under regional trade (Extended Data Fig. 7g–l). However, because unit net benefits in these regions remain lower than in upper-middle-income regions, both trade scenarios weaken overall performance relative to EPR. Compared with EPR, expanded trade reduces global cumulative net economic benefits by 5.8–8.6% and climate benefits by up to 4.9%, whereas regional trade lowers them by 2.1–5.4% and 2.8%, respectively. These results reveal a trade-off between maximizing total recycling benefits and distributing them more evenly.Subsidies for addressing inequalitiesTo further evaluate the influence of policy interventions on economic benefits and regional distribution patterns, we developed five subsidy schemes: no subsidy, continuous subsidy, declining subsidy, low-carbon price and high-carbon price (Methods).Among all subsidy schemes, the declining subsidy, continuous subsidy and low-carbon-price subsidy improve inter-regional equality by 5.8–8.1%, 5.2–6.9% and 0.5–3.8%, respectively, whereas the high-carbon-price subsidy scheme exacerbates inequality (Fig. 5). The declining-subsidy scheme is substantially more cost-effective: it requires only 2.9–11.9% (US$0.4–1.9 billion by 2060) of continuous subsidy expenditures yet achieves 0.6–1.2% greater equality improvements. For example, the inter-regional gap in unit net recycling benefits narrows from US$1,147 per tonne of recycled PV waste in the no-subsidy scheme to US$1,061 per tonne in the declining-subsidy scheme, demonstrating superior equality outcomes. This improvement stems from a time-differentiated phase-out mechanism that gradually removes subsidies as recycling becomes self-sustaining. The timeline varies by region’s economic capacity: middle-income regions reach profitability around 2032 and phase out subsidies by 2044, while high-income regions achieve viability by 2040 and phase out subsidies by 2058. By withdrawing fiscal support once recycling is profitable, this approach prevents some regions from accumulating excessive profits through continued subsidies, thereby reducing inter-regional inequality.Fig. 5: Changes in cumulative subsidies, variance in unit net recycling benefits and gaps in unit net recycling benefits.a–d, Cumulative subsidies under the continuous-subsidy (a), declining-subsidy (b), low-carbon-price (c) and high-carbon-price (d) subsidy schemes. The dashed lines indicate the corresponding minimum and maximum values. e–h, Variance in unit net recycling benefits and changes in inter-regional gaps in unit net recycling benefits under the continuous subsidy (e), declining subsidy (f), low-carbon-price (g) and high-carbon-price (h) subsidy schemes. The gaps in unit net recycling benefits represent the maximum difference in unit net recycling benefits across 32 regions within the same scenario. The scatter points include all combinations of recycling technology, recycling trade and PV decommissioning scenarios (Supplementary Table 3), and represent values averaged over 2020–2060 for each scenario combination. The dark circles indicate the mean values averaged across all scenario combinations, and the lines represent the corresponding minimum and maximum values.Source dataUnder the continuous-subsidy scheme, recycling benefits increase substantially, rising from US$189.6–935.5 billion in the no-subsidy scheme to US$198.9–953.7 billion by 2060. The inter-regional gap in unit net recycling benefits also narrows slightly, from US$1,150 per tonne of recycled PV waste under the no-subsidy scheme to US$1,068 per tonne under the continuous-subsidy scheme (Fig. 5). Despite these gains, the fiscal cost is prohibitive. In middle-income regions, for example, recycling benefits increase from US$110–128 per tonne in 2032 to US$1,131–1,782 per tonne in 2060, but this is only 1.7–2.9% higher than the performance under the declining-subsidy scheme. By contrast, cumulative expenditure under the continuous-subsidy scheme reaches US$16 billion by 2060, 9.5 times higher than that under the declining-subsidy scheme. Thus, continuous subsidies deliver only marginal additional benefits at a much higher cost, whereas the declining-subsidy scheme achieves nearly the same outcomes with a much lower expenditure.Low-carbon price subsidies also improve inter-regional equality, although the effect is limited. Compared with the no-subsidy scheme, the low-carbon price scheme reduces the inter-regional gap in unit net recycling benefits by up to 3.8% over 2020–2060, owing to differentiated subsidy allocations. Regions with higher recycling costs, such as Canada, EU-12 and EU-15, receive carbon price subsidies of US$63.1–158 per tonne of CO2 equiv., whereas lower-cost regions, such as China and South Korea, receive only US$7.5–89 per tonne of CO2 equiv. (Extended Data Table 1). This differentiated allocation partially offsets cost disadvantages and narrows inter-regional gaps.Most high-carbon price schemes (>85%) worsen inequality. The core issue is unequal subsidy distribution: high-income regions receive carbon price subsidies of up to US$200 per tonne of CO2, nearly four times higher than those in developing economies. This disparity would be further amplified by higher material prices, which would disproportionately increase recycling profits in high-income regions. As a result, the inter-regional gap in unit net recycling benefits widens to US$1,198–1,434 per tonne of recycled waste, 1.4–4.3% above schemes without subsidies, entrenching rather than bridging the benefit gap between regions.Equitable global PV waste managementOur study integrates economic, climate, technological and policy dimensions to provide a methodology to assess PV waste management under regional heterogeneity and uncertainty. We show that even with technological learning, the break-even point remains more than a decade away, underscoring the need for new circularity strategies. Indeed, regions have distinct but complementary roles in the global recycling system, and coordination mechanisms (such as the Green Climate Fund29 and the Global Environment Facility30) are needed to mobilize cross-border capital, technology and expertise. Our results further reveal a central dilemma: while PV waste trade increases overall recycling benefits, it exacerbates regional revenue inequality. We further find that cost-based subsidies can effectively mitigate this imbalance, pointing to the need for a coordinated global policy mix that supports efficient, low-cost and equitable PV recycling.Regulations and quantifiable targets are central to large-scale recycling, yet only a few regions (such as the EU and China) have introduced PV-specific recycling requirements31. The EU’s WEEE Directive mandated an 80% recycling rate by 2018, while China aims to recycle 250,000 t of retired PV modules by 2027 (ref. 32). However, weight-based targets often prioritize recovering bulk materials such as glass and aluminium frames8. Regions with stronger institutional capacity therefore need more targeted goals for high-value but low-concentration materials, such as silver and silicon, to stimulate market development. By contrast, low-income regions require international support for institutional transfer and capacity building. Proven approaches, such as the EU’s EPR framework, mandatory recycling targets and landfill restrictions, can be adapted to local contexts. Meanwhile, tightening global waste-trade regulations (such as the Basel Convention, EU battery regulations and China’s plastic import ban)33,34,35, together with rising geopolitical uncertainty, underscore the need for transparent and standardized cross-regional recycling cooperation. Such mechanisms can reduce the environmental and health risks of informal processing while also harmonizing standards, enabling data sharing and clarifying responsibilities. Together, these functions would form a more coordinated global governance network.Technology-wise, rising prices for high-value recovered materials (such as silver, silicon and copper) have a particularly critical role in improving economic returns. However, existing recycling technologies struggle to extract high-purity materials. For example, photovoltaic-grade silicon requires a purity of over 6 N (and increasingly 8 N/9 N), yet it remains economically challenging to remove carbon and metallic impurities at scale, leading to downgraded applications such as battery anodes36,37,38. Thus, investment in high-purity refining technologies such as directional solidification is urgently needed38.Regions such as Europe, the United States, Japan, South Korea and China have developed high-value recycling pathways based on thermal and chemical processes, supported by mature semiconductor industries and stable demand for high-purity materials39. These regions are therefore well positioned for advanced refining and value recovery. By contrast, less-developed regions, particularly in Africa, rely mainly on low-cost mechanical dismantling or informal channels for basic preprocessing and sorting40,41. For these regions, the priority is to build affordable, basic recycling capacity. With international cooperation, including under the Paris Agreement42, technology transfer and capacity building could help PV recycling in these regions progressively move from low-end processing to higher-value-added activities. Our results show that, under a technology diffusion scenario, low-income regions could still achieve net profits of US$4.2–10.6 billion by 2060, suggesting substantial scope to reduce global PV recycling inequalities and build a more resilient system.From an economic perspective, technological innovation alone cannot ensure PV recycling viability. Our research indicates that global PV recycling may not yield a net profit in the near term arguably due to lower initial treatment capacity as well as high capital costs associated with technologies. A diversified set of economic incentives must be introduced, including fiscal subsidies, market-based mechanisms (such as carbon pricing) and investment support policies, to lower entry barriers and encourage industry participation43. Existing policy tools, such as the US Qualifying Advanced Energy Project Credit (48C) Program, provide financial support44. However, prolonged high subsidies may distort markets, impede innovation and even widen regional disparities (as observed in high-carbon-price subsidy scenarios)45. A more sustainable approach is to provide early-stage support and phase it out as the market matures, for example, through declining subsidy schemes27. Furthermore, most low-income and lower-middle-income regions lack the fiscal capacity to provide subsidies independently. Thus, cross-regional financial transfers, including those through climate finance mechanisms such as the United Nations Capital Development Fund46, are essential to lower entry barriers by bridging fiscal gaps. Simultaneously, low-income regions should design locally adapted support schemes rather than simply replicating subsidy models for high-income regions, which may pose long-term distortion risks.Note that refurbishment and reuse of PV modules can, in principle, deliver substantially greater environmental and resource-efficiency benefits47. Such strategies effectively delay demand for resource-intensive recycling infrastructure in capacity-limited regions. Similarly, while surging prices of key metals (such as silver, copper and high-purity silicon) can enhance PV recycling viability, they often escalate deployment costs for price-sensitive developing economies7. By contrast, reuse-oriented strategies reduce reliance on producing new modules, allowing the benefits of the circular economy to decouple from rising material prices, therefore providing a strategic buffer against material cost pressures. This not only helps to mitigate revenue imbalances driven by regional cost disparities but also ensures the continuity of energy transitions in low-income regions7. However, large-scale reuse is constrained by performance heterogeneity, latent reliability risks and limited market confidence in the durability of second-hand products48,49. Thus, at this stage, reuse is best positioned as a complementary transitional strategy alongside EOL recycling, to build a more resilient and inclusive global closed-loop PV system.Although our study attempted to account for various real-world scenarios as comprehensively as possible, certain limitations remain, presenting opportunities for future research. To enhance comparability across scenarios, we primarily modelled subsidies in annualized form, with one-time grants simplified as equivalent continuous support. This approach may understate the role of upfront incentives in triggering early investment and accelerating technology diffusion50. Future research could therefore consider more detailed subsidy timing, payment structures and dynamically adjustable policy designs.MethodsHere we develop an integrated modelling framework to project PV waste generation across 32 global regions and to quantify the environmental and economic benefits of alternative recycling strategies that will inform policy design (Extended Data Fig. 1 and Supplementary Table 3). The framework consists of three interconnected components. First, material price trajectories are generated and incorporated into the GCAM to simulate regional PV deployment under alternative socioeconomic–climate futures. GCAM electricity-generation outputs are then converted into installed PV capacity and passed to a dynamic material flow analysis to estimate regional EOL PV waste. Second, projected waste streams are coupled with life-cycle assessment (LCA) and life cycle cost (LCC) to quantify technology-specific economic and climate outcomes of PV recycling. Third, a multidimensional scenario design, covering decommissioning pathways, recycling technologies, international trade configurations and subsidy schemes, is applied across the modelling system to assess how policy and market structures reshape regional recycling outcomes. Detailed parameter settings are provided in Supplementary Tables 4–9.Material price modelTo account for the impact of price uncertainty of critical materials on PV recycling, we simulate long-term price trajectories for four solar-relevant critical materials: copper, aluminium, silver and silicon. We adopt a material price model that was developed in previous studies7,51,52, incorporating historical price dynamics, demand growth and substitution potential. The resulting price trajectories are then introduced as exogenous inputs into the GCAM to determine PV deployment pathways under climate targets (as detailed in the next section). Rather than generating precise forecasts of future prices, our objective is to construct scenario-based price trajectories that enable the evaluation of PV deployment and recycling pathways under long-term material price uncertainty.The material price model is grounded in dynamic market equilibrium in which long-term prices are endogenously determined by the marginal cost of new supply required to meet future demand. When existing mining capacity is insufficient, additional mining projects must be operated. Material prices are therefore endogenously governed by the marginal cost of newly installed mining capacity.The modelling procedure consists of three steps:Step 1: demand projection. Future demand for critical materials is determined by the demand growth rate and price-responsive substitution effects:$${Q}^{t+1}={Q}^{t}(1+g+\Delta {p}^{t}\times \varepsilon )$$
Towards an equitable future of global photovoltaic waste recycling - Nature
Global photovoltaic waste will reach 297–402 million tonnes by 2060, and regionally adapted recycling strategies and international cooperation will be needed to provide equitable and scalable PV waste circularity.
14,719 words~67 min read