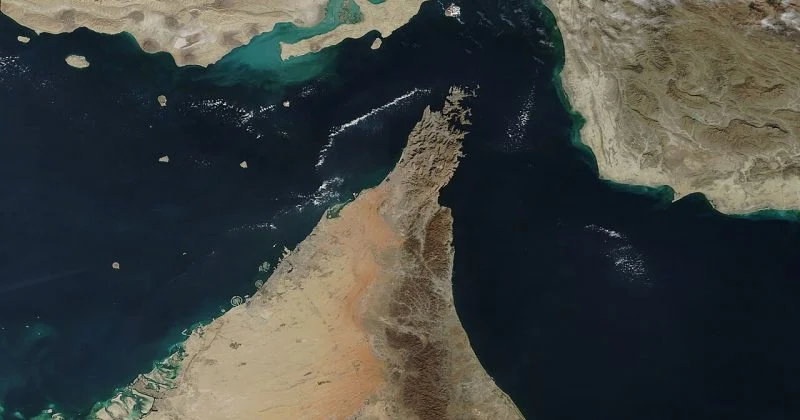
Geopolitical risk, the familiar catalyst, is sending crude oil prices higher, again. The peace agreement between the US and Iran, which was already regarded as a fragile one, came under the biggest strain yet on July 7, as both countries traded fresh rounds of attacks.Till then, it appeared like the crude bears had bowled out the bulls. Their confidence that the surge in Dated Brent prices was temporary was reflected in the steep backwardation curve of Brent futures.However, now, with Hormuz disruption back in play, and crude prices on the rise again, it appears this time it’s different. The price behaviour within the crude complex is not the same as the earlier rally.When the Strait of Hormuz was closed in early March, as an initial reaction, Dated Brent, the one representing the physical crude oil prices for immediate delivery, surged 45 per cent, outperforming the Brent futures’ 36 per cent rise in the first ten days of the conflict. But since the recent escalation, so far, Brent futures has rallied 22 per cent, margianlly outperforming Dated Brent, up 21 per cent. Interestingly though, one important factor remained at elevated levels and never cooled: Crack spread, which is the price difference between a barrel of raw crude oil and refined products made from it like gasoline, diesel etc. Even when the prices of both Dated Brent and Brent futures fell post the signature of Memorandum of Understanding between the US and Iran on June 18, the crack spread did not correct much. In fact, post the re-escalation now, it surpassed the peak of $59.77/barrel it had hit early during the war and marked a fresh all-time high of $69.16/barrel on July 15.Why has the crack spread stayed higher? What does the price behaviour of Dated Brent and Brent futures signal? What do both mean for the prices? Here’s an analysis.The bottleneck The 3-2-1 crack spread, a widely-used proxy for refinery gross margin, measures the difference between the value of refined products and the cost of crude oil. It assumes that three barrels of crude yield two barrels of gasoline and one barrel of distillate such as diesel, jet fuel or heating oil. The process of refining is also referred to as cracking, hence the name.Unlike Brent futures and Dated Brent, the crack spread witnessed only a modest correction after the announcement of the US-Iran peace deal in June. While the spread declined 28 per cent from its peak, both Brent futures and Dated Brent slumped to the low in early July, losing by 41 per cent and 53 per cent respectively.The latest escalation pushed the spread to a record high of $69.16/barrel on July 15. This comes even as crude oil prices are nowhere near the wartime record-highs despite the recent rally. As a per cent of Brent futures, the crack spread increased from 46 per cent to a substantial 86 per cent on July 6. It stands at 71 per cent now.The divergence suggests that refined-product markets are considerably tighter than the crude market. More importantly, the tightness appears to be driven more by supply constraints rather than a surge in demand.Part of the explanation lies in inventories. According to the US Energy Information Administration (EIA), for the week ended July 3, distillate inventories were 12 per cent below the five-year average, while gasoline inventories were 6 per cent below the average.Gasoline inventories were lower due to a combination of factors such as lower production, lower imports and higher exports. At the same time, refiners appear to have prioritised distillates as margins remained significantly stronger. The refining gross margin for distillate (also referred as distillate crack) currently stands at about $84/barrel compared to gasoline crack of $52/barrel.The preference for distillates has coincided with disruptions to Russian refining operations. Ukraine’s attacks have affected more than a quarter of Russia’s refining capacity, and the refinery runs have slumped to a two-decade low. This curtailed supplies of diesel and other refined products as well. Russia has also imposed temporary ban on diesel exports until July 31 and also restriction of sales of gasoline and jet fuel.Longer shipping routes following the disruption of traditional trade flows have added to distillate consumption, further tightening balances.So, broadly, the bottleneck appeared to have shifted from crude oil supplies to refined product supplies. Consequently, refining margins have continued to strengthen even after the crude market shed much of its geopolitical risk premium. However, the recent re-escalation can complicate things. Factoring in the above, the latest rally in crude oil prices appears to be driven more by precautionary risk premium than by signs of immediate physical shortage.Fear but not frenzy After the US attacked Iran for the first time in February, crude oil prices surged. Dated Brent, the benchmark for physical cargoes, rallied 104 per cent to hit a high of $144.46/barrel on April 7, while Brent futures gained 64 per cent to touch $119.50/barrel on March 9. Notably, futures peaked nearly a month before the physical benchmark.The divergence reflected the scramble for prompt barrels — oil available immediately. Brent futures, on the other hand, quote oil for delivery at a future date. With the Strait of Hormuz shut and uncertainty surrounding replacement supplies, buyers were willing to pay steep premiums for cargoes that were already available. Consequently, Dated Brent’s premium over Brent futures widened to a record $35.87/barrel on April 9.The same message was visible in the futures curve. Near-term contracts significantly outperformed deferred contracts, pushing the market into steep backwardation. Futures curve in backwardation means near-term oil contracts trade at a premium to the longer-dated ones. The spread between the front-month (September 2026) and the June 2027 Brent futures contract widened to a record $42.99/barrel on March 9.The latest escalation has produced a different response. Since July 7, Brent futures have risen 22 per cent, whereas Dated Brent is up 21 per cent. The spread between the September 2026 and June 2027 Brent futures contracts has also recovered only modestly to about $10/barrel, well below the levels seen during the peak of the Hormuz disruption.The difference is because, earlier, prices were anchored by a genuine shortage of immediately-available barrels. Today, prices appear to be anchored more by expectations than by physical scarcity.That said, the current calm in the physical market is contingent on oil continuing to flow. And there lies the real risk.Thinner cushion The last time the Strait of Hormuz was shut, the oil market had a cushion. This time, that appears considerably thinner.Following the June 18 peace deal between the US and Iran, the US EIA lowered its Brent crude forecast for 2026 to $82/barrel from $95/barrel earlier and projected prices to average $65/barrel in 2027. But the outlook was based on the assumption that oil would continue flowing through Hormuz.The first disruption was absorbed through a combination of factors such as inventories, strategic reserves, rerouted trade flows and weaker demand. EIA’s Short-Term Energy Outlook (STEO) projects OECD commercial crude and liquids inventories (ex-US) to decline from 1,543 million barrels at the end of 2025 to 1,303 million barrels by the third quarter of 2026, a drawdown of 240 million barrels.Moreover, EIA recently noted that inventories at Cushing, Oklahoma, have approached levels near the “tank bottoms”, raising concerns about availability. Since storage facilities require a minimum volume of oil to remain operational, not every barrel reported in inventories is necessarily available to the market.The total inventory in the US, that includes Strategic Petroleum Reserves (SPR) and commercial stocks, is already down by 145 million barrels to 726 million barrels between Mar 20, when SPR access began, and July 10. SPR dropped by 99 million barrels to 316 million barrels, whereas commercial stocks decreased by about 47 million to 410 million barrels.Global oil consumption is estimated to decline by 1.2 million barrels/day this year, largely because of weaker demand in Asia. The slowdown in demand was another factor that helped absorb the first disruption.At the same time, spare production capacity has shrunk sharply. The EIA estimates OPEC’s surplus production capacity at just 0.44 million barrels/day in 2026, down from 3.43 million barrels/day in 2025. Notably, spare capacity in West Asia is estimated at zero from the second quarter through the rest of this year.The EIA had expected inventories to begin rebuilding from the fourth quarter and spare capacity to recover in 2027. Instead, the market faces another disruption before restocking has even begun.The strain is already visible in fuel markets. According to the IEA (International Energy Agency), global refinery throughput in June was about 6 million barrels/day lower than a year ago as West Asian export refineries remained disrupted, Russian refinery runs were curtailed and several Asian plants continued to operate below normal levels. Russian refinery output alone was about 1.6 million barrels /day lower than last year, while diesel exports have roughly halved in recent weeks.More recently, the IEA warned that the global economy has only a matter of weeks and not months before a prolonged disruption through Hormuz begins to cause broader economic damage.Stakes are highIn our Big Story, The 900-million-barrel question in bl.portfolio edition dated May 10, we had noted how from March 1 till then, cumulatively around 900-million-barrels in crude oil supply was lost and that a quick full opening of the Strait of Hormuz was essential to prevent flare-ups in oil prices. Release from strategic reserves by many countries, lower imports by China, higher exports by the US and modest demand destruction had saved the day till the MoU between the US and Iran came into force.This time, it’s different. The latest escalation comes at a time when many of those buffers have weakened. OECD commercial crude and liquids inventories, a widely-followed proxy for global oil stockpiles, are projected to be down by 240 million barrels from 2025-end levels. In the US, combined SPR and commercial inventories have already fallen by 145 million barrels since March 20. At the same time, OPEC’s spare production capacity has shrunk to just 0.44 million barrels/day in 2026 from 3.43 million barrels/day in 2025, while refined-product markets remain exceptionally tight, as reflected in the record-high crack spread.The risks are also widening. Iran has threatened disruption through the Bab-el-Mandeb Strait, another critical shipping route, while any recovery in Chinese crude imports could tighten balances further. For now, the market appears to be pricing a risk premium rather than an outright shortage. But if these risks materialise simultaneously, today’s premium could evolve into genuine physical scarcity. In such a scenario, oil prices may not just revisit their earlier peak of $119.50/barrel, they could overshoot it sharply and the oil bulls could become a force to reckon with.More Like ThisPublished on July 18, 2026
Time Is Ticking For Oil Reserves
Rising geopolitical tensions are driving crude oil prices higher, signaling potential shortages and market volatility ahead.
1,776 words~8 min read