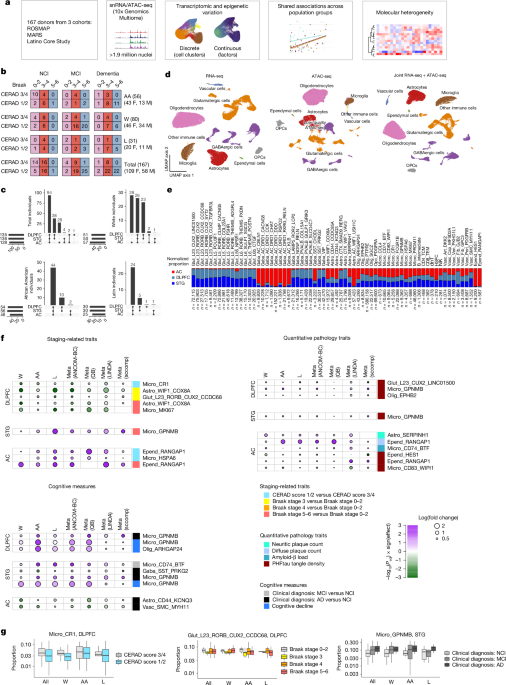
MainAlzheimer’s disease (AD), the most common cause of dementia in older individuals, has a complex aetiology that results in neurodegeneration and memory loss. Studies of post-mortem human tissue have identified amyloid-β aggregates and hyperphosphorylated tau tangles as the major pathologies associated with the disease, leading to a hypothesized cascade of pathology spreading, cellular alterations, circuit dysregulation and cognitive impairment10. Transcriptomics and proteomics studies at the bulk11,12,13,14,15,16,17 and single-cell1,2,3,4,5,6,7,8,9 levels have shed light on how almost all major cell classes in the brain seem to be altered in the disease. However, most of these studies have profiled human tissue from individuals of European descent, and given that the prevalence of AD differs across racial and ethnic groups18, it is unclear which previously reported cell-type-specific disease associations are generalizable to other populations. In addition, only a handful of studies have investigated multiple brain regions across large numbers of individuals and determined the extent to which AD associations differ across brain regions6.In light of these gaps, we generated joint single-nucleus RNA sequencing (snRNA-seq) and assay for transposase-accessible chromatin with sequencing (snATAC-seq) data for three brain regions in 167 individuals who self-identified as African American (excluding Latin), white (excluding Latin) or Latin (of any race, as Latin is categorized as an ethnicity in the study). All of the individuals were participants in longitudinal studies, with prospective brain autopsy, based at the Rush University Alzheimer’s Disease Center: the Religious Orders Study and Memory and Aging Project (ROSMAP)19, the Minority Aging Research Study (MARS)20 and the Latino Core Study21. We used this dataset to address two key questions: (1) which cell-type-specific signatures are consistently associated with disease in all three population groups; and (2) which molecular subtypes of disease exist across this multi-ethnic set of individuals. We focused on associations with self-reported race and ethnicity, with a secondary analysis examining associations shared across groups defined by genetic ancestry. We identified a subset of cell-type-specific signals—mostly in microglia, astrocytes, neurons and oligodendrocytes—associated with AD phenotypes across all three population groups, with differential effects in each brain region. Some, but not all, of these signatures have been implicated in previous studies. Furthermore, our representative population sampling enabled the identification of six preliminary transcriptomically defined groups—three among individuals with mild cognitive impairment and three among individuals with dementia—building on previous evidence of molecular heterogeneity in older individuals with cognitive decline. Overall, this study highlights a set of candidate cell types and gene signatures that are altered in broad and specific groups of patients with AD.Cell-type and cluster overviewTo identify differences in individuals with AD-related pathology and/or cognitive impairment relative to cognitively healthy individuals, we performed joint snRNA-seq and snATAC-seq on nuclei from 399 samples, derived from 56 self-identified African American participants, 31 self-identified Latin participants and 80 self-identified white participants (Fig. 1a,b). Three brain regions—the dorsolateral prefrontal cortex (DLPFC), superior temporal gyrus (STG) and anterior caudate (AC)—were profiled from 94 individuals, with the remaining individuals having one or two regions profiled (Fig. 1c) according to tissue availability. After sample demultiplexing, ambient RNA subtraction and quality control filtering, we iteratively clustered around 1.9 million nuclei using snRNA-seq data (Methods). The first clustering round separated the major cell-type classes, and three subsequent rounds of clustering identified groups of nuclei comprising doublets. The final round of clustering identified subpopulations within each major class (Fig. 1d,e and Extended Data Figs. 1 and 2), with the optimal number of subclusters determined by two clustering robustness metrics (Methods). The final set of nuclei had a median of 2,156 genes and 5,149 unique molecular identifiers (transcripts) detected (Extended Data Fig. 1). We did not find further subdivisions among these transcriptomic subclusters on the basis of snATAC-seq data. This de novo clustering approach allowed us to generate a unified set of clusters across all three of our brain regions.Fig. 1: Shared associations of discrete clusters with clinical and pathological traits across population groups.a,Overview of the experimental and analytical workflow. b, Breakdown of pathological stages, cognitive diagnosis and self-reported racial and ethnic groups of individuals in this study. AA, African American (excluding Latin), L, Latin; W, white (excluding Latin). F, female; M, male. c, Upset plot showing the total number of individuals and number of individuals per population group with combinations of brain regions profiled. d, Uniform manifold approximation and projection (UMAP) visualization of nuclei (after quality control) based on snRNA-seq (left), snATAC-seq (middle) and joint snRNA-seq + snATAC-seq (right) data. OPCs, oligodendrocyte precursor cells. e, Relative abundance of each cell-type subcluster across each of the three regions (double-normalized to sum to 1 for each cluster). Astro, astrocytes; dnT, double-negative T cells; Epend, ependymal cells; Gaba, GABAergic neurons; Glut, glutamatergic neurons; HSPC, haematopoietic stem and progenitor cells; Micro, microglia; NK, natural killer cells; Olig, oligodendrocytes; TCM, T central memory; TEM, T effector memory; Vasc, vascular cells. f, P values and effect sizes for all subclusters with statistically significant (meta-analysis FDR-adjusted P < 0.1, consistent directionality and meta-analysis I2 < 50% in at least two out of four compositional analysis methods) associations with pathological and cognitive phenotypes across all three population groups. For visualization, effect sizes and FDR-adjusted P values for each population group are from the ANCOM-BC method. QB, quasibinomial logistic regression. ‘Cognitive decline’ refers to the steepness of the slope of ante-mortem cognitive decline (positive values indicate worse decline, as described in the Methods). g, Distributions of specific clusters showing associations with AD phenotypes. Left, the CR1+ myeloid cluster is consistently less abundant in the DLPFC in individuals with CERAD scores 1 and 2 than in those with scores 3 and 4. Middle, the RORB+CUX2+CCDC68+ glutamatergic neuronal cluster is less abundant in the DLPFC in individuals at Braak stage 3 than in those at Braak stages 0–2. Right, the GPNMB+ microglia cluster is more abundant in the STG in individuals with a clinical diagnosis of MCI or AD. Box and whisker plots show the median (centre line), the interquartile range (IQR; box limits), and whiskers extending to the most extreme values no further than 1.5 times the IQR from the top or bottom of the box limits.As expected, neuronal clusters showed regional specificity, with glutamatergic neurons found mainly in the two cortical regions. GABAergic neuronal clusters showed minimal overlap between the cortex and the caudate, except for one subclass marked by the expression of somatostatin (SST) and chondrolectin (CHODL) (Fig. 1e). Among glia, four clusters showed strong regional specificity (Fig. 1e): ependymal cells (found mainly in the caudate) and astrocytes (with SMAD9+RERG+ and WIF1+VAV3+ astrocytes in the cortex and WIF1+USH1C+ astrocytes in the caudate). Overall, we identified 61 clusters across all major classes (Extended Data Fig. 2), not including non-microglial immune cells, whose numbers were too low for robust clustering and were thus subject to label transfer (Methods).Our primary goal was to identify cell subgroups that were consistently differentially abundant in relation to AD phenotypes across all three population groups. We examined discrete and continuous measures of AD phenotypes, including CERAD (Consortium to Establish a Registry for Alzheimer’s Disease) neuritic plaque score, neuritic plaque count, diffuse plaque count, amyloid-β load, Braak stage and paired helical filamental tau (PHFtau) tangle density, as well as clinical diagnoses of no cognitive impairment (NCI), mild cognitive impairment (MCI) or Alzheimer’s dementia, and the slope of cognitive decline19 (Methods). Sex, post-mortem interval and age at death were included as covariates, and education as an additional covariate for cognitive measures. We used a stratified approach in which we assessed cluster proportion associations in each group and then performed a meta-analysis across the three groups, keeping only results that had a false discovery rate (FDR)-adjusted P < 0.1, a consistent sign of association in all three groups and I2 < 50% (Methods and Supplementary Table 1); these criteria had to be met by at least two distinct compositional methods out of the four that were implemented (ANCOM-BC, quasibinomial logistic regression, LINDA and sccomp; Methods). It is important to note that this stratified approach can identify shared signatures associated with AD phenotypes despite the three population groups not being matched on demographic variables—most notably, age at death (Extended Data Fig. 1).The strongest consistent signal across population groups was the higher proportion of GPNMB+ microglia in both cortical regions in individuals with a clinical diagnosis of Alzheimer’s dementia and/or a steeper slope of cognitive decline (Fig. 1f and Supplementary Table 1). Higher proportions of this microglial subgroup were also associated with a higher PHFtau tangle density in both cortical regions, and with later Braak stages in the STG. This latter finding is consistent with previous single-nucleus studies of the DLPFC8. GPNMB+ microglia show high expression of genes associated with lipid processing, cell migration and vascular reorganization (Supplementary Table 2). In addition, individuals with a clinical diagnosis of MCI have greater proportions of CD74-high microglia (enriched for mitochondrial-process-associated genes) in the STG (Fig. 1f and Supplementary Table 2). Finally, a CR1+ group of myeloid cells, which also expresses MRC1 and other macrophage markers (Extended Data Fig. 2), is less abundant in the DLPFC in individuals with more severe CERAD scores (Fig. 1f,g). These associations are robust across a range of thresholds for minimum unique molecular identifiers (UMIs) and confidence of demultiplexing parameters (Supplementary Fig. 1 and Supplementary Table 3). Overall, these findings highlight a range of myeloid signatures across different brain regions that are shared across population groups.Astrocyte clusters exhibited region-specific shared signatures associated with AD phenotypes, particularly in the caudate (Fig. 1f). SERPINH1+ astrocyte proportions were higher in the AC in individuals with higher neuritic plaque counts; this cluster is enriched in genes associated with lipid processing (Supplementary Table 2). By contrast, CD44+KCNQ3+ astrocytes were less abundant in the AC in individuals with a clinical diagnosis of AD dementia. Whereas CD44+ cortical astrocytes exhibit fibrous morphology22, CD44+ astrocytes in the caudate are less well studied, and their gene-expression profile shows enrichment for processes associated with immune-response signalling (Supplementary Table 2). The lower abundance of this astrocyte cluster in individuals with AD dementia might point to a protective role in the AC. In the DLPFC, WIF1+COX8A+ astrocytes were less abundant in individuals at Braak stages 3 and 5/6 than they were in individuals at Braak stages 0–2 (Fig. 1f). Thus, we identify multiple region-specific astrocytic signatures associated with AD phenotypes consistently across all three population groups.We also confirmed two previous findings of selective neuronal vulnerability in AD. Cortical SST+ GABAergic neurons and a subset of superficial-layer glutamatergic neurons have both been identified as less prevalent in individuals with dementia and AD pathology5,6,8,9,23; here we confirm that both of these phenomena are shared across population groups (Fig. 1f and Supplementary Table 1), underscoring the robust nature of this selective neuronal loss in AD. Other reported findings, such as the selective loss of LAMP5+RELN+ GABAergic neurons in the cortex, are not shared across population groups to the same extent (Supplementary Table 1), suggesting that some neuronal associations with AD show greater variability across population groups.Continuous variation and factor analysisPrevious work by us and others5,24 has suggested that assigning nuclei to discrete clusters might mean that continuous signatures associated with disease are missed. This is particularly the case for glial cells, in which distinct and dynamic signatures can exist in the same major class without being pre-specified by developmental lineage. Using the single-cell hierarchical Poisson factorization (scHPF) workflow25, we identified factors capturing continuous modes of correlated gene expression in each of our major cell classes. As an illustrative case, we identified ten factors in astrocytes (Fig. 2a). Some factors recapitulated the separation of nuclei into discrete clusters (for example, factor 8 was restricted to the SERPINH1+ cluster), whereas others captured coordinated gene expression spanning multiple clusters (Fig. 2b,c and Supplementary Fig. 2). Notably, some factors revealed signatures associated with AD phenotypes that are not well captured by our assignment of nuclei to discrete clusters. This was particularly the case for oligodendrocytes: oligodendrocyte factor 4 (with high expression of SLC5A3, and enriched in genes associated with immune signalling and lipid processing; Supplementary Table 2) was more prevalent in individuals with higher neuritic plaque counts, higher PHFtau tangle density and a clinical diagnosis of Alzheimer’s dementia, in both the STG and the AC (Fig. 2d and Supplementary Table 4). By contrast, oligodendrocyte factor 3 (high expression of LAMA2, and enriched for genes associated with synaptic-vesicle recycling) and factor 5 (high expression of RABGEF1, and enriched for cytoskeleton-associated genes) were expressed at lower levels in both cortical regions in individuals with a clinical diagnosis of Alzheimer’s dementia (Fig. 2d,e and Supplementary Table 4). In addition, astrocyte factor 6 (with high expression of SLC1A2) was expressed at lower levels in the STG in individuals with a clinical diagnosis of Alzheimer’s dementia (Fig. 2d,e). SLC1A2 encodes the principal transporter that clears glutamate from the perisynaptic space, and its lower expression in AD suggests disruption at the synapse. As with the cluster-based analysis described above, these associations are robust to UMI and nucleus assignment thresholds (Supplementary Fig. 1 and Supplementary Table 4). Finally, we also ran weighted gene co-expression analysis (WGCNA)26 as an alternative approach to assess gene module associations (Supplementary Fig. 3 and Supplementary Table 5); oligodendrocyte module ME2 (containing many factor-3, factor-5 and factor-6 genes) showed lower expression in individuals with worse clinical phenotypes, whereas oligodendrocyte module ME4 (containing many factor-4 genes) showed the opposite trend. Astrocyte modules ME15 and ME18 (containing genes associated with the SERPINH1+ astrocytes and the CD44+KCNQ3+ astrocytes, respectively) both had higher expression in the AC in individuals with worse clinical outcomes. Collectively, these results highlight additional candidate gene-expression programs that might be depleted in individuals with cognitive impairments. This lends further credence to the suggestion that both discrete and continuous models of gene-expression variation should be considered when assessing disease associations—particularly in the case of glial cells, in which discrete taxonomies might not fully capture transcriptional variation.Fig. 2: Continuous variation in cell-type signatures and shared associations with clinical and pathological traits across population groups.a, Visualization of scHPF-derived factor scores versus cluster identities in astrocytes. CPM, counts per million mapped reads. b, Heat map showing the median factor score in each cluster. Whereas some factor scores (for example, factor 8) are high in nuclei belonging to a specific cluster, others (for example, factors 1, 4 and 6) are represented in multiple clusters. c, Expression of genes with the top five weights in each factor, plotted by discrete cluster. Consistent with the representations in a,b, some factors are cluster-specific, whereas others span multiple clusters. d, Effect sizes and P values (from ANCOM-BC) of factor associations with consistent and significant (meta-analysis FDR-adjusted P < 0.05, consistent directionality of effect and meta-analysis I2 < 50%) signals in all population groups, in the same format as Fig. 1f. Unlike with the discrete clustering results in Fig. 1, oligodendrocytes are highly represented in the factor-based analysis, especially factor 4 (higher in individuals with disease) and factors 3, 5 and 6 (lower in individuals with disease). e, Examples of factors with associations with AD traits, in the same format as Fig. 1g. Box and whisker plots show the median (centre line), the IQR (box limits), and whiskers extending to the most extreme values no further than 1.5 times the IQR from the top or bottom of the box limits.Regional specificity of associationsCertain cell-type associations are consistent across population groups in all three brain regions, whereas others seem to be region-specific. These region-specific findings could be genuine, or could be due to significance thresholds and differences in statistical power. By examining both the significance and the effect size for cell-type and factor associations across pairs of regions (Supplementary Fig. 4), we find that the associations of GPNMB+ microglia and oligodendrocyte factors with AD phenotypes have consistent effect sizes in all three brain regions, even if they do not reach statistical significance. By contrast, the associations of CD74-high microglia and SST+ GABAergic neurons with dementia have larger effect sizes in the STG, and the relative depletion of astrocyte factor 6 (SLC1A2-high) in dementia is restricted to the cortex (Supplementary Fig. 4). Although larger sample sizes will allow better distinction between cross-region effects and statistical power issues, this study already highlights multi-region and region-specific signatures shared across population groups.Associations based on genetic ancestryA key question is whether the molecular signatures that show shared association across self-identified population groups are also shared when considering groups defined by genetic ancestry. To address this question, we used existing whole-genome sequencing (WGS) data from the AD Knowledge Portal for 151 of the 167 individuals (see ‘Data availability’). We computed both genetic principal components (PCs) and admixture components (Extended Data Fig. 3a,b). We observed that PCs 1 and 2 explain a large portion of the variation (around 23%), and roughly align with self-reported race and ethnicity (Extended Data Fig. 3a). Similarly, an admixture analysis with three admixture components captured the primary ancestry structure, beyond which additional components reflected increasingly fine-scale subdivision (Extended Data Fig. 3b). Self-reported white individuals had mostly component 1; self-reported African American individuals had mostly component 3, with some individuals also showing varying levels of component 1; and self-reported Latin individuals had components 1 and 2 (Extended Data Fig. 3c).We reran the associations of cell clusters and factors with both the WGS PCs and the admixture components, using an interaction model for the PCs (which have continuous values) and the same categorical approach for admixtures (based on the most dominant component) that was used for self-reported race and ethnicity in Figs. 1 and 2. We observed that most associations that were shared across self-reported race and ethnicity groups were also shared when donors were grouped by dominant admixture component or represented by their continuous genetic ancestry PCs (Extended Data Fig. 3d–g and Supplementary Tables 6–9). However, grouping individuals by genetic ancestry did highlight additional signatures that did not cross the FDR correction threshold in our self-reported race–ancestry analysis. Specifically, some vascular cell clusters and glutamatergic neuron factors show associations with cognitive phenotypes (Extended Data Fig. 3d–g). Overall, a comparison of the FDR-adjusted P values and effect sizes for associations using self-reported race and ethnicity, and genetic ancestry (Extended Data Fig. 3h,i), shows that these differences are likely to be due to statistical power rather than to environmental or genetic effects. However, we cannot definitely rule out the effects of environmental or unmeasured variables for some associations that differ between self-reported and genetic ancestry analyses.Potential driver genes from snATAC-seqWe next examined matched snATAC-seq data from the same nuclei to uncover putative drivers of cell signatures. Overall, our snATAC-seq data alone were not sufficient to identify robust subclusters in major cell types, and the data did not yield robust, statistically significant cell-type-specific snATAC-seq peaks that were directly associated with clinical phenotypes across all three population groups. This is consistent with previous studies, and the sparseness of the data could be a result of relatively shallow sequencing depth (around 30,000 reads per nucleus). By contrast, we identified tens to hundreds of peaks that differed significantly across our transcriptomically defined subclusters (Fig. 3a–c and Extended Data Fig. 4), consistent with previous studies2, and some chromatin regions near AD loci that are cell-type specific (Fig. 3d and Supplementary Table 10). Sequence motif enrichment analysis of these differential peaks yielded putative transcription-factor-binding sites enriched in each cluster. Cross-referencing these with transcription-factor expression in the relevant cell types then yielded a smaller set of transcription factors that might drive some aspect of cluster identity (Supplementary Table 11). Putative drivers included HSF1 and HSF2 in the SERPINH1+ astrocyte cluster, EGR1 in the GPNMB+ microglia cluster and PATZ1 and ELF5 in the WIF1+COX8A+ astrocyte cluster. Similarly, putative drivers for factors included WT1 in astrocyte factor 8, RORA and ZNF449 in microglia factor 14 and several others in the oligodendrocyte factors. Notably, some putative transcription-factor drivers were shared across cell-type clusters and factors. For instance, SREBF1 in the RORB+CUX2+CCDC68+ L23 glutamatergic cluster, WIF1+USH1C+ AC astrocyte cluster and oligodendrocyte factor 4 (Supplementary Table 11), underscoring potential co-regulation across several cell states.Fig. 3: Differential chromatin occupancy across RNA-derived cell types and AD risk loci.a, Occupancy values (normalized counts per pseudobulked cluster) of the top two differential sites (columns) for each astrocyte cluster (rows). Numbers on the right of the heat map indicate the total number of differential sites (FDR-adjusted P < 0.05 using DESeq2 Wald test) per astrocyte cluster, in a one-versus-all comparison. Peak regions on the x axis are labelled as chromosome-start site–end site. b, Same as a, but for microglial clusters. c, Peak coverage tracks for one specific site shown to be differentially accessible across astrocyte clusters in a. TSS, transcription start site. d, Normalized chromatin occupancy values at each of around 70 AD-associated GWAS loci. Colours represent the total snATAC-seq counts over all nuclei for a given cell type, donor population group and brain region, which are then normalized to the maximum value for each locus across all combinations of donor, cell type and region. Several loci show visible differences in occupancy across cell types, whereas only GABAergic neurons exhibit notable region-specific differences, as expected given their distinct regional expression signatures. Only one locus (containing the KANSL1 gene) shows consistent differences across the three population groups.Consistency of open chromatin regionsIn addition to identifying putative drivers of cell signatures associated with AD, we examined chromatin accessibility in each population at genetic loci that have been implicated in AD through genome-wide association studies (GWASs)27,28,29,30,31,32,33,34,35,36,37 (Fig. 3d and Supplementary Table 10). As expected, microglia showed the highest accessibility at previously described immune-gene loci (including loci containing TREM2, CD33 and HLA-DRB5). Oligodendrocytes showed the highest accessibility at many loci, including those containing early-onset AD genes, such as APP and PSEN1, whereas neurons had the highest accessibility in loci containing PLXNA4 and NCR2.Despite the greater genetic diversity afforded by examining individuals from multiple backgrounds, we found only one AD-associated locus with potential differential occupancy across our population groups. This locus is on chromosome 17 (46,029,916–46,223,808 in GRCh38), proximal to the locus containing MAPT, and contains the KANSL1 gene. It was identified in GWASs that studied mainly white individuals27 and African American individuals38. In our data, this locus is less accessible overall in African American individuals than it is in white individuals (Fig. 3d and Supplementary Table 12). This difference in accessibility is consistent across all major cell classes. However, it does not correspond to gene-expression differences in KANSL1 itself, suggesting that the effect of regulatory elements in this locus acts elsewhere in a population-specific manner.Validation in intact tissue sectionsTo assess the robustness of signatures from our snRNA-seq analyses, we investigated the relative abundance of cell clusters in intact DLPFC tissue using the Xenium multiplexed in situ hybridization (ISH) platform. We designed a panel of 259 genes (Supplementary Table 13) covering major cell-type markers, cluster-specific genes and genes in known AD risk loci (Supplementary Table 10), and profiled tissue from 33 donors in our dataset (Fig. 4a). After mapping cluster identities to the cells in tissue sections (using the default cell segmentation pipeline from the Xenium Ranger software package, followed by the robust cell-type decomposition (RCTD) workflow39; Methods), we verified that most cluster marker genes were specific to their corresponding assigned cell groups (Fig. 4b), although a subset of oligodendrocyte and astrocyte subcluster markers had weak detection. In addition, the assignment of glutamatergic cells recapitulated their predicted spatial layer structure (Fig. 4c), and there was concordance among most cluster proportions between snRNA-seq and Xenium (Supplementary Fig. 5), providing further evidence that the ISH data are of reasonable quality for cluster assignment in tissue. We restricted our validation to the snRNA-seq-derived cluster associations described in our original cluster-based analysis (Fig. 1), using the same proportion analysis approach. We confirmed associations between the proportions of GPNMB+ microglia and ARHGAP24+ oligodendrocytes and the slope of cognitive decline (see Methods for interpretation of this measure), and between the proportion of EPHB2+ oligodendrocytes and PHFtau tangle density (Fig. 4d, Supplementary Fig. 5 and Supplementary Table 14). In intact tissue, we also confirmed the lower proportion of WIF1+COX8A+ astrocytes and RORB+CUX2+CCDC68+ glutamatergic neurons in Braak stage 3 than in Braak stages 0–2 (Fig. 4e and Supplementary Table 14). Other cell cluster–phenotype associations from our snRNA-seq analysis (Fig. 1) showed trends in the Xenium data but did not reach statistical significance (Fig. 4e and Supplementary Table 14), probably because the number of donors in this validation experiment was lower than that in the snRNA-seq data.Fig. 4: Validation of snRNA-seq findings through multiplexed ISH validation and comparison with other studies.a, Workflow for data generation and analysis using the Xenium platform. b, Dot plot showing the expression of snRNA-seq cluster markers in cells from 36 DLPFC sections (one per individual) profiled using the Xenium platform, after label transfer and cluster assignment using the RCTD pipeline. c, Tissue plot showing that the assignment of cells to glutamatergic clusters recapitulates the expected layer positions of clusters. Scale bar, 2 mm. d, Scatter plots showing the relative proportion of three cell clusters in intact tissue (Xenium) versus continuous measures of cognition (left and middle, with worse slope of cognitive decline on the right in each plot; see Methods for interpretation of this measure) and tau pathology (right); these associations were all found to be significant in the cell composition analysis from snRNA-seq data (Fig. 1f), and are recapitulated in intact tissue. e, Summary of snRNA-seq proportion associations from this study compared with Xenium data and two other studies6,8 of predominantly white individuals from ROSMAP. All association tests were run using ANCOM-BC. Colours indicate positive (red) or negative (blue) associations with clinical and pathological variables; solid circles represent FDR-adjusted P < 0.05; open circles indicate associations with Padj > 0.05. Black boxes highlight strongly replicated findings (same directionality and statistical significance); grey boxes highlight findings with similar directionality and partial statistical significance. f, Similar to e, but using cluster labels from the two external studies in e transferred onto our study. Results are shown from mapping cluster labels from ref. 8 (left columns) or ref. 6 (right columns) onto this study. For the two external studies, only clusters reported as being statistically significantly associated with AD phenotypes are included.Agreement with previous studiesTo further evaluate the robustness of our findings, we mapped our clusters to two large-scale snRNA-seq studies on the DLPFC, both of which included mainly white individuals from ROSMAP6,8. As with the Xenium data, we attempted to validate only significant associations from our cluster-specific analysis (Fig. 1). We found that GPNMB+ microglia showed the same robust and statistically significant association in the DLPFC in these two published studies, in individuals with a clinical diagnosis of MCI or Alzheimer’s dementia, and with a worse slope of cognitive decline (Fig. 4e and Supplementary Table 15). The proportion of ARHGAP24+ oligodendrocytes was consistently higher in individuals with a worse slope of cognitive decline in both studies, although this trend did not reach statistical significance (P < 0.05). Similarly, the proportion of RORB+CUX2+CCDC68+ neurons was consistently lower in individuals at Braak stages 3 and 4, compared with those at Braak stages 0–2, although this difference was again not statistically significant (Fig. 4e). The reverse mapping of cluster labels from one of the snRNA-seq studies8 also showed that putative lipid-processing microglial subgroups Mic.12 and Mic.13—both of which express GPNMB—were more abundant in individuals at Braak stage 5 or 6, in individuals with a clinical diagnosis of AD dementia and in individuals with a higher PHFtau tangle density, in all three of our population groups (Fig. 4f). The same association was found for Oli.7 (the analogue of ARHGAP24+ oligodendrocytes) and Ast.10 (the analogue of WIF1+VAV3+ astrocytes (Fig. 4f). Similarly, mapping of vulnerable GABAergic neuron clusters from the other snRNA-seq study6 to our dataset revealed that SST+MAFB+ neurons showed a trend towards lower proportions in individuals with a higher amyloid-β load and PHFtau tangle density in all three of our population groups, and CUX2+MSR1+ neurons showed the same trend in individuals with a higher PHFtau tangle density and steeper slope of cognitive decline (Fig. 4f). Thus, despite the smaller sample size per population group in our study, we find that our key microglial, neuronal and oligodendrocyte findings are consistent with findings from larger—although less diverse—studies.Molecular subgroups in individuals with ADWhereas the results described above focus on shared signatures across the entire sampled population, these global association analyses would miss signatures that are present only in subsets of individuals with disease phenotypes. These potential molecular ‘endophenotypes’ might be important when stratifying individuals for clinical or therapeutic studies that aim to modulate dysregulated molecular pathways. Thus, characterizing molecular heterogeneity in individuals with cognitive impairment is a key area, made possible by the profiling of tissue from larger numbers of individuals. Here, we used our multi-ethnic population of donors to analyse the heterogeneity of molecular brain-tissue profiles, similar to previous studies8,14,40. We focused on the STG because it was the most profiled region among individuals with MCI and AD in our study, and because it shows signs of AD pathology earlier than the DLPFC does. Using a hierarchical clustering approach based on cluster and factor composition in STG tissue from individuals with MCI or AD, we identified six donor subgroups that were robust to method and parameter selection (Fig. 5a, Extended Data Fig. 5 and Methods). Three of these subgroups were enriched for individuals with clinical diagnoses of MCI, and more than 70% of the individuals in each of the other three subgroups had a clinical diagnosis of AD dementia (Fig. 5b). CERAD scores and Braak stages did not differ across the three MCI-predominant subgroups or across the three AD-dementia-predominant subgroups (Fig. 5b), suggesting that standard pathological measures of disease progression do not distinguish the subgroups within each of these two sets. The small number of APOE e4/e4 donors (that is, individuals carrying two copies of the e4 variant of the APOE gene) profiled were all in group 5, but the distributions of overall polygenic risk scores were similar across the groups (Fig. 5b). Among the three AD dementia groups, group 6 (n = 10) has an absolute majority of African American individuals (n = 7), with a trend towards significance (hypergeometric test with FDR-adjusted P = 0.081).Fig. 5: Molecularly defined donor subgroups.a, Heat map showing six clusters of individuals (rows) based on the relative proportions of cellular clusters and median factor values (columns). b, Bar plots showing the relative composition of each group on the basis of terminal cognitive diagnosis, pathological staging, population group, age at death, APOE genotype and polygenic risk score. Although none of the three dementia-related clusters shows significantly different composition across these categories, some trends in the representation of APOE e4/e4 donors in group 5 and African American donors in group 6 are evident. c, Clusters and factors with higher relative mean representation in group 4 (left), group 5 (middle), and group 6 (right), with corresponding grouped gene ontology (GO) enrichment terms for cluster- or factor-defining genes below. Box and whisker plots show the median (centre line), the IQR (box limits), and whiskers extending to the most extreme values no further than 1.5 times the IQR from the top or bottom of the box limits.Although the three dementia-predominant subgroups did not show substantial differences in disease progression based on CERAD score or Braak stage (Fig. 5b), we identified restricted molecular signature: group 4 was characterized by a higher representation of microglia factor 10 (enriched for phagocytosis genes; Fig. 5c); individuals in group 5 had higher proportions of putative fibrous-like CD44+ astrocytes (Fig. 5c); and group 6 was distinguished by higher expression of astrocyte factor 1 (enriched for SLC14A1 and genes involved in tangle assembly and phospholipid transport; Fig. 5c). This grouping suggests that there is a complex landscape of molecular heterogeneity in individuals with dementia, with potentially distinct combinations of cellular signatures. Parallel groupings are not found in donors without cognitive impairment (Extended Data Fig. 5), either with the same clustering of features (from individuals with MCI and AD) or with de novo identification of correlated features (only from NCI individuals). This suggests that these molecular signatures represent endophenotypes associated with cognitive impairment and dementia, rather than population-level natural variation independent of disease status. Finally, despite the stability and robustness of these donor groupings in the current dataset, larger sample sizes are required to establish further generalizability. This work thus complements previous studies8,14,40, providing further insight into the molecular heterogeneity in tissues from individuals with Alzheimer’s pathology and dementia.DiscussionIn studies of ageing and neurodegeneration, including participants from a variety of racial and ethnic backgrounds is important to answer two questions: (1) which disease-associated molecular signatures are shared across different population groups and (2) how do molecular subtypes of disease self-organize when a broad range of individuals are included. Here, by generating single-nucleus snRNA-seq and snATAC-seq data from individuals of various backgrounds, we show that specific signatures in several cell classes—GPNMB+ microglia, SERPINH1+ astrocytes, SST+ GABAergic neurons, a subset of CUX2+RORB+ glutamatergic neurons and a range of continuous astrocytic and oligodendrocytic signatures—exhibit similar associations with AD pathology and cognitive phenotypes in African American, white and Latin individuals. A key aspect of this study is the combination of discrete and continuous categorization of cellular heterogeneity within each major cell class. As reported by us and others before, continuous representation of certain glial classes (such as oligodendrocytes) might yield clearer associations with disease phenotypes than discrete cluster-based representation.With regard to the second question, previous studies have investigated heterogeneity in AD pathology, biofluids and bulk molecular signatures, and our results also point to distinct molecular endophenotypes in subsets of individuals with disease. Whereas these molecular signatures are not found in all individuals with disease, the people who had these signatures were cognitively impaired, which suggests that convergent clinical phenotypes result from the dysregulation of distinct molecular pathways. This is an important consideration for preclinical studies, biomarker identification and patient stratification for therapeutics. We note that this area of the field of AD transcriptomics is still developing, and we view our results as preliminary given the sample size.The findings summarized above should be considered in the context of three main caveats to this observational study. One of these is the relatively shallow depth of snATAC-seq (median of 30,000 reads per nucleus); indeed, our snATAC-seq data did not reveal any groupings of nuclei beyond those observed in the snRNA-seq data, and we did not identify any shared associations of individual chromatin regions with disease within a cell type across all three population groups after multiple testing correction.The second caveat in this study is the sample size. Although the total number of tissue samples processed (399) is comparable with previous large-scale single-nucleus studies of AD6,8,9, the number of donors per population group is less than 100. In addition, the in-tissue validation experiments using Xenium profiled fewer than 40 donors, resulting in insufficient statistical power to validate some of the snRNA-seq-derived findings. As a result, this study is well-powered to interrogate shared signatures across population groups, but less so to identify group-specific signatures, especially given confounders such as age at death (Extended Data Fig. 1). Thus, findings such as putatively differential chromatin accessibility at the AD-associated locus containing KANSL1 (Fig. 3d), and the lack of cross-population group reproducibility of vulnerable neuronal signatures identified in previous studies, do not necessarily indicate race- or ethnicity-specific differences, but could rather be a result of the lack of power. The third caveat is that the findings in this study are observational rather than mechanistic. As with all studies on post-mortem tissue, the inferences about cell-type-specific associations are drawn from cross-sectional data, and do not incorporate mechanistic or perturbation analyses. As a result, the main findings point to signatures that should be prioritized for further study in systems allowing for longitudinal examination and perturbations.It is worth reiterating that we examined self-reported race and ethnicity as well as genetic ancestry in two parallel association analyses. Given that most of these donors lived in the USA from the 1940s onward, it is likely that their perceived race and ethnicity affected their life experiences. Thus, our analysis using self-reported race accounts for both genetic and life-experience effects on brain-tissue signatures. By contrast, our genetic ancestry analysis does not, in theory, include effects of life experience on brain-tissue signatures. However, because our main goal was to identify shared signatures across groups, it is not surprising that the results were mostly consistent across both analyses. Ultimately, further investigation of the shared cell-type signatures highlighted here could lead to the identification of preclinical targets that are relevant across a wide range of racial and ethnic backgrounds. In parallel, our dataset serves as a resource for future studies investigating how genetic variants affect transcriptomic and epigenetic signatures in older individuals. Thus, our work sets the stage for large studies that use a similar representative sampling approach to consider the effects of both genetic heterogeneity and diverse life experience in AD.MethodsStudy participants, ethics and clinicopathological characterizationAll brain tissue was obtained from participants in the Religious Order Study and Memory and Aging Project (ROSMAP)19, the Minority Aging Research Study (MARS)20 and the Latino Core Study21. As described previously, all participants are without known dementia at enrolment and have annual clinical evaluations; participants whose brain tissue was profiled in this study also consented to brain donation. At death, the brains undergo a quantitative neuropathological assessment, and the participant’s rate of cognitive decline is calculated from the longitudinal cognitive measures, which include up to 31 yearly evaluations19. An institutional review board at Rush University Medical Center approved each study, and an institutional review board at Columbia University Irving Medical Center approved the use of the post-mortem tissue samples for molecular analysis. All participants included in the analyses presented here signed an informed consent, Anatomical Gift Act and repository consent. For this study, we selected 167 participants, including all donors from the MARS and Latino Core Study who had full pathological characterization by December 2022, and availability of fresh-frozen tissue from at least two of the three brain regions profiled (DLPFC, STG and AC). As a result, our study cohort includes diverse individuals across the full range of the pathological stages and diagnosis of AD and MCI41,42,43. A subset of demographic and clinicopathological characteristics are summarized in Fig. 1 and Extended Data Fig. 1. Pathological measures were collected as previously described44,45. We focused our analysis on the following measures:
Cell-type signatures of Alzheimer’s disease shared across population groups - Nature
Single-nucleus RNA-seq and ATAC-seq analyses on post-mortem brain samples from African American, Latin and white individuals identify cell-type-specific molecular signatures that are associated with cognitive impairment and/or Alzheimer’s disease across diverse population groups.
16,078 words~73 min read