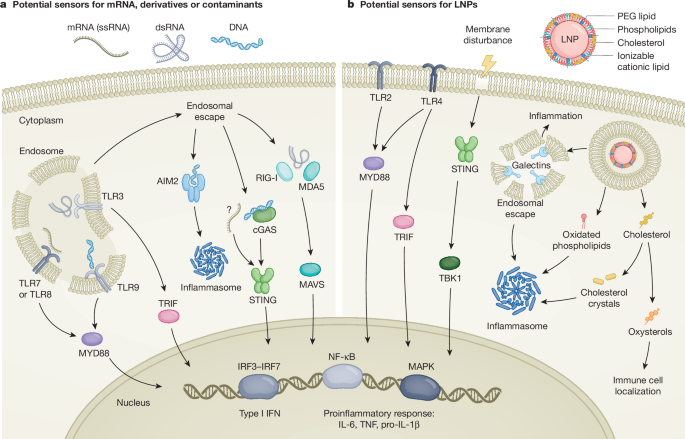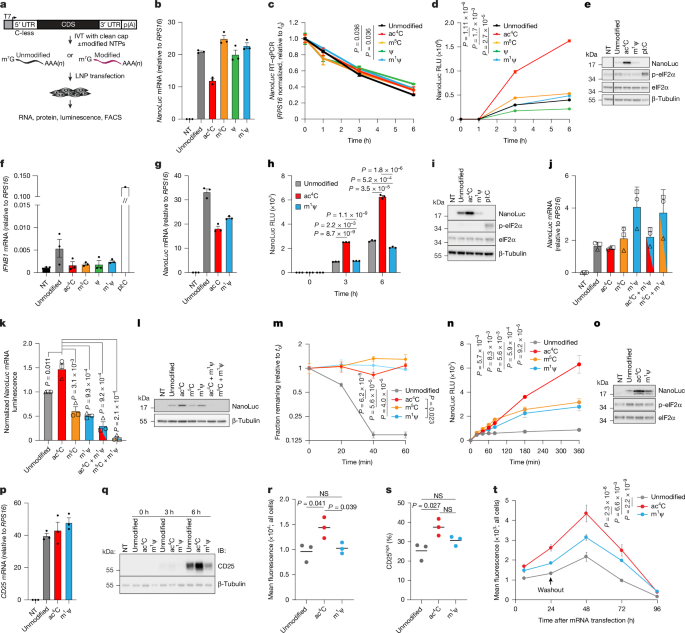
MainIn vitro transcribed (IVT) mRNAs have matured into a versatile therapeutic platform, as exemplified by mRNA-based COVID-19 vaccines that program cells to express immunogenic viral proteins1,6. To enhance stability and translation, synthetic mRNAs are 5′ capped with N7-methylguanosine and 3′ polyadenylated7. Unlike endogenous transcripts, which are exported directly to the cytosol, IVT mRNAs enter cells through endosomal pathways that engage innate immune sensors. This process induces type I interferon responses and eIF2α phosphorylation (p-eIF2α), which promotes RNA degradation and global translational repression6. Uniform incorporation of modified nucleoside triphosphates (NTPs) during in vitro transcription mitigates immune detection and enhances mRNA stability and protein output1,6,8. However, recent findings have indicated that the current industry standard m1Ψ compromises translational fidelity and thereby generates unintended neoantigens3,9. These observations highlight the need for alternative or complementary strategies to optimize the safety and efficacy of mRNA therapeutics.Of the approximately 170 known RNA modifications, only a small subset has been evaluated for mRNA therapeutic applications7,10. We previously demonstrated that ac4C, a naturally occurring modification, potently enhances IVT mRNA translation in HeLa cells11. Mechanistically, ac4C stabilizes Watson–Crick base pairing with guanosine, which strengthens interactions with cognate tRNAs and promotes RNA secondary structure formation12. The net effect is a position-dependent modulation of translation. In coding sequences (CDSs), ac4C promotes translation elongation by improving tRNA–mRNA decoding efficiency11. Conversely, in 5′ untranslated regions (UTRs), ac4C inhibits translation initiation by forming structures that hinder ribosome scanning11,13. Notably, as a cytidine modification, ac4C is inherently excluded from start and stop codons, sites where nucleotide modifications may disrupt initiation and termination13,14.Given these properties, we examined the effects of incorporating ac4C into IVT mRNAs alongside the industry standard m1Ψ. Furthermore, we evaluated pseudouridine (Ψ) and 5-methylcytidine (m5C), which have also been explored in mRNA therapeutics2,8.ac4C enhances IVT mRNA translationA DNA template encoding optimized UTRs flanking the CDS of bioluminescent NanoLuciferase (NanoLuc) was IVT with ac4C or m5C substituted for cytidine or with Ψ or m1Ψ substituted for uridine (Fig. 1a and Supplementary Table 1). All mRNAs were co-transcriptionally capped and polyadenylated. To avoid inhibitory effects of ac4C on translation initiation, IVT templates were designed with C-less 5′ UTRs that preserved the Kozak sequence, which restricts ac4C to the CDS13. In vitro transcription with canonical NTPs served as an unmodified control. RNA integrity, yield and capping efficiency were validated (Extended Data Fig. 1a–c).Fig. 1: ac4C enhances IVT mRNA translation.a, Schematic of IVT mRNA production and transfection. b–f, NanoLuc translation following transfection into HeLa cells. b, NanoLuc mRNA levels at t = 0 (5 min), normalized to RPS16. NT, non-transfected. c, NanoLuc mRNA decay at indicated times after transfection. d, NanoLuc luminescence at indicated times. RLU, relative light units. e, Representative immunoblot of indicated proteins at 6 h after transfection, with β-tubulin as the loading control. f, IFNB1 mRNA levels at 6 h after transfection, with polyI:C (pI:C) as a positive control. n = 3; two-tailed unpaired Student’s t-test on the area under the curve (AUC) compared with unmodified mRNA (c,d). g–i, NanoLuc translation in HeLa cells following transfection with G47A+884G mutant T7-derived IVT mRNA. g, mRNA levels after 5 min of transfection and washout. h, Luminescence at the indicated times. i, Western blot at 6 h after transfection. n = 3; two-tailed unpaired Student’s t-test (h). j–l, NanoLuc translation in HeLa cells following electroporation of IVT mRNA. j, mRNA levels immediately after electroporation. k, Luminescence at 6 h. l, Immunoblot at 6 h after transfection. n = 3; two-tailed unpaired Student’s t-test compared with ac4C-modified mRNA (k). m–o, NanoLuc translation in RRLs. m, mRNA levels normalized to time zero. n, Luminescence at the indicated times. o, Representative immunoblot of proteins at 80 min. n = 3; two-tailed unpaired Student’s t-test on the AUC compared with unmodified mRNA (n). p–t, CD25 translation in HeLa cells following transfection of IVT mRNA. p, mRNA levels after 5 min of transfection and washout. q, Immunoblot (IB) at indicated times after transfection. r,s, Surface expression of all cells (r) and CD25high fraction (s) by flow cytometry at 6 h. t, Surface expression over time after extended transfection. n = 3; two-tailed unpaired Student’s t-test. NS, not significant. Data are the mean ± s.e.m.; only significant values are shown unless otherwise indicated; n indicates independent biological replicates.Synthetic mRNAs were encapsulated into lipid nanoparticles (LNPs) and transfected into HeLa cells, with complexes removed after 5 min to synchronize uptake. Quantitative PCR with reverse transcription (RT–qPCR) confirmed efficient delivery across conditions (Fig. 1b). Chemically modified mRNAs exhibited prolonged half-lives relative to unmodified mRNA, although overall decay kinetics were similar (Fig. 1c). Despite comparable or reduced RNA levels, ac4C-modified NanoLuc led to increased protein synthesis relative to all other conditions, including m1Ψ, as measured by luminescence and immunoblotting experiments (Fig. 1d,e and Extended Data Fig. 1d–g).The enhanced translation of modified mRNAs is often attributed to reduced innate immune activation6. However, immune signalling was minimal in HeLa cells, with all IVT mRNAs inducing little to no IFNB1 or p-eIF2α expression (Fig. 1e,f). Furthermore, the translational advantage of ac4C persisted when mRNAs were synthesized using a G47A+884G mutant T7 polymerase, which suppresses immunostimulatory double-stranded RNA (dsRNA) by-products15. NanoLuc protein levels remained highest for ac4C-modified mRNA, even as p-eIF2α was further reduced relative to wild-type (WT) T7 (Fig. 1g–i and Extended Data Fig. 1h,i).Endosomal escape is inefficient, and total cellular RNA may not reflect the translation-competent pool16. Accordingly, we quantified translation after electroporation, which delivers IVT mRNAs directly to the cytoplasm and minimizes the confounding effects of immune responses17. m5C served as a control cytidine modification, whereas ac4C–m1Ψ and m5C–m1Ψ double-modified mRNAs were used to assess combinatorial effects (Extended Data Fig. 1j). Across replicates, m1Ψ-modified mRNA showed higher electroporation efficiency (Fig. 1j). However, ac4C modestly increased NanoLuc protein output and further exceeded that mediated by m1Ψ after normalization to mRNA levels (Fig. 1k). This effect was specific to ac4C, as m5C reduced NanoLuc levels and double-modified mRNAs showed minimal translation (Fig. 1l).To further isolate the direct effects of nucleotide modifications on translation, we used rabbit reticulocyte lysate (RRL), a cell-free system that retains the core translational machinery but lacks key innate immune pathways, and translation efficacy is independent of delivery18. RRLs were programmed with equivalent amounts of each transcript, and RNA and protein levels were monitored over time. Unmodified NanoLuc mRNA degraded rapidly, whereas modified transcripts remained stable over the sampling window (Fig. 1m). Correspondingly, luminescence from unmodified mRNA plateaued within 30 min, whereas luminescence from m5C-modified and m1Ψ-modified mRNAs accumulated for longer periods before plateauing. By contrast, ac4C-modified mRNA supported sustained and increased protein synthesis throughout the time course, without a clear plateau (Fig. 1n). Immunoblotting confirmed the increase in NanoLuc protein from ac4C-modified mRNA over time without detectable p-eIF2α (Fig. 1o and Extended Data Fig. 1k). Thus, ac4C enhances protein synthesis through an intrinsic effect on translation, independent of immune signalling or the delivery method.To test whether the translational advantage of ac4C persists under optimized decoding conditions, the NanoLuc open-reading frame was codon-optimized to maximize theoretical mRNA stability in human cells19. This redesign increased wobble uridine by around 30%, which enriched the nucleotide position most responsive to m1Ψ-mediated enhancement of translation9 while balancing the overall cytidine and uridine content to enable direct comparison of ac4C and m1Ψ (Extended Data Fig. 2a and Supplementary Table 1). Under these conditions, ac4C-modified mRNA continued to suppress immune activation and to produce higher protein levels than m1Ψ and unmodified controls, without altering mRNA stability (Extended Data Fig. 2b–f).Finally, to assess whether the translational advantage of ac4C extends to membrane proteins, we analysed CD25. This protein is a therapeutically relevant transmembrane receptor, and its deficiency is associated with severe immune dysregulation20 CD25 IVT mRNAs were synthesized, validated and transfected into CD25-negative HeLa cells (Extended Data Fig. 2g and Supplementary Table 1). RT–qPCR confirmed that transfection efficiencies and mRNA stability were comparable across conditions after 5 min of transfection and LNP washout. By contrast, ac4C-modified mRNA produced higher CD25 protein levels (as measured by immunoblotting) than m1Ψ-modified and unmodified transcripts (Fig. 1p,q and Extended Data Fig. 2h,i).As a cell surface protein, CD25 can be quantified by flow cytometry. At 6 h after transfection, the mean fluorescence intensity and the fraction of CD25high cells were increased for ac4C-modified relative to m1Ψ-modified and unmodified mRNAs (Fig. 1r,s and Extended Data Fig. 2j). To better approximate in vivo exposure, LNP incubation was extended to 24 h and CD25 expression was monitored over 96 h. mRNA uptake remained comparable across modifications, with transcripts becoming undetectable by 72 h (Extended Data Fig. 2k). The fraction of CD25-positive cells remained similar for ac4C-modified and m1Ψ-modified mRNAs, whereas unmodified mRNA showed reduced expression (Extended Data Fig. 2l). By contrast, the mean fluorescence intensity, which reflects protein levels per cell, was consistently higher for ac4C-modified mRNA throughout the time course of the experiment (Fig. 1t and Extended Data Fig. 2m). Thus, ac4C supports higher protein output per cell even when delivery levels are comparable.ac4C reduces immune responses to IVT mRNAThe above results established that ac4C improves translation in low-immune settings. Next, we evaluated its performance in therapeutically relevant contexts, including immune cells, primary fibroblasts and liver in vivo. Monocyte-derived macrophages and dendritic cells were prioritized given their high expression of pattern recognition receptors and their central role in mRNA vaccine responses6.THP-1-derived M0 macrophages were transfected with LNP-encapsulated NanoLuc mRNA. Comparable transfection efficiencies and mRNA stabilities were observed across conditions (Extended Data Fig. 3a–c). Unmodified mRNA induced strong immune activation, as evidenced by increased IFNB1, TNF and p-eIF2α levels, whereas ac4C and m1Ψ suppressed these responses to similar levels (Fig. 2a,b and Extended Data Fig. 3d). Nonetheless, ac4C-modified mRNA led to increased NanoLuc protein yields (Fig. 2b,c and Extended Data Fig. 3d). A similar pattern emerged in primary monocyte-derived dendritic cells (MoDCs). Both modifications reduced immune activation relative to unmodified mRNA, with ac4C leading to modestly lower IFNB1, TNF and p-eIF2α levels. However, ac4C again increased NanoLuc protein yields across samples from human donors (Fig. 2d–g and Extended Data Fig. 3e–h).Fig. 2: ac4C enhances translation independently of innate immune activation.a–c, NanoLuc translation in THP-1-derived M0 macrophages. a, IFNB1 mRNA levels at indicated times. b, Immunoblot at 6 h after transfection. c, Luminescence at indicated times. n = 3; two-tailed unpaired Student’s t-test (a,c). d–g, NanoLuc translation in primary human MoDCs from independent donors (A–D). d, IFNB1 mRNA levels at 6 h. e, Immunoblot at 6 h after transfection. f, Densitometry of p-eIF2α/total eIF2α from e. g, Luminescence at indicated times, normalized to each donor’s unmodified mRNA signal at 3 h. n = 3; two-tailed unpaired Student’s t-test (d,f), or two-tailed paired Student’s t-test (g). h–j, NanoLuc translation in MoDCs from donors (F–H) following transfection with G47A+884G mutant T7-derived IVT mRNA. h, IFNB1 mRNA levels at 6 h. i, Immunoblot at 6 h after transfection. j, Luminescence at the indicated times, normalized to each donor’s unmodified mRNA signal at 3 h. n = 3; two-tailed paired Student’s t-test (h,j). k,l, In vitro digestion of FLuc IVT mRNA with increasing amounts of RNase T2. k, Denaturing agarose gel electrophoresis. l, Densitometric quantification of full-length mRNA relative to total lane volume. n = 3; one-way analysis of variance with two-tailed unpaired Student’s t-tests using the AUC (l). m, Ex vivo luminescence flux in mouse livers 24 h after intravenous injection of 10 μg NanoLuc IVT mRNA–LNPs per mouse. n = 9 mice from 2 independent experiments; two-tailed unpaired Student’s t-test. n, Representative liver luminescence images of the mRNAs from m. n = 4 biologically independent samples. o,p, NanoLuc translation in MEFs. Immunoblot of two replicates at 6 h after transfection (R1 and R2; o) and luminescence at 3 h after transfection (p). n = 3; two-tailed unpaired Student’s t-test (p). Data are the mean ± s.e.m. unless otherwise indicated; n indicates independent biological replicates; only significant values are shown.MoDCs are particularly sensitive to dsRNA, which engages protein kinase R (PKR) to phosphorylate eIF2α and repress translation, and activates Toll-like receptor 3 (TLR3) to drive type I interferon responses6. To assess whether residual immune activation contributes to the translational advantage of ac4C, we attenuated dsRNA signalling using two orthogonal approaches. Pharmacological-mediated inhibition21 of PKR equalized p-eIF2α levels across conditions. However, ac4C-modified mRNA still produced the most NanoLuc protein, including relative to m5C and double-modified mRNAs (Extended Data Fig. 3i,j). Transfection of IVT mRNAs synthesized with the dsRNA-minimizing mutant T7 polymerase similarly eliminated differences in immune activation between ac4C and m1Ψ, whereas ac4C maintained higher NanoLuc protein expression across donor samples (Fig. 2h–j and Extended Data Fig. 4a–d).To further disentangle immune signalling from translation, we titrated NanoLuc mRNA across a 1,000-fold range in MoDCs and identified a dose (100 ng) that supported strong protein expression without detectable IFNB1 induction (Extended Data Fig. 4e,f). At this subimmunostimulatory dose, ac4C conferred an even greater relative increase in translation compared with m1Ψ than at standard input levels (Extended Data Fig. 4g). These findings establish that ac4C suppresses immune responses to IVT mRNA while enhancing translation through mechanistically uncoupled processes.A principal mechanism by which uridine modifications limit immune responses to IVT mRNA is by reducing signalling through the uridine-sensing receptors TLR7 and TLR8. Recent work has shown that Ψ and m1Ψ achieve this effect by decreasing RNase-T2-mediated cleavage22,23. Endosomal TLR7 and TLR8 were highly expressed in MoDCs and unaltered by transfection (Extended Data Fig. 4h). Given the similarly low interferon induction with ac4C, we asked whether this cytidine modification likewise affects RNA cleavage. In vitro cleavage assays revealed comparable resistance to RNase T2 for ac4C and m1Ψ, whereas m5C displayed intermediate sensitivity (Fig. 2k,l and Extended Data Fig. 4i). Thus, the similar suppression of immune responses conferred by ac4C and m1Ψ probably reflects a shared mechanism, whereas their divergent effects on protein output arise from differences in translation itself.Finally, we assessed whether the translational advantage of ac4C extends to in vivo conditions and to non-immune primary cells. Intravenous delivery of FIII-7 LNP-encapsulated NanoLuc mRNA into BALB/c mice24,25,26 led to an approximately 3.5-fold increase in hepatic luminescence for ac4C compared with m1Ψ at 24 h (Fig. 2m,n). LNP properties were comparable across modifications, and residual hepatic m1Ψ mRNA levels exceeded those of ac4C. This result excludes differential delivery as an explanation for the observed outcomes (Extended Data Fig. 4j–n). A similar advantage was observed in mouse embryonic fibroblasts (MEFs), for which ac4C led to increased NanoLuc protein levels relative to m1Ψ despite similar transfection efficiencies (Fig. 2o,p and Extended Data Fig. 4o,p). Together, these observations establish that ac4C suppresses immune activation while supporting enhanced protein output across therapeutically relevant contexts.Modifications increase ribosome densityEnhanced protein synthesis from ac4C-modified mRNA compared with m1Ψ-modified mRNA, despite comparable immune suppression, pointed to a direct influence of nucleotide modification on translation dynamics. To investigate this aspect at the level of individual transcripts, we used single-molecule imaging of nascent peptides (SINAPs), which measures translation specifically at mRNAs that have successfully reached the cytoplasm. This approach avoids artefacts from differences in endosomal escape that confound bulk measurements27,28,29,30,31.The SINAPs reporter consists of an amino-terminal SunTag epitope array that recruits constitutively expressed single-chain variable fragment antibodies fused to superfolder GFP (scFv–sfGFP) to nascent peptides as they emerge from the ribosome exit channel to mark active translation sites (TLSs). A carboxy-terminal auxin-inducible degron minimizes diffusive background by degrading mature protein, and MS2-binding sites (MBSs) in the 3′ UTR recruit stably expressed fluorescent MS2 coat protein (MCP–RFP), which enables simultaneous visualization of individual transcripts and their translation (Fig. 3a).Fig. 3: Single-molecule translation imaging reveals increased translational efficiency with modified mRNAs.a, Schematic of three-colour smFISH–IF of the SINAPs mRNA reporters. b, Representative smFISH–IF images of U-2 OS cells transfected with SINAPs reporter mRNA. Dashed boxes indicate enlarged regions. Cyan, SunTag smFISH; red, MS2 smFISH; green, GFP IF. Yellow, red, cyan and magenta arrows indicate translating intact, MS2-alone, SunTag-alone and non-translating intact RNAs respectively. Scale bars, 10 μm (top) or 5 μm (bottom). c–f, Quantification of SINAPs translation. c, Mean fraction of translating mRNAs per cell per biological replicate. d, Mean number of ribosomes per translating mRNA calculated as the TLS signal normalized by a single mature protein in the same cell, showing the average per biological replicate. e, Fraction of cells containing cytosolic (endosome-released) SINAPs mRNAs (average of three biological replicates over time). f, Number of cytosolic SINAPs mRNAs per cell (average of three biological replicates over time). n = 160–400 cells examined over 3 independent experiments; two-tailed unpaired Student’s t-test, P values in f were combined using Fisher’s method.IVT SINAPs reporter mRNAs were co-transcriptionally capped, post-transcriptionally polyadenylated and transfected into U-2 OS cells (Extended Data Fig. 5a and Supplementary Table 1). Translation was examined in fixed cells by single-molecule fluorescence in situ hybridization combined with immunofluorescence (smFISH–IF)32, with nascent peptides detected by anti-GFP immunostaining rather than direct GFP fluorescence to bypass fluorophore maturation artefacts. Signal amplification by secondary antibodies enabled the detection of individual peptides released as dim puncta that are distinct from the brighter mRNA colocalizing to the TLS. To maintain single-molecule resolution at physiologically relevant mRNA loads (Extended Data Fig. 4f,g), SINAPs mRNAs were co-transfected with a ‘balancer’ mRNA with the same nucleotide modification (Extended Data Fig. 5b). Analysis was restricted to intact transcripts identified by dual-colour smFISH against SunTag and MS2 sequences, excluding abortive or partially degraded RNAs (Fig. 3b and Extended Data Fig. 5c). TLS intensities were normalized to single-peptide signals in the same cell to estimate ribosome occupancy (Methods and Extended Data Fig. 5d).Under these conditions, ac4C-modified and m1Ψ-modified mRNAs were more frequently translated and loaded more nascent peptides per transcript than unmodified and m5C-modified mRNAs (Fig. 3c,d). Notably, all reporters were efficiently translated at low doses without a balancer, a result consistent with the modification-tuned repression of initiation through p-eIF2α at high RNA loads (Extended Data Fig. 5e,f). These findings align with evidence that nucleotide modifications enhance IVT mRNA translation in part by mitigating stress-linked initiation repression2,33. Moreover, the results support SINAPs as a robust approach for measuring translation dynamics in cells.However, these measurements did not explain the translational advantage of ac4C in bulk assays, as m1Ψ produced a higher fraction of translating mRNAs and greater ribosome occupancy (Fig. 3c,d). Time-course smFISH–IF experiments further established that ac4C does not gain an edge through enhanced endosomal escape. Although ac4C modestly increased the fraction of cells with cytosolic SINAPs reporter mRNA at early time points, overall cytosolic mRNA counts per cell and translation engagement were similar for ac4C and m1Ψ (Fig. 3e,f and Extended Data Fig. 5g,h). Polysome profiling of transfected HeLa cells provided orthogonal evidence. That is, modified mRNA was associated more strongly with heavy polysomes than unmodified transcripts, with m1Ψ exhibiting the greatest enrichment (Extended Data Fig. 5i,j). Together, these fixed-cell analyses confirmed that there is increased ribosome engagement for modified transcripts relative to unmodified mRNA. However, the mechanistic basis of the translational advantage of ac4C remained unresolved.m1Ψ slows elongation and induces RQCTo capture translation dynamics not accessible by fixed-cell imaging, we examined elongation in live cells using ‘ribosome runoff’34. In this approach, the translation inhibitor harringtonine is used to block new initiation events. Elongating ribosomes are then allowed to complete translation and ‘runoff’ the transcript30. SINAPs reporter mRNAs were transfected into U-2 OS cells constitutively expressing scFv–sfGFP and MCP–RFP–CAAX, which tethers mRNAs to the plasma membrane and enables long-term TLS tracking by total internal reflection fluorescence (TIRF) microscopy35,36 (Fig. 4a–c). For each translating mRNA, we measured the interval between harringtonine addition and TLS disappearance, then compiled these values into survival curves to infer elongation rates (Fig. 4d, Methods and Supplementary Video 1). Runoff times differed across modifications. That is, unmodified (median = 3.7 min) and m5C-modified (median = 4.2 min) mRNAs cleared most rapidly. By contrast, ac4C-modified mRNA showed intermediate kinetics (median = 6.7 min) and m1Ψ-modified mRNA exhibited a substantial delay (median = 13.7 min). Because runoff time scales inversely with elongation rate, the substantial elongation slowdown with m1Ψ provides a mechanistic basis for its paradoxically high ribosome occupancy despite its low protein yield.Fig. 4: m1Ψ slows elongation and increases ribosome collision-dependent RQC engagement.a, Schematic of live-cell SINAPs. b, Schematic of ribosome runoff. Harringtonine blocks initiation, which allows elongating ribosomes to complete translation. The runoff time reflects the elongation rate. c, Representative snapshots from runoff imaging in U-2 OS cells transfected with SINAPs mRNA (Supplementary Video 1). Red, mRNA (tdMCP–mScarlet); green, TLSs (scFv–sfGFP). Scale bars, 2 μm. d, Survival curves of ribosome runoff for indicated mRNA modifications. Time zero corresponds to 1 min after harringtonine addition. Curves represent the fraction of mRNAs still translating at each time point calculated using the Kaplan–Meier method; shaded area, 95% confidence intervals (Greenwood’s formula). e, Schematic of ZNF598–HaloTag recruitment to collided ribosomes. f, Representative images of ZNF598–HaloTag recruitment to TLSs on ac4C-modified or m1Ψ-modified mRNAs (Supplementary Video 2). Green, TLSs (scFv–sfGFP); magenta, ZNF598–HaloTag (JFX650). Scale bars, 2 μm. g, Heatmaps of ZNF598–HaloTag recruitment to TLSs. y axis, individual mRNAs sorted by first colocalization event; x axis, imaging time. The colour bar indicates normalized ZNF598–HaloTag intensity. h,i, Quantification of ZNF598 recruitment. h, Fraction of TLSs with colocalized ZNF598 (≥1 event >10 s). i, Mean fluorescence intensity (arbitrary units (AU)) of colocalized ZNF598. Symbols depict the average per biological replicate; n = 10–20 cells examined over 3 independent replicates; one-way analysis of variance. j, Survival curves from ribosome runoff assays in cells treated with control (siCtrl) or ZNF598-targeting (siZNF598) siRNA, as in d (Supplementary Video 3).Early NanoLuc time-course experiments in MoDCs supported this interpretation. Unmodified mRNA produced the highest luminescence at 15 min after transfection but was surpassed by ac4C at 30 min and subsequently by m1Ψ at 45 min, despite comparable transfection efficiencies (Extended Data Fig. 6a–c). This temporal ordering mirrored the runoff measurements. Unmodified and m5C-modified mRNAs elongated rapidly but were constrained by eIF2α-mediated initiation repression (Extended Data Fig. 5f). By contrast, the slow elongation of m1Ψ-modified mRNA promoted ribosome accumulation along the CDS, a result consistent with its enrichment in heavy polysome fractions (Extended Data Fig. 5j).Slow elongation can generate ribosomal traffic jams that promote collisions37 and activate ribosome-associated quality control (RQC), which leads to ribosomal subunit splitting and nascent-peptide degradation38. To assess whether the slower elongation of m1Ψ is associated with increased collision propensity, we monitored recruitment levels of ZNF598, an E3 ligase that ubiquitinates collided ribosomes39, to IVT SINAPs reporter mRNA in U-2 OS cells, with both ZNF598 alleles endogenously tagged with HaloTag40 (Fig. 4e). Co-expression of scFv–sfGFP and MCP–RFP–CAAX enabled simultaneous visualization of translation, mRNA and ZNF598 binding by TIRF microscopy40 (Fig. 4f, Methods and Supplementary Video 2). Nearly two-thirds of m1Ψ-modified transcripts colocalized with ZNF598 compared with roughly one-third of unmodified or ac4C-modified mRNAs (Fig. 4g,h). ZNF598–HaloTag fluorescence intensity on m1Ψ transcripts was also increased by approximately twofold (Fig. 4i), which indicated more frequent and longer-lived collisions.To directly link RQC activity to altered elongation dynamics, we depleted ZNF598 through short interfering RNA (siRNA) (Extended Data Fig. 6d). As a core RQC component, ZNF598 promotes the removal of collided ribosomes, and its depletion extends the time required to resolve the resulting roadblocks35. Accordingly, ZNF598 depletion further prolonged the already slow runoff time of m1Ψ-modified mRNAs, whereas ac4C runoff was unaffected (Fig. 4j and Supplementary Video 3). These results suggest that m1Ψ increases collision-driven RQC engagement relative to ac4C, which affects protein output through nascent-peptide degradation and potential feedback inhibition of initiation41,42,43. Collision levels on m1Ψ-modified transcripts nevertheless remained below the threshold for downstream signalling44,45 (Extended Data Fig. 6e,f), which suggests that there is effective buffering by RQC.Enhanced translation fidelity with ac4CIn addition to engaging RQC, ribosome collisions can stimulate +1 frameshifting46, which enables elongation to resume in an alternative reading frame until a premature stop codon is reached. The resulting truncated products reduce functional protein yield and may act as neoantigens capable of triggering unintended immune responses. Consistent with the substantial ribosome collisions observed on m1Ψ-modified mRNA, a recent study3 reported elevated +1 frameshifting with m1Ψ-modified IVT mRNA and detected immune responses to frameshifted peptides in recipients of mRNA-based COVID-19 vaccines.Although ac4C modestly slowed elongation relative to unmodified mRNA, it did not increase ZNF598 recruitment. This finding prompted us to assess whether this more limited slowdown affects ribosomal frameshifting. To this end, we generated N-terminally Flag-tagged firefly luciferase (FLuc) reporters. A WT construct containing five tandem uridines (WT-5×U) was compared with a frameshift-reporting variant containing a single-nucleotide insertion immediately downstream (+1FS-5×U) (Fig. 5a and Extended Data Fig. 7a). In the +1FS reporter, full-length FLuc is produced only after +1 frameshifting, whereas failure to frameshift generates an N-terminal truncation product. Analogous 5×C reporters (WT-5×C and +1FS-5×C) were generated to model a cytidine-rich context (Fig. 5a and Extended Data Fig. 7a). All mRNAs were synthesized using mutant T7 polymerase to minimize dsRNA by-products, and RNA sequencing (RNA-seq) confirmed comparably low error rates across conditions (Supplementary Table 2).Fig. 5: m1Ψ increases +1 frameshifting relative to ac4C in IVT mRNA.a, Schematic of IVT mRNAs containing 5×U or 5×C motifs, encoding N-terminally Flag-tagged FLuc from WT or +1 frameshifted (+1FS) translation. b–d, FLuc translation in RRLs. b, Autoradiograph of labelled translation products 80 min after FLuc mRNA addition, with full-length (FL) and N-terminal truncation (N-FLuc) products indicated. c, Quantification of frameshifting efficiency, expressed as FL/N-FLuc signals. d, Quantification of WT-specific truncation (indicated by the asterisk in b) relative to total signal. n = 3; two-tailed unpaired Student’s t-test compared with unmodified FLuc. Asterisk indicates a truncated product of around 30 kDa in size. e–g, FLuc translation in transfected HeLa cells. e, Luminescence at 6 h after transfection comparing mRNAs of the +1FS and WT reporters. ND, not detected. f, Immunoblot of Flag-tagged FLuc at 6 h, with GAPDH as the loading control. g, Quantification of frameshifting from f, expressed as the FL protein signal relative to total protein. n = 3; two-tailed unpaired Student’s t-test. h,i, Ribo-seq of FLuc-transfected HeLa cells. h, RPF density across mRNAs for GAPDH and the WT-5×U FLuc reporter. i, P-site density across the FLuc CDS relative to ac4C and m1Ψ positions, with arrows indicating 5×C and 5×U motifs. Data are the mean ± s.e.m.; n indicates independent biological replicates; only significant values are shown.In RRLs, full-length FLuc was the predominant product from WT reporter mRNAs, whereas N-terminal truncations were the major products from +1FS reporters (Fig. 5b and Extended Data Fig. 7b). High full-length FLuc production from +1FS-5×U occurred only with m1Ψ-modified transcripts, whereas ac4C-modified, m5C-modified and unmodified transcripts produced minimal signals (Fig. 5b,c). Inclusion of m1Ψ in double-modified mRNAs restored frameshifting, which indicated that this effect is intrinsic to m1Ψ. By contrast, neither ac4C nor m5C increased frameshifting above background in the +1FS-5×C reporter (Fig. 5b,c). Thus, although ac4C slows elongation, this effect is insufficient to promote frameshifting at C-rich sequences. Instead, frameshifting remained highest with m1Ψ, a result consistent with its broader propensity to induce collision-dependent decoding errors. A truncated species indicative of ribosome stalling was also detected from WT transcripts in the presence of m1Ψ (Fig. 5b,d).These findings were recapitulated in transfected HeLa cells, which showed comparable mRNA uptake across conditions (Extended Data Fig. 7c). Luminescence from +1FS-5×U FLuc mRNAs reached around 10% of WT in the presence of m1Ψ but remained at background levels with unmodified and ac4C-modified transcripts (Fig. 5e and Extended Data Fig. 7d). By contrast, frameshifting from 5×C reporter mRNAs remained minimal, with only a modest increase in the presence of m1Ψ (Fig. 5e). Immunoblotting, performed with and without proteasome inhibition, confirmed these trends. That is, full-length FLuc from +1FS-5×U was detected only with m1Ψ, whereas truncated products predominated in all other conditions (Fig. 5f,g and Extended Data Fig. 7e–g). These data indicate that the substantial frameshifting observed with m1Ψ at U-rich sequences is not reproduced by ac4C at C-rich sequences.To connect these observations with ribosome dynamics, we performed ribosome profiling in HeLa cells transfected with WT-5×U FLuc mRNAs (Supplementary Table 3). Ribosome-protected fragment (RPF) recovery, read-length distributions and profiles across endogenous transcripts were comparable between conditions (Fig. 5h and Extended Data Fig. 8a,b). Unmodified and ac4C-modified FLuc produced similar CDS RPF distributions, with no evidence of ribosome stalling despite the modest elongation slowdown with ac4C. By contrast, m1Ψ-modified FLuc showed substantial ribosome accumulation at a U-rich region spanning amino acids 269–291 downstream of the 5×U sequence, with reduced density elsewhere (Fig. 5h). This region is notable on two counts. First, amino acid 291 corresponds to the encoded premature stop codon of the mRNA for the +1FS-5×U reporter, which indicated that the similarly sized truncation product observed in m1Ψ-modified WT FLuc RRL reactions probably results from ribosome stalling at this sequence (Fig. 5b). Second, P-site mapping47 revealed two enrichment peaks separated by around 31 nucleotides in this interval, a result consistent with stacked or collided ribosomes (Fig. 5h,i). Notably, uridine content across the CDS of the FLuc reporter averaged at 25.6% but increased to about 41% in this RPF-dense region, thereby potentially generating a local velocity mismatch under m1Ψ-mediated conditions (Fig. 5h,i and Extended Data Fig. 8c). This finding aligns with reports of increased dwell times at m1Ψ-containing NUN and NNU dicodons9, four of which occur in our settings (Supplementary Table 1). Comparable pausing was absent at cytidine-rich sequences in ac4C-modified mRNA, including the 5×C region (Fig. 5i and Extended Data Fig. 8c).Despite clear ribosome pausing, truncated products were not detected from WT FLuc following proteasome inhibition in cells (Fig. 5h and Extended Data Fig. 7f). Likewise, protein stability was comparable across ac4C- and m1Ψ-modified mRNAs (Extended Data Fig. 8d,e), and mass spectrometry did not detect frameshifting at the 5×U site (Extended Data Fig. 8f). This finding indicated that translation remains largely accurate in optimized coding contexts. However, +1 frameshifted peptides were identified at the CCU–CCC dicodon at amino acids 197–198 in a C-rich region in samples translated from m1Ψ-modified or unmodified FLuc mRNA. This result provides a rationale for the low-level frameshifting observed with m1Ψ in the +1FS-5×C reporters (Fig. 5b-f and Extended Data Fig. 8f). These findings are consistent with the known susceptibility of proline-rich sequences to frameshifting48,49. By contrast, the absence of frameshifting in this region with ac4C-modified transcripts raises the possibility that enhanced Watson–Crick pairing12 confers a fidelity advantage in sequences prone to P-site slippage.Together, our findings establish elongation dynamics as a central determinant of translational output from synthetic mRNAs, with nucleotide modifications defining distinct pathways that shape ribosome collisions and quality control. We conceptualize these effects through a ‘braking upon modified position’ (BUMP) model. In this scenario, slowed elongation at modified nucleotides increases the likelihood that trailing ribosomes encounter paused leaders, which generates transient traffic along the mRNA. The modifications examined here occupy distinct positions along this spectrum. Unmodified mRNA elongates rapidly but induces p-eIF2α, which limits protein synthesis through initiation repression. ac4C modestly slows elongation while avoiding collision-prone ribosome stacking, which supports efficient and accurate ribosome transit. By contrast, m1Ψ slows elongation more severely, which promotes ribosome stacking, RQC engagement and collision-induced +1 frameshifting.The molecular basis for these differences probably lies in their distinct effects in the ribosomal decoding centre. The N4-acetyl group of ac4C enforces a cytidine conformation that stabilizes Watson–Crick base pairing with guanosine to enhance decoding efficiency without perturbing ribosome geometry12. By contrast, m1Ψ is forced into an energetically unfavourable C2′-endo ribose conformation after translocation to the P-site, which provides a mechanistic basis for the observed increased ribosome dwell times at m1Ψ-modified codons4,9. These findings reflect a broader principle: codon–anticodon interactions and tRNA abundance have been co-optimized over evolutionary timescales to balance elongation speed, accuracy and co-translational folding50. Uniform substitution of canonical nucleosides with chemically distinct analogues in synthetic mRNAs disrupts this equilibrium, which creates a decoding landscape for which no evolutionary tuning exists.These chemical distinctions extend beyond the decoding centre to shape how modified transcripts are recognized by innate immune sensors. Despite modifying cytidine rather than uridine, ac4C achieved immune suppression comparable to m1Ψ, an unexpected result given that uridine substitution has been considered the primary determinant of TLR7 and TLR8 evasion. Our data suggest that this equivalence arises from shared resistance to RNase-T2-mediated cleavage, which limits the generation of uridine-rich fragments that activate endosomal sensors22,23. These findings expand the paradigm for immune evasion and demonstrate that chemically distinct modifications can converge on common functional outcomes through effects on RNA processing.From a therapeutic perspective, these results refine how nucleotide modifications should be evaluated and used. m1Ψ remains the dominant clinical modification owing to its robust performance and established safety profile, and our data do not argue for its general replacement. Rather, ac4C provides a distinct balance of properties, including strong protein output, low immunogenicity and preservation of translational fidelity, which may be advantageous in applications that require accurate protein production. Conversely, m1Ψ may remain preferable in contexts when slower elongation is tolerated or beneficial. For example, in cases when reduced elongation rates can support co-translational protein folding or when immune activation is desired, such as vaccination6,7. However, the potential for neoantigen generation through frameshifting warrants consideration3.Our study establishes that the functional output of synthetic mRNAs is governed not only by ribosome engagement but also by how productively and accurately ribosomes traverse a modified transcript. We propose that translational BUMPs, defined as localized disruptions in ribosome flow introduced by nucleotide modifications, provide a unifying framework for understanding how chemical changes to RNA are interpreted by the translation machinery. Incorporating this principle into mRNA design may facilitate the development of next-generation therapeutics with improved performance across diverse applications.MethodsEthicsHuman peripheral blood was obtained from de-identified healthy donors through the NIH Clinical Center, Department of Transfusion Medicine, Research Blood Donor Program, under a protocol approved by the NIH Institutional Review Board (IRB no. 99CC0168). All donors provided written informed consent before participation.Cell cultureHeLa cells (American Type Culture Collection (ATCC), CCL-2) were cultured in DMEM (Thermo Fisher Scientific, 10313021) supplemented with 2 mM L-glutamine (Thermo Fisher Scientific, 25030164) and 10% bovine calf serum (BCS, HyClone, SH30073.03; DMEM-BCS). THP-1 cells (ATCC, TIB-202) were cultured in RPMI 1640 (Thermo Fisher Scientific, 21870092) supplemented with β-mercaptoethanol (55 mM, Sigma, M3148), 2 mM L-glutamine and 10% FBS (Seradigm, FBS, 97068-085, RPMI-primary). THP-1 cells were differentiated into M0 macrophages through the addition of phorbol 12-myristate 13-acetate (PMA, 162 nM, Sigma-Aldrich, P1585) with 1.5 × 10⁶ cells per 6-well plate (for protein) or 0.375 × 10⁶ cells per 12-well plate (for RNA and luminescence) for 16–24 h. THP-1-derived M0 cells were cultured in RPMI-primary medium for 24 h before transfection. HeLa and THP-1 cells were not authenticated. MEFs from a frozen cryovial were thawed and cultured in DMEM with 15% FBS and 1% l-glutamine. Primary monocytes were isolated from human peripheral blood using an EasySep Direct Human Monocyte Isolation kit (Stem Cell Technologies, 19669) according to the manufacturer’s instructions, followed by the addition of 25 mM HEPES (Quality Biological, 118-089-721), 50 ng ml–1 recombinant human IL-4 (Peprotech, 200-04) and 50 ng ml–1 recombinant human GM-CSF (Sigma-Aldrich, GF-304) in RPMI primary medium to generate MoDCs.The SINAP technology relies on several auxiliary proteins: scFv–sfGFP to label the nascent peptides, MCP–RFP to label the RNA and the E3 ligase TIR1 from Oryza sativa (OsTIR1) for the auxin-inducible degron to deplete the mature proteins29. Two U-2 OS cell lines expressing these auxiliary proteins were used in this study: one for live-cell imaging (scFv–sfGFP, OsTIR1 (ref. 51) and MCP–RFP–CAAX), and the other for fixed-cell (scFv–sfGFP, OsTIR2 (ref. 52)) experiments. These U-2 OS cells (ATCC, HTB-96) were maintained in DMEM–FBS (Corning, 10-013-CM and Millipore Sigma, F4135), 100 U ml–1 penicillin and 100 µg ml–1 streptomycin (Millipore, P0781). Cells were cultured at 37 °C in a 5% CO2 incubator and passaged approximately every 3 days. Monthly mycoplasma contamination testing was performed to ensure sterility.Flow cytometryThe following antibodies were used for flow cytometry experiments: PE-conjugated anti-Hu/NHP CD25 antibody ((CD25-4E3), eBioscience, 12-0257-42), APC-conjugated anti-HuCD14 antibody ((61D3), eBioscience, 17-0149-42), PerCP/cyanine5.5-conjugated anti-human CD11c antibody ((3.9), BioLegend, 301624) and PE-conjugated anti-CD209 (DC-SIGN) antibody ((9E9A8), BioLegend, 330105). In brief, 0.1–1 × 10⁶ cells were stained in 100 µl staining buffer (1% FBS in PBS) for 30 min at room temperature in the dark, washed twice with PBS and resuspended in 1% paraformaldehyde containing staining buffer. Flow cytometry acquisition was performed on a BD FACSymphony A5 and data were examined using FACSDiva software (v.9.3.1, BD Bioscience). Data were further analysed using FlowJo (v.10.8.1, BD).CloningTo generate a 5×C-stretch in the N-terminally Flag-tagged FLuc sequence3, a PCR strategy was used to introduce synonymous mutations of proline 197 and 198 (Supplementary Table 1). After confirmation of the mutation by Sanger sequencing, WT-5×C FLuc was back cloned into the original (WT-5×U FLuc) plasmid with BsrGI (NEB, R3575) and Bsu36I (NEB, R0524). Single-nucleotide insertion next to the C-rich sequence was accomplished by inserting a mutated DNA fragment (IDT) using BsrGI and Bsu36I. The sequence for the C=U NanoLuc reporter was purchased as a DNA fragment (IDT) and cloned using BbsI-HF (NEB, R3539) and BsmI (NEB, R0134).In vitro transcription and polyadenylationLinearized and purified plasmid DNA (purchased from Genscript; see Supplementary Table 1 for sequences) was IVT with T7 polymerase (NEB, M0251L) or G47A+884G mutant T7 (gift from Y.-X. Wang’s Laboratory) in combination with inorganic pyrophosphatase (Escherichia coli, NEB, M0361L). Co-transcriptional capping was achieved with CleanCap AG (TriLink, N-7113) according to the manufacturer’s instructions (TriLink). SINAPs reporter mRNAs were post-transcriptionally polyadenylated with E. coli poly(A)polymerase (NEB, M0276) supplemented with murine RNase inhibitor (NEB, M0314) for 30 min at 37 °C according to the manufacturer’s instructions. For modified transcripts, ac4CTP (Jena Bioscience, NU-988L) or m5CTP (TriLink, N-1014-5) replaced CTP, and m1ΨTP (TriLink, N-1081) or ΨTP (TriLink, N-1019-5) replaced UTP in the reaction mix. Purification of polyadenylated RNA was achieved by magnetic separation using RNAClean XP beads (Beckman Coulter, A63987) according to the manufacturer’s instructions. Denaturing agarose gel electrophoresis was performed using NorthernMax 10× Denaturing gel buffer (Thermo Fisher Scientific, AM8676). Gels were stained after electrophoresis using SYBR Green II RNA gel stain (1:10,000 in TBE, Thermo Fisher Scientific, S7564) for 30 min in the dark to visualize RNA. ac4C-modified IVT mRNAs were diluted before gel loading to account for increased staining intensity.Nucleoside mass spectrometryModified and unmodified IVT mRNAs (100 ng each) were digested in 35 µl using snake venom phosphodiesterase (0.2 U, Abnova, P5263), calf intestinal phosphatase (2 U, Promega, M1821) and benzonase (2 U, Millipore Sigma, E1014) prepared with 1 mM MgCl2 (Quality Biological, 351-033), 5 mM Tris (pH 8, Invitrogen, AM9855G), 10 nmol butylated hydroxytoluene (Sigma-Aldrich, B1378) and 5 µg tetrahydrouridine (Calbiochem, 584222) (modified from a previously described method53) and incubated for 2 h at 37 °C. Samples were diluted with 15 µl LC–MS buffer A (0.0075% formic acid (Supelco, 5330020050) in ultrapure water) and filtered for 35 min at 3,273g and 4 °C through 0.2 µm Supor AcroPrep Advance 96-well plates (Cytiva, 50-206-3147). Of the filtrate, 39 µl was subjected to mass spectrometry analysis on an Agilent Technologies triple quad 6495C mass spectrometer. For HPLC (Agilent 1290 Infinity II), buffer A (described above) and buffer B (0.0075% formic acid in acetonitrile (Honeywell, LC015) were used in combination with an alkyl reversed-phase column (Zorbax RRHD StableBond Aq, 2.1 × 150 mm, 1.8 µm, 80 Å, Agilent Technologies, 859700-914); concentration buffer B: 0–1 min 0%, 1–1.4 min 0.1%, 1.4–2.8 min 0.4%, 2.8–4.2 min 0.9%, 4.2–5.6 min 1.6%, 5.6–8 min 4%, 8–11.5 min 15%, 15–15.5 min 50%, 15.5–16.5 min 50%, 16.5–17 min 0% and 17–18 min 0%.In vitro translationIn vitro translation assays were performed by incubating 50 ng unmodified or modified luciferase mRNA for 3 min at 65 °C before adding 3.5 μl RRL (Promega, L4960) in a final volume of 5 μl at 30 °C. Reactions were stopped at 20, 40, 60, 80, 180 and 360 min by placing on dry ice. In vitro translation assays incorporating [35S]-L-methionine/cysteine were performed by incubating 100 ng unmodified or modified luciferase mRNA for 3 min at 65 °C before adding 3.5 μl RRL containing an amino acid mixture (minus methionine) and 10 μCi [35S]-L-methionine/cysteine (Revvity, NEG772002MC) in a final volume of 5 μl at 30 °C according to the manufacturer’s instructions. Reactions were stopped at 80 min by adding 2× Laemmli loading buffer. Proteins were denatured for 10 min at 70 °C before separation on 14% SDS–polyacrylamide gels for PAGE. Radioactive signals were captured on a phosphoscreen for 72 h before detection with a Typhoon molecular bioimager (GE).IVT mRNA transfectionsFor NanoLuc, NanoLuc synthesized with G47A+884G mutant T7 polymerase, C=U NanoLuc and CD25 experiments in HeLa cells, cells were transfected in suspension with 2.5 µg IVT mRNA per 1 × 10⁶ cells using 3.75 µl MessengerMax reagent (Invitrogen, LMRNA015) in OptiMEM (Thermo Fisher Scientific, 31985062) according to the manufacturer’s instructions. After 5 min (standard condition) or 24 h (extended transfection) of exposure to the mRNA–LNP complexes, the cells were washed twice with PBS, resuspended in fresh DMEM–BCS and seeded separately for protein, RNA and luminescence experiments. At the indicated time points, cells were lysed directly in TRIzol reagent (100 µl, Thermo Fisher Scientific, 15596026) or scraped into PBS before lysis in supplemented RIPA buffer (protease and phosphatase inhibitor). For FLuc experiments, plated HeLa cells were transfected at about 50% confluency with around 2.5 µg IVT mRNA per 6-well plate with 3.75 µl MessengerMax reagent in OptiMEM, as described above. Cells for RNA analysis were lysed immediately after transfection in TRIzol reagent. At 6 h after transfection, cells for protein analysis were washed twice with PBS, scraped into PBS and lysed in cell culture lysis buffer (Promega, E1500) supplemented with protease and phosphatase inhibitor. To generate dsRNA-treated controls, HeLa cells were transfected with 0.5 µg ml–1 polyI:C (Millipore Sigma, P1530) for 2 h, using 12 µl MessengerMax reagent and 4 ml OptiMEM, according to the manufacturer’s instructions. Cells were collected for protein and RNA analyses 6 h after polyI:C treatment. THP-1-derived M0 macrophages, primary human MoDCs and MEFs were transfected with 1 µg IVT mRNA per 1 × 10⁶ live cells in suspension before plating (MoDCs and MEFs) or in seeded adherent cells (THP-1). For U-2 OS experiments, 500,000 cells were seeded 24 h before transfection of 1 μg RNA using 1.5 μl Lipofectamine MessengerMax according to the manufacturer’s protocol. Anisomycin (Sigma Aldrich, A9789-5MG) control cells were treated at 0.2 μg ml–1. The cells were collected with supplemented RIPA buffer (protease and phosphatase inhibitor) after 1.5 h. For titration experiments, RNA and MessengerMax reagent were each serial-diluted 1:10 before forming LNP complexes. Conditions were otherwise as described for HeLa cells.ElectroporationHeLa cells (1.1 × 10⁶) were resuspended in 100 µl Neon NxT resuspension buffer R, and aqueous RNA (1.1 μg in 10 μl) was added and gently mixed. The mixture (100 μl) was aspirated into a 100 μl Neon NxT Tip on a respective pipette and docked into a Neon NxT Pipette Station with the tube containing 2 ml buffer E100. Electroporation was performed using the HEK293 mRNA1 protocol, and the cells were immediately transferred to complete medium for plating.LuminescenceFor in vitro translation assays, reactions were diluted with 95 μl of 1 mg ml–1 BSA, then 10 μl of the dilution was mixed with 40 μl PBS and 50 μl Nano-Glo reagent (Promega, N1120) according to the manufacturer’s instructions. In NanoLuc-transfected cells, 100 µl Nano-Glo assay reagent was used per 10,000 cells. For detection of FLuc luminescence, cleared lysate was diluted to correspond to 10,000 transfected cells in 10 µl Cell Culture lysis buffer (Promega, E1500). Luminescence was determined by adding 100 µl Luciferase assay reagent according to the manufacturer’s instructions, followed by detection using a SpectraMax iD3 (Molecular Devices) instrument.Protein stabilityTo inhibit the proteasome, HeLa cells transfected with IVT mRNA were cultured with 25 µM MG132 (Cell Signaling Technologies, 2194S) in DMEM–BCS for 6 h, followed by protein lysis. To assess protein stability, 100 µg ml–1 cycloheximide (Sigma, C7698) was added to HeLa cells 12 h after transfection. Cells were collected for protein analyses at the indicated time points.PKR inhibitionAfter 5–6 days of differentiation, MoDCs were counted and pretreated with the PKR inhibitor C16 (1.5 μM, 0.0075% DMSO, Sigma, 527450) for 10 min. The cells were washed and transfected with 1 μg RNA per 1 × 10⁶ cells as described above and treated for 6 h before collection.Western blot analysisCell lysates were cleared by centrifugation at full speed for 15 min at 4 °C, and the protein concentration was quantified using a Pierce BCA Protein Assay kit (Thermo Fisher Scientific, A55865). For general expression analysis, equal amounts of protein (5–30 μg) were loaded on 4–12% Bis-Tris NuPAGE gels (Thermo Fisher Scientific, NP0321), separated using NuPAGE MOPS SDS running buffer (Thermo Fisher Scientific, NP0001) and transferred onto 0.2 μm nitrocellulose membranes from a Trans-Blot Turbo RTA Mini kit (Bio-Rad, 1704270) according to the manufacturer’s instructions. For CHX-chase, an equal volume of lysate (10 μl) was analysed.Membranes were blocked with 5% milk in 0.05% Tween-20 TBS buffer and incubated in a solution containing 5% milk in 0.05% Tween-20 TBS buffer and the following primary antibodies: rabbit anti-eIF2α (1:1,000, Cell Signaling Technology, 9722), rabbit anti-p-eIF2α ((E90), 1:1,000, Abcam, ab32157), mouse anti-NanoLuc ((965808),m1:500, R&D, MAB10026), rabbit anti-TNF ((EPR22598-212), 1:1,000, Abcam, ab255275), mouse anti-β-tubulin ((D3U1W), 1:1,000, Cell Signaling Technology, 86298), rabbit anti-CD25 ((SP176), 1:300, Abcam, ab231441), mouse anti-Flag ((M2), 1:1,000, Sigma-Aldrich, F1804), mouse anti-JNK ((1A12E1), 1:1,000, Proteintech, 66210-1-Ig), rabbit anti-phospho-SAPK/JNK ((Thr183/Tyr185) (81E11) 1:1,000, Cell Signaling Technology, 4668S), rabbit anti-phospho-p38 MAPK (Thr180/Tyr182) (1:1,000, Cell Signaling Technology, 9211S), rabbit anti-p38 MAPK (1:1,000, Cell Signaling Technology, 9212S), rabbit anti-TLR8 (1:1,000, Thermo Fisher Scientific, PA5-102413), rabbit anti-TLR7 ((EPR2088(2)), 1:1,000, Abcam, ab124928), rabbit anti-lamin B1 ((EPR8985(B)), 1:1,000, Abcam, ab133741), rabbit anti-ZNF598 ((5H5L17), 1:1,000, Thermo Fisher Scientific, 703601), mouse anti-PKR ((1441CT628.33.40), 1:1,000, Thermo Fisher Scientific, M5-37667), rabbit anti-phospho-PKR/EIF2AK2-T446 ((ARC0293), 1:1,000, ABclonal, AP1134) and mouse anti-GAPDH ((6C5), 1:1,000, Santa Cruz Biotechnology, sc-32233). After overnight incubation at 4 °C, membranes were washed 3 times in 0.05% Tween-20 TBS buffer, followed by incubation with the horseradish-peroxidase-conjugated secondary antibodies anti-mouse IgG (1:5,000, GE Healthcare, NA931) or anti-rabbit IgG (1:10,000, Cell Signaling Technology, 7074). Western blots were visualized by enhanced chemiluminescence using ECL Western Blotting Detection Reagents (Cytiva, RPN2209), SuperSignal West Pico PLUS Chemiluminescent Substrate (Thermo Fisher Scientific, 34580) or SuperSignal West Femto Maximum Sensitivity Substrate (Thermo Fisher Scientific, 34096). Chemiluminescence was detected using a ChemiDoc Imaging System (Bio-Rad). Densitometry was performed using ImageLab software (Bio-Rad).RNase T2 treatmentRNA (500 ng) was diluted with water. Human RNase T2 protein (sf9, His, MedChemExpress, HY-P76006) was added at the indicated concentrations in sodium acetate buffer (final 50 mM, pH 4.5) and EDTA (final 2 mM, pH 8.0). After incubation at 37 °C for 5 min, reactions were quenched with denaturing gel buffer, heated to 65 °C for 5 min and separated on a denaturing gel.Translation imagingMicroscopyFixed-cell data were acquired on a wide-field upright Nikon Eclipse Ni microscope, which was controlled by Nikon Elements software. The system was equipped with a Spectra X LED light engine (Lumencor), an Orca 4.0 v.2 sCMOS camera (Hamamatsu) and a ×60 oil-immersion objective lens (1.4 NA, Nikon). The x-y pixel size was 108.3 nm.Live-cell data were acquired using a custom inverted Nikon Eclipse Ti-2E microscope, which was controlled by Nikon Elements software. The setup included an iLas2 Ring TIRF system with a ×60 apochromatic oil-immersion TIRF objective lens (1.49 NA, Nikon MRD01691), an ORCA-Fusion BT sCMOS camera (Hamamatsu) with a 6.5 µm pixel size, an LUNF-XL multilaser unit with 405 nm, 488 nm, 561 nm and 640 nm lasers (50 mW, 60 mW, 50 mW and 40 mW, respectively), with a TRF89901-EMV2 ET quad-band filter set (Chroma) optimized for 405, 488, 561 and 640 nm wavelengths for TIRF application. The x-y pixel size was 108.3 nm.Fixed-cell smFISH–IF experimentssmFISH–IF was performed following previously described protocols32,36. In brief, 12 mm no. 1 German glass coverslips (Electron Microscopy Sciences, 72290-03) were carefully distributed into the wells of a 24-well tissue culture plate (Falcon, 353226) and cleaned with 3 M sodium hydroxide for 5 min followed by 3 washes in Dulbecco’s PBS (DPBS) (Corning, 21-031-CM). The coverslips were coated with a 1:400 dilution of fibronectin (Sigma-Aldrich, F1141-2 mg) in DPBS for 30 min at 37 °C, followed by one wash with DMEM. Next, 25,000 U-2 OS cells stably expressing the SINAPs accessory proteins OsTIR2–IRES–scFV–sfGFP were seeded on each coverslip. One day after seeding, the medium was exchanged and supplemented with 1 µM 5-phenyl-indole-3-acetic acid (Fisher Scientific, NC195789). IVT mRNA (10 ng) was transfected into the cells using 1 µl Lipofectamine MessengerMAX transfection reagent (Invitrogen, LMRNA003) following the manufacturer’s protocol. Cells were incubated with the transfection reagent for 10 min, washed 3 times with prewarmed DMEM–10% FBS and left to incubate for an additional 1 h in DMEM–FBS. The cells were washed 3 times with PBS supplemented with 5 mM magnesium chloride (PBSM, Millipore, M2670), then subsequently fixed at room temperature for 10 min in 4% paraformaldehyde (Electron Microscopy Sciences, 50-980-492) diluted in PBSM. Three 5-min washes were performed with 1× PBSM to remove the fixation buffer. Cells were permeabilized in a buffer (PBSM + 5 mg ml–1 BSA (VWR, 0332) + 0.1% Triton-X100 (Millipore, T8787)) at room temperature for 10 min, followed by another three 5-min washes with 1× PBSM. The cells were treated with a pre-hybridization buffer consisting of 2× SSC (Corning, 46-020-CM), 10% formamide (Millipore Sigma, F9037) and 5 mg ml–1 BSA for 30 min. During the pre-hybridization step, the final hybridization solution was prepared: 60 nM SunTag_v4-Cy5 smFISH probes, 60 nM MBS_v5-Cy3 smFISH probes36, chicken anti-GFP antibody (1:1,000, Aves Labs, GFP-1010), 100 units ml–1 SUPERase·In (Thermo Fisher Scientific, AM2694), 1 mg ml–1 competitor E. coli tRNA (Millipore Sigma, 10109541001), 2 mM ribonucleoside vanadyl complex (NEB, S1402S), 10% formamide, 2× SSC and 10% w/v dextran sulfate (Millipore Sigma, D8906). The coverslips were incubated for a total of 3 h in the hybridization solution at 37 °C. After hybridization, the coverslips were washed 4 times with a solution of 10% formamide in 2× SSC. The coverslips were stained with a secondary antibody (Alexa-488-goat anti-chicken IgY secondary antibody, Thermo Fisher Scientific, A-11039) in a buffer (10% formamide, 2× SSC) twice at 37 °C for 20 min. The cells were quickly washed 3 times with 2× SSC to remove any unbound secondary antibodies before a final 5-min wash in 2× SSC. The coverslips were carefully removed from the culture dish and mounted with ProLong Diamond antifade reagent containing DAPI (Invitrogen, P36962) on a pre-cleaned frosted glass slide (Thermo Fisher Scientific, 12-552-3). The coverslips were left in the dark for more than 24 h and sealed with clear nail polish. Fixed-cell imaging was performed on the day following each respective smFISH–IF experiment.smFISH–IF time-course experiments with balancer mRNAsCells were transfected with a mixture of 10 ng SINAPs reporter mRNA and 490 ng CD25 balancer mRNA with the same nucleotide modification using 1 µl Lipofectamine MessengerMAX transfection reagent (Invitrogen, LMRNA003) following the manufacturer’s instructions. All experimental wells were transfected at the same time with the same master mix of reagents. Cells were incubated with the transfection mixture for 10 min, after which the transfection medium was removed and cells were washed three times with pre-warmed, equilibrated culture medium, at which point the time was marked as zero (t = 0). At 10, 20, 30, 60, 120 and 240 min after the wash, different wells were fixed and subject to the smFISH–IF procedure as described above.Ribosome runoff experimentsFor live-cell imaging experiments, U-2 OS cells stably expressing OsTIR1–IRES–scFV–sfGFP and tdMCP–mScarlet–tagRFPT–CAAX were seeded onto 35 mm glass-bottom dishes (Cellvis, D35-20-1.5-N) 48 h before transfection (around 80,000 cells per dish). The medium was refreshed 24 h before transfection, and 500 µM 3-indoleacetic acid (Millipore Sigma, I2886) was added to degrade mature proteins and to minimize background fluorescence.On the day of the experiment, each dish was transfected with 100 ng IVT mRNA diluted in 125 µl Opti-MEM mixed with 5 µl Lipofectamine MessengerMax transfection reagent (Invitrogen, LMRNA003) diluted in 120 µl Opti-MEM following the manufacturer’s protocol. Cells were incubated with the transfection reagent for 1 h, washed 3 times with prewarmed DMEM–FBS and then rinsed with FluoroBrite DMEM (Gibco, A1896701) supplemented with 10% FBS. Following 1 h of incubation in imaging medium, dishes were transferred to the microscope stage for live-cell imaging. Cells were maintained at 37 °C and 5% CO2 during imaging inside a Toki hit temperature-controlled stage top incubator. Positively transfected cells actively undergoing translation were identified by detecting translation signals in the GFP channel as well as positive RFP signal in the RNA channel, with each cell displaying approximately 20–40 tethered mRNAs.Harringtonine treatment and ribosome runoff experiments were performed according to a previously established protocol32. In brief, for each experiment, 3–4 positively transfected cells with active TLSs and close to each other were selected for imaging. After saving the cell positions and microscope focus, 0.75 ml imaging medium was removed from the dish and mixed with harringtonine in a 1.5 ml centrifuge tube, then added back to the dish, gently and thoroughly mixed to a final concentration of 9 µg ml–1 with the original medium in the dish by pipetting. Imaging started 1 min after adding harringtonine and the selected cells were imaged every 10 s for 30 min, with sequential laser excitation at 488 nm and 561 nm. Both channels were captured with a 500 ms camera exposure time.smFISH–IF experiments with harringtonine ribosome runoffsCells were transfected with 10 ng SINAPs reporter mRNA using 1 µl Lipofectamine MessengerMAX transfection reagent (Invitrogen, LMRNA003), following the manufacturer’s instructions. All experimental wells were transfected at the same time with the same master mix of reagents. Cells were incubated with the transfection mixture for 10 min, after which the transfection medium was removed, and cells were washed 3 times with prewarmed, equilibrated culture medium, at which point the time was marked as zero (t = 0). Harringtonine treatment was performed as described above, with the final concentration of harringtonine as 9 µg ml–1. At 0, 3, 5 and 15 min after harringtonine addition, the cells were washed 3 times with PBS supplemented with 5 mM magnesium chloride (PBSM, Millipore, M2670), then subsequently fixed at room temperature for 10 min in 4% paraformaldehyde (Electron Microscopy Sciences, 50-980-492) diluted in PBSM. The subsequent smFISH–IF procedure was performed as described above.Ribosome runoff experiments after knocking down ZNF598
N4-Acetylcytidine enhances synthetic mRNA translation yield and fidelity - Nature
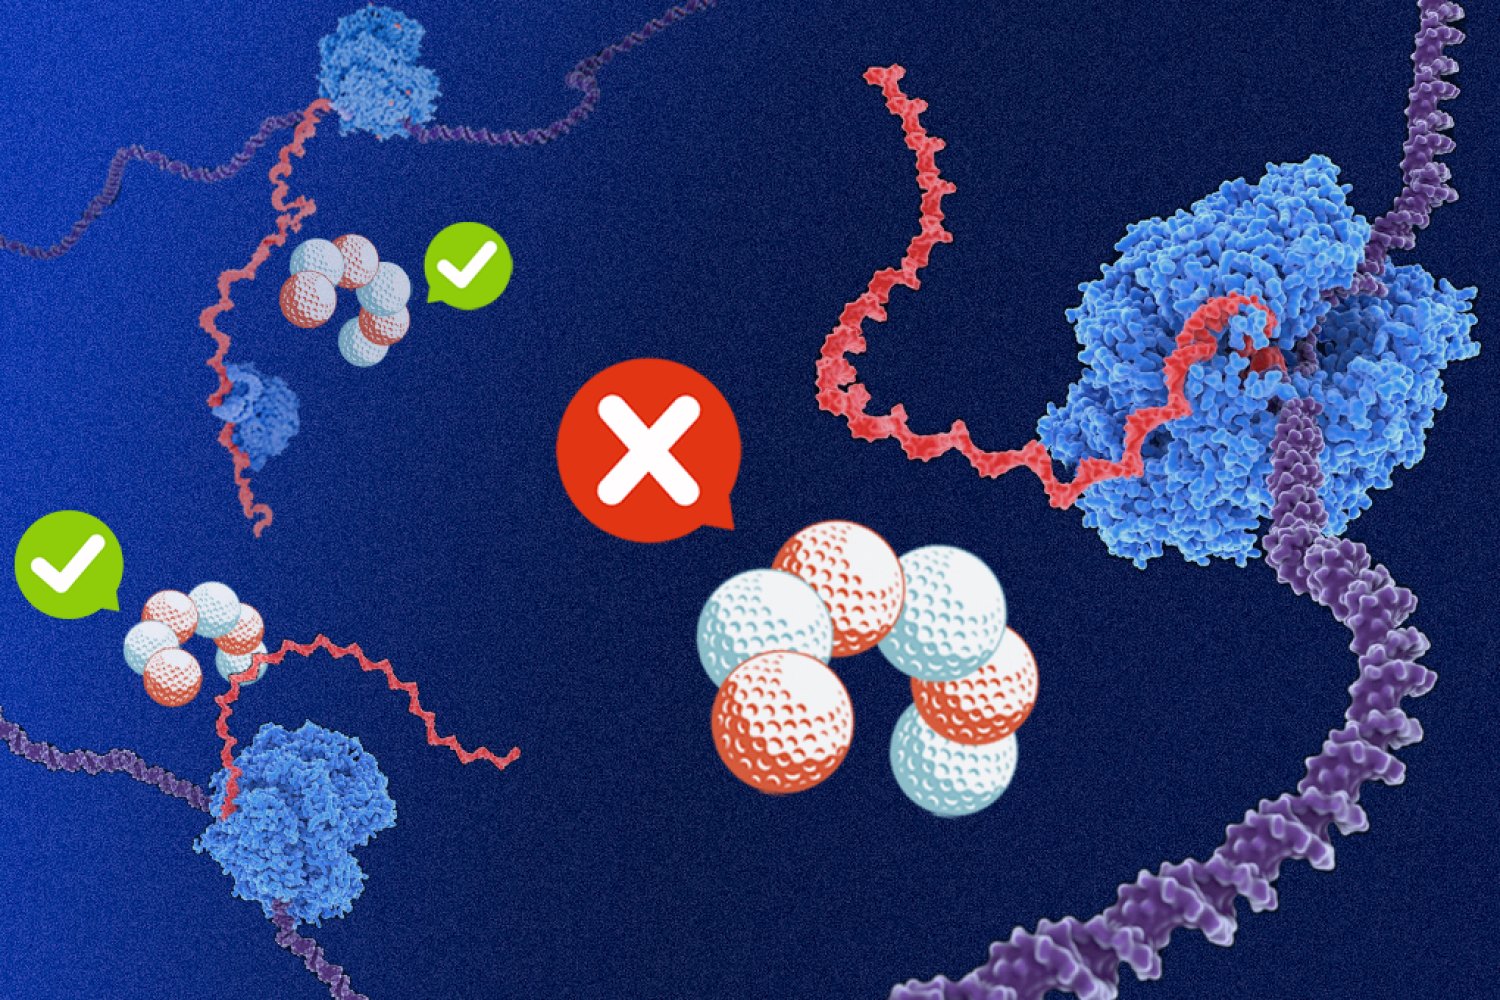
Different RNA modifications elicit different translation elongation rates for in vitro transcribed mRNAs that result in disparate translation outputs and fidelity, as shown here for N4-acetylcytidine versus the industry standard for synthetic mRNAs, N1-methylpseudouridine.
16,940 words~77 min read