If you've ever tried building a wearable app, you know the struggle: Heart Rate Variability (HRV) is the holy grail of recovery metrics, but raw data from a PPG (Photoplethysmogram) sensor is essentially a chaotic mess of noise and motion artifacts.
Extracting a clean physiological signal from a finger or wrist sensor requires a robust signal processing pipeline. In this guide, we will dive deep into HRV analysis and PPG signal processing using Python. We’ll implement a high-order Butterworth filter and an adaptive thresholding algorithm to transform noisy "garbage" data into medical-grade insights. If you are serious about building the next Oura or Whoop clone, you've come to the right place.
The Signal Processing Pipeline
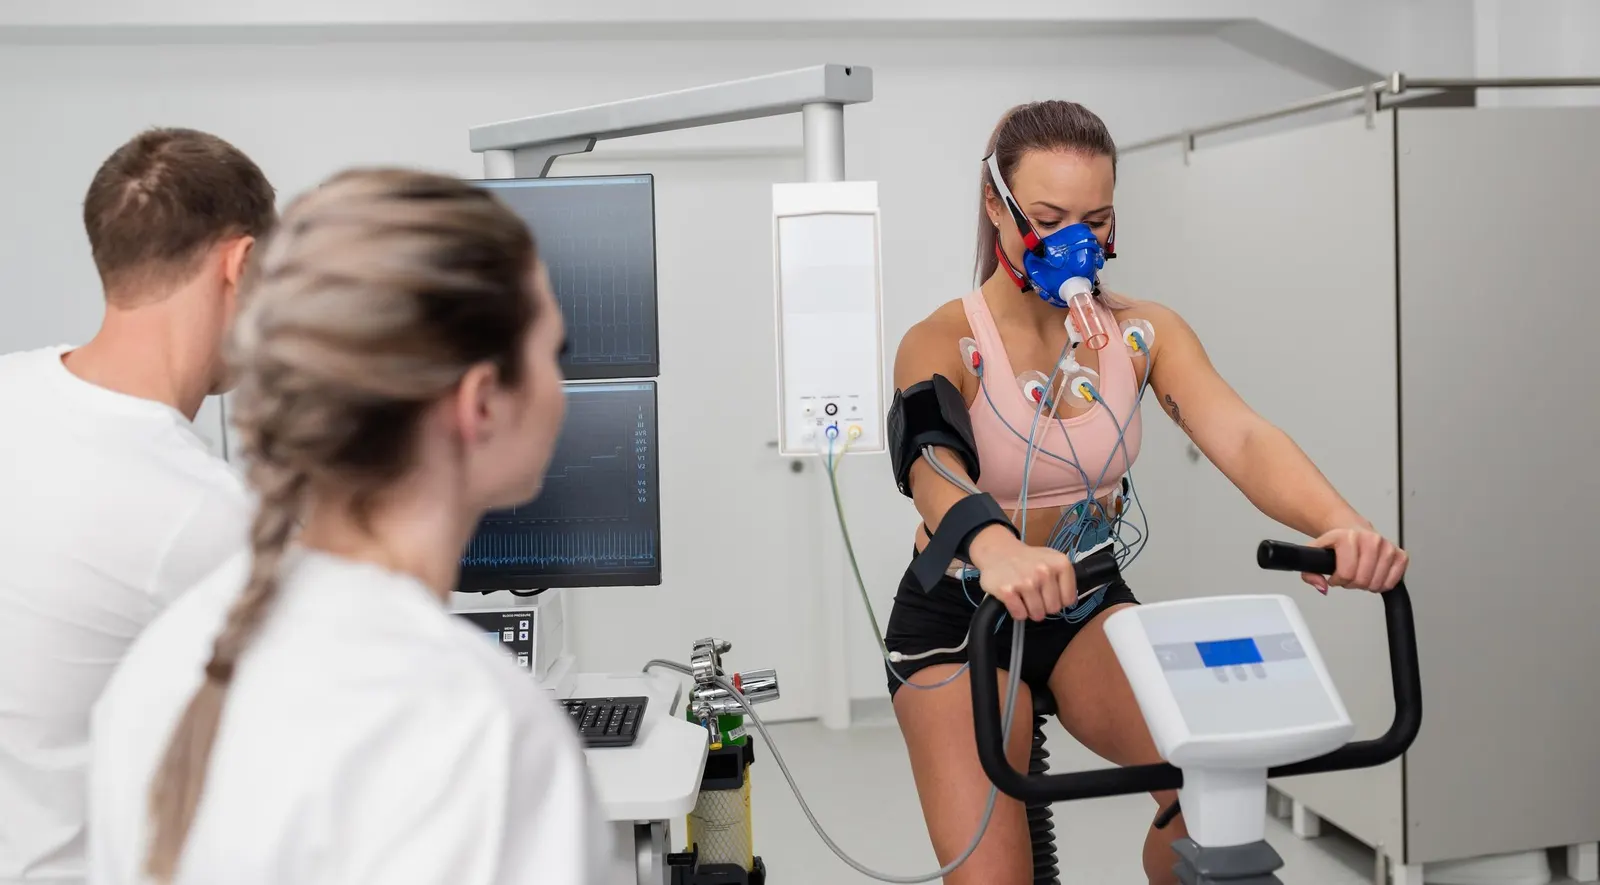
Before we touch the code, we need to understand the journey of a photon from an LED, through your capillaries, and into our data structure. The goal is to isolate the "systolic peaks" while ignoring the noise caused by hand movements or sensor friction.
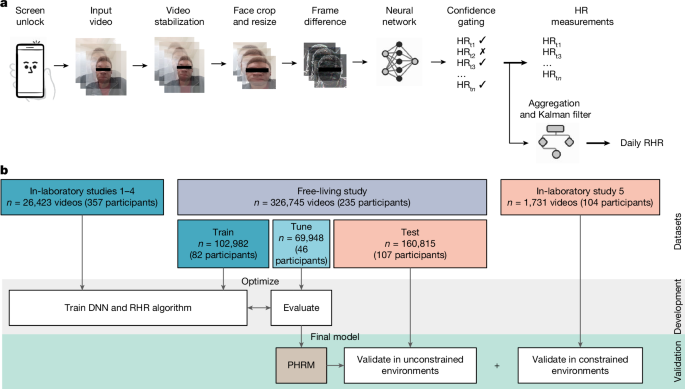
Architecture Overview