Digital teams need to know whether users can sign in, check out, stream content, or complete other critical journeys. But the data that describes those experiences is often split across product analytics, real user monitoring (RUM), synthetics, and other systems. Product teams may see conversion drops while engineering teams investigate availability, latency, or frontend errors in a separate workflow. Suddenly, it’s difficult to quickly answer basic questions: Are users completing the journey? Is a technical issue blocking them, and which part of the stack is contributing to the problem?
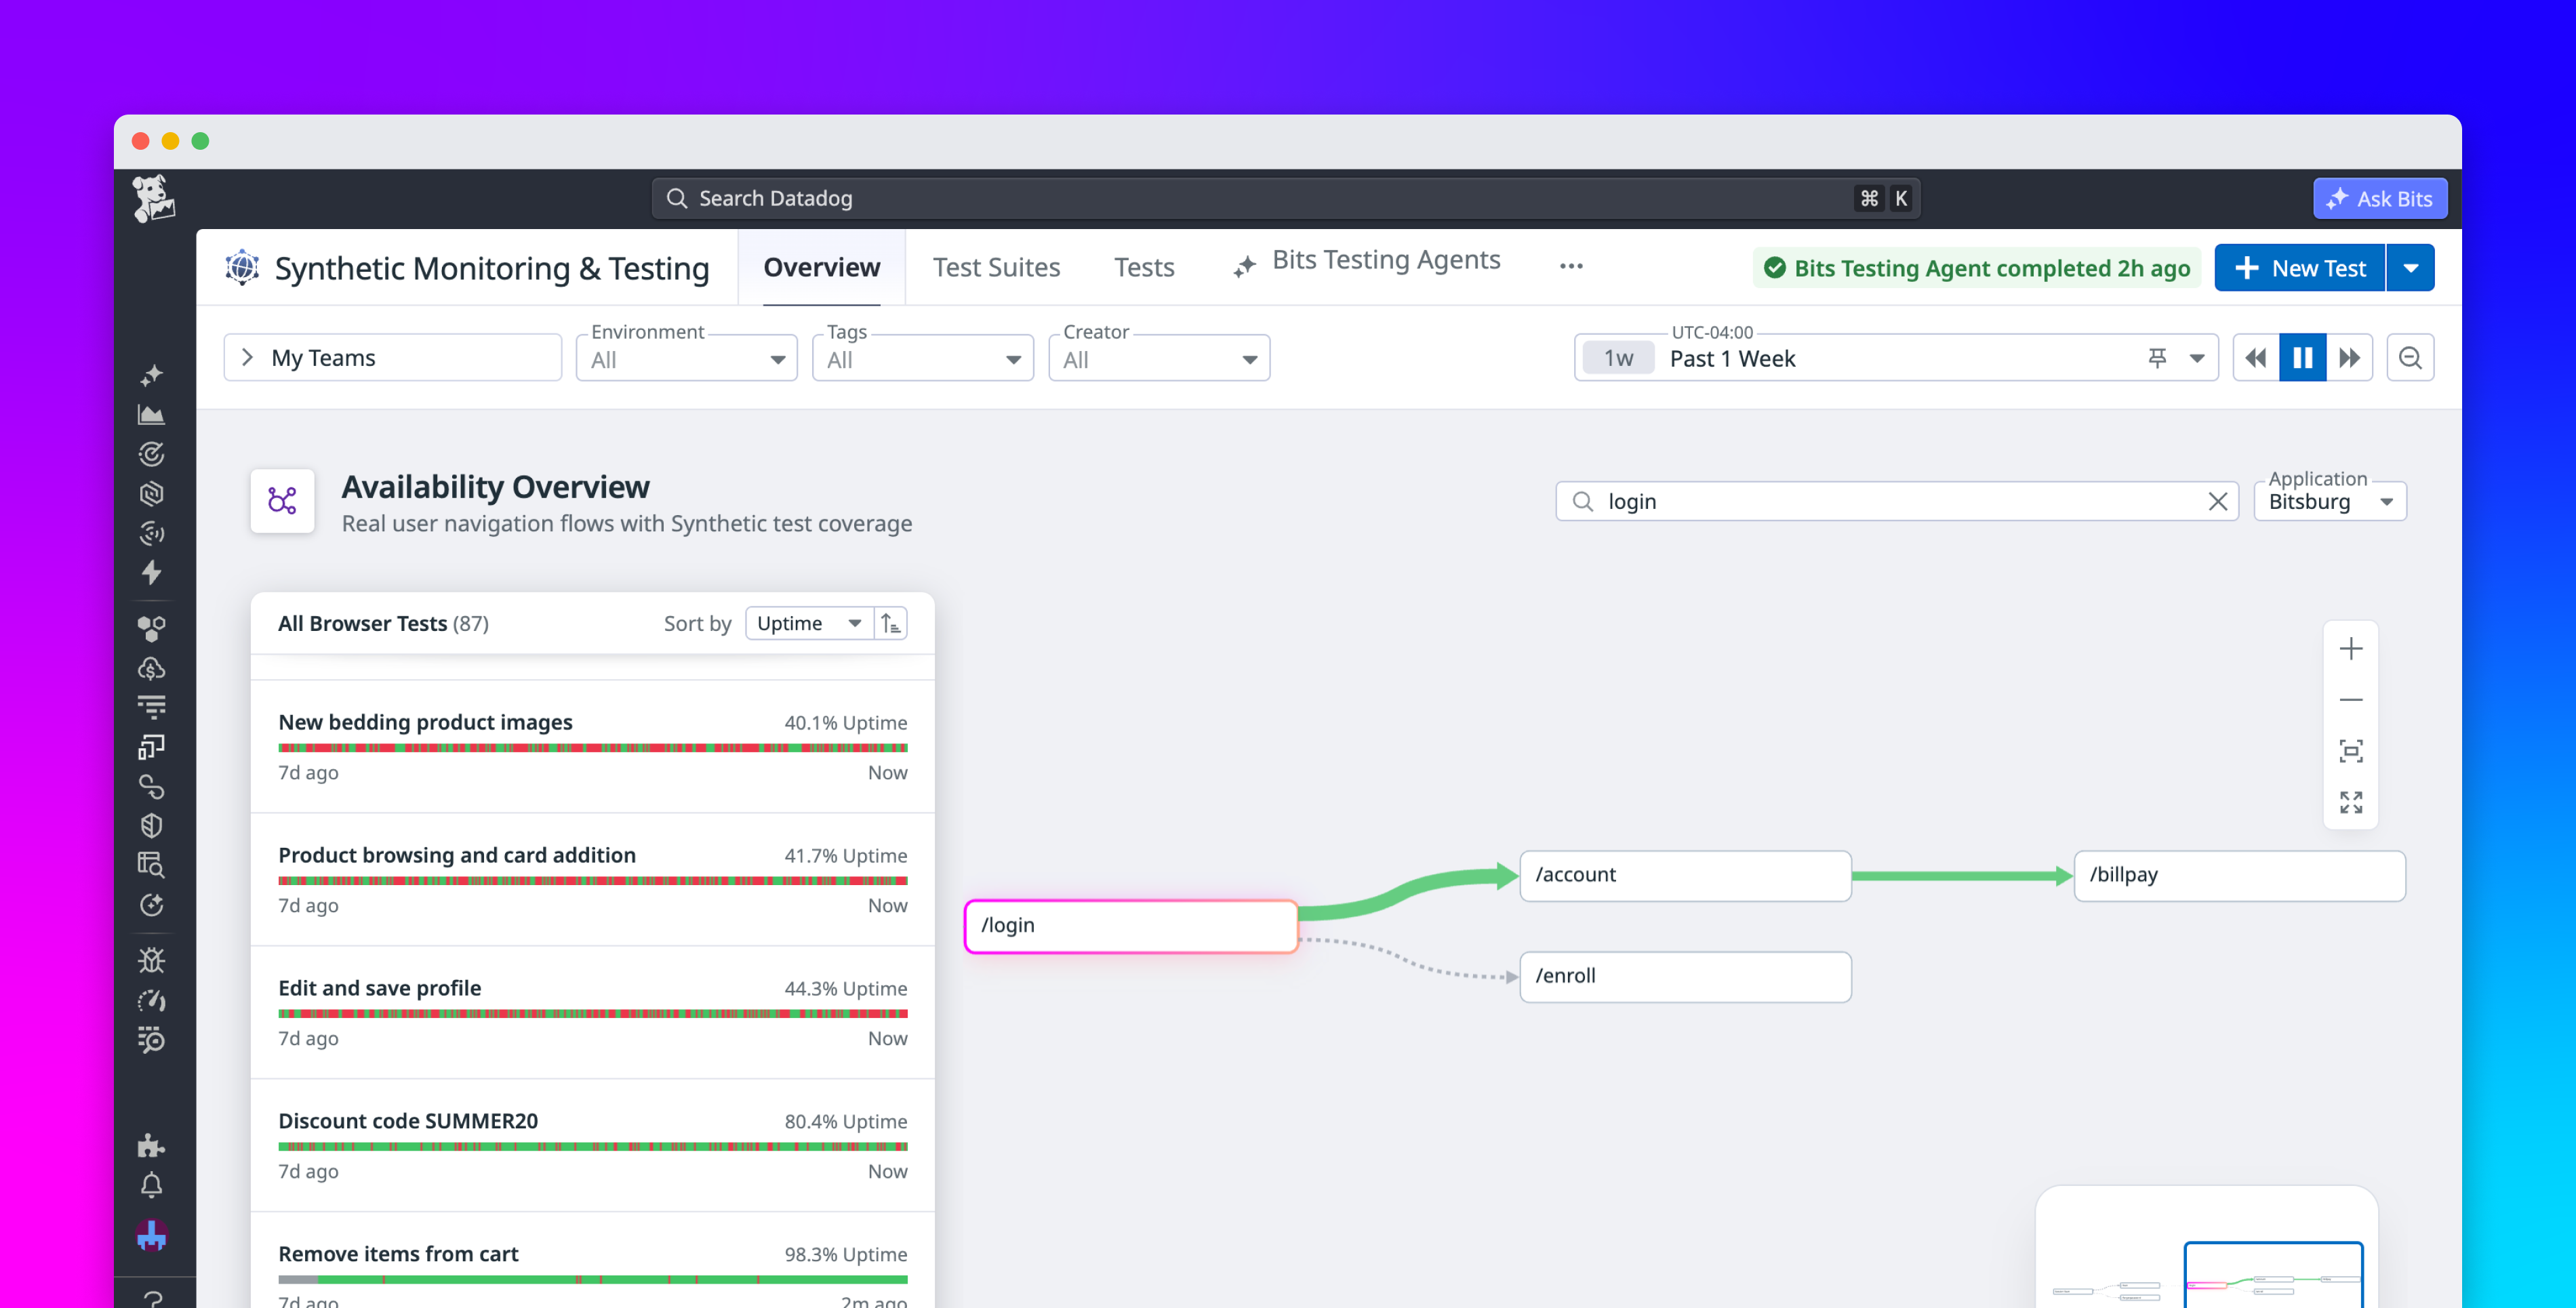
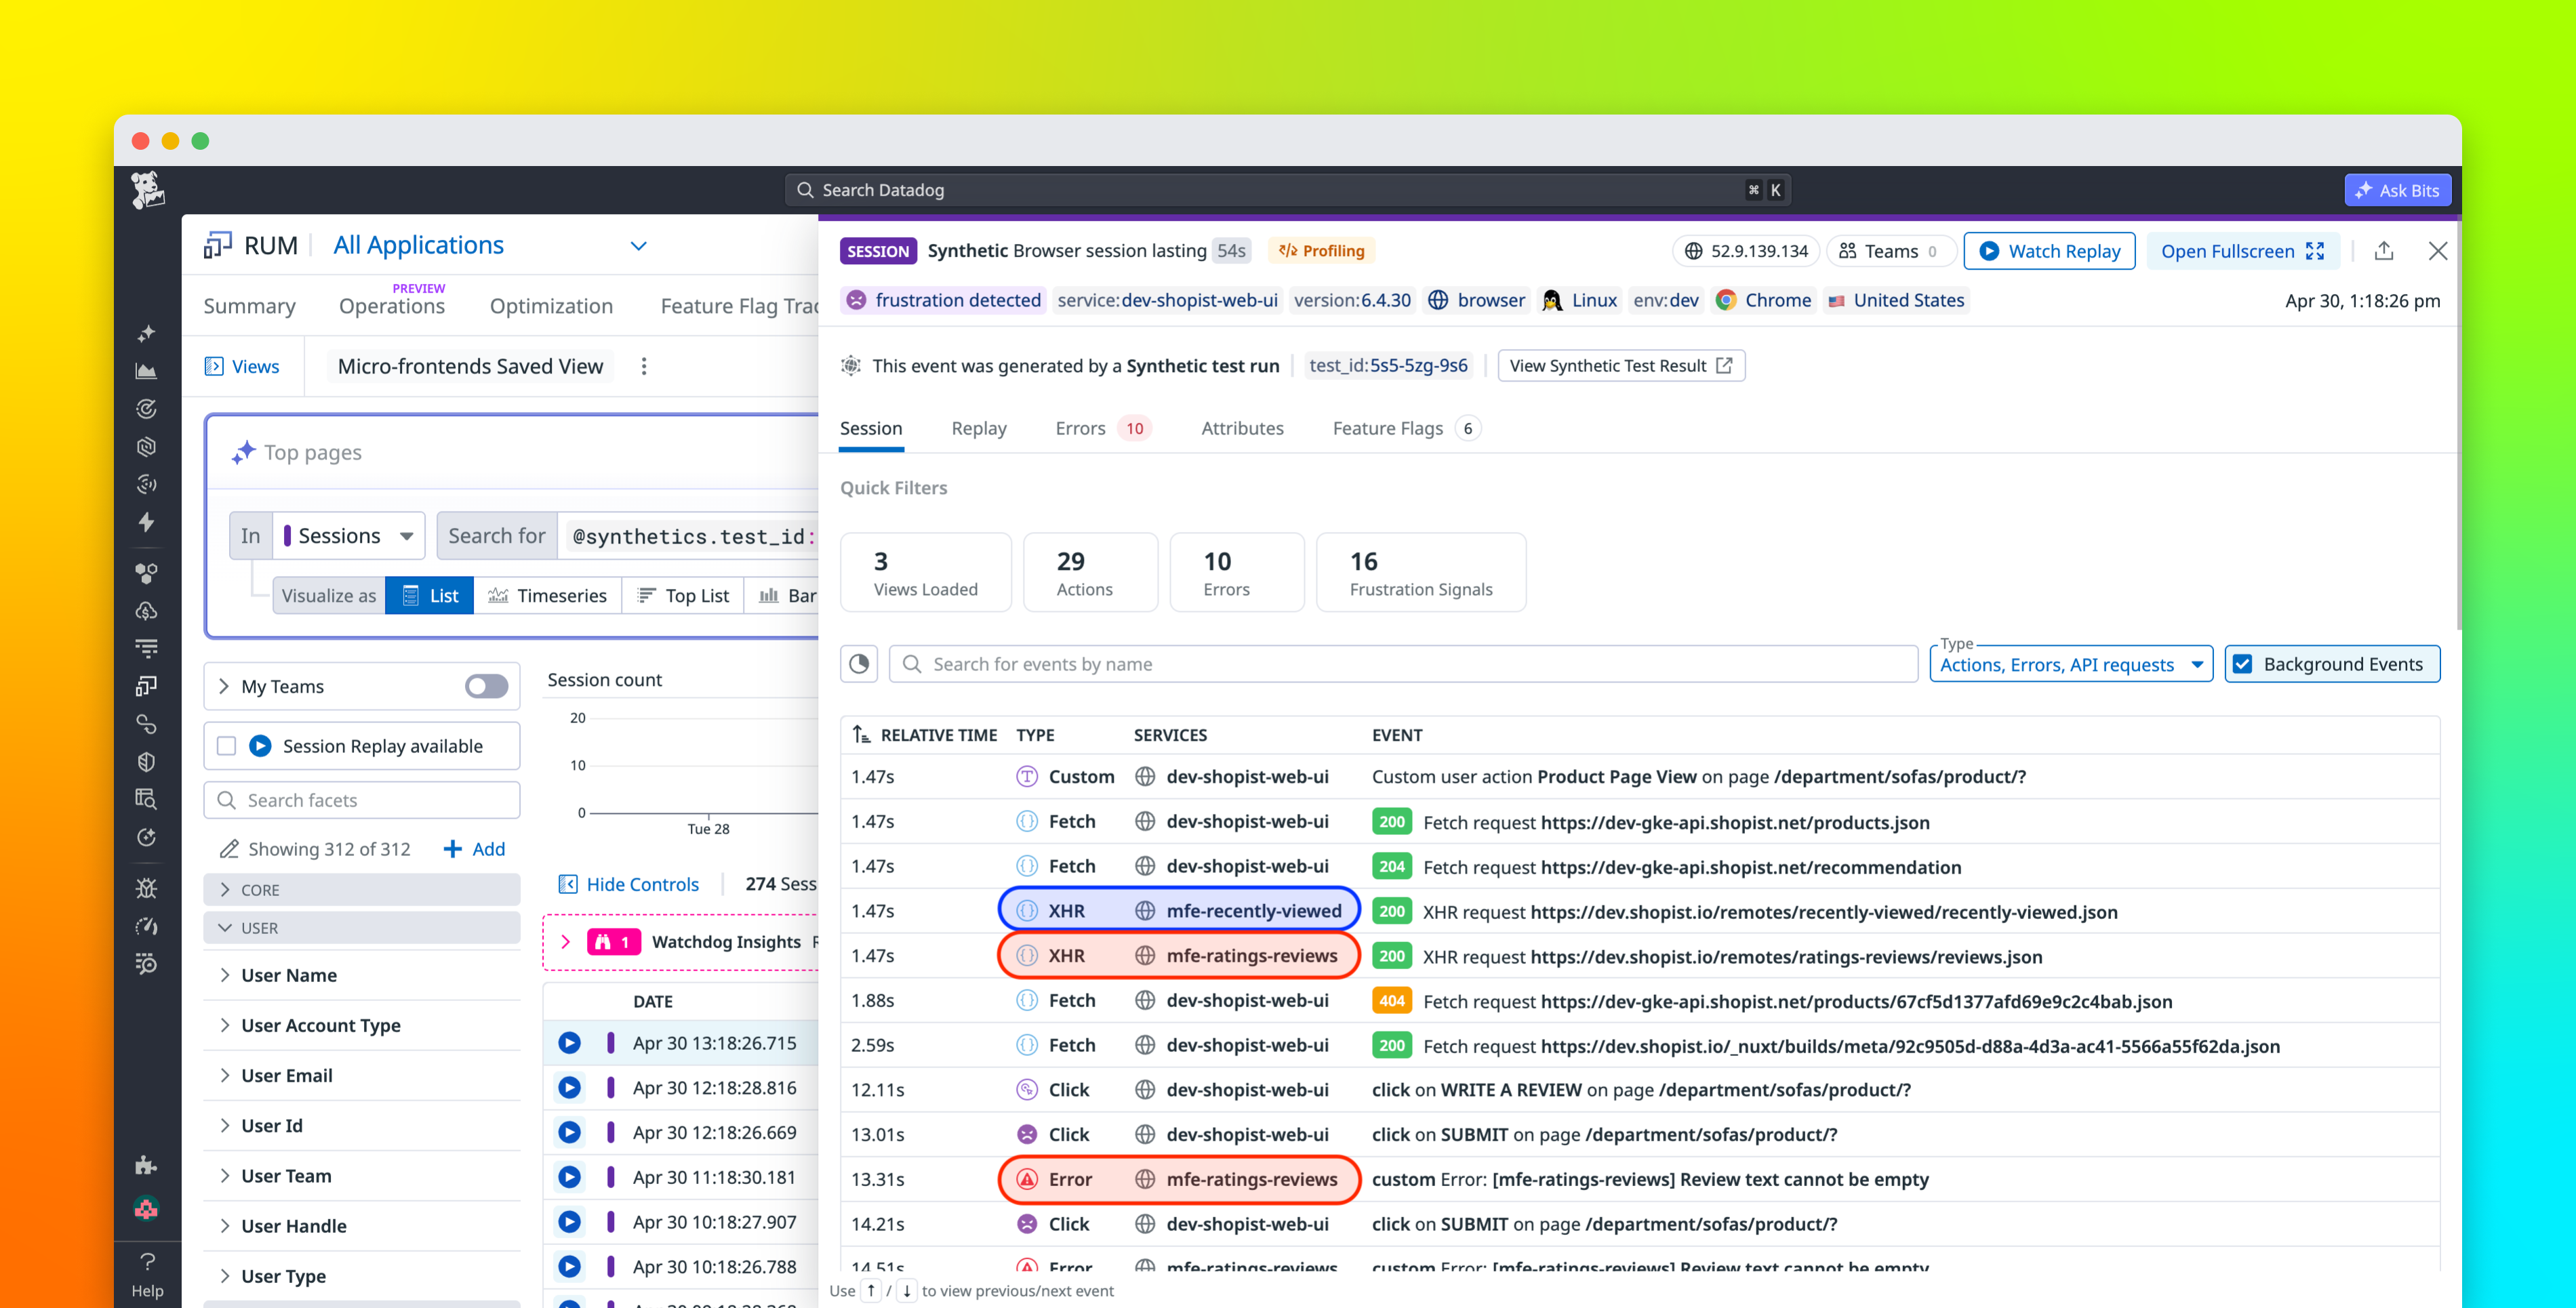
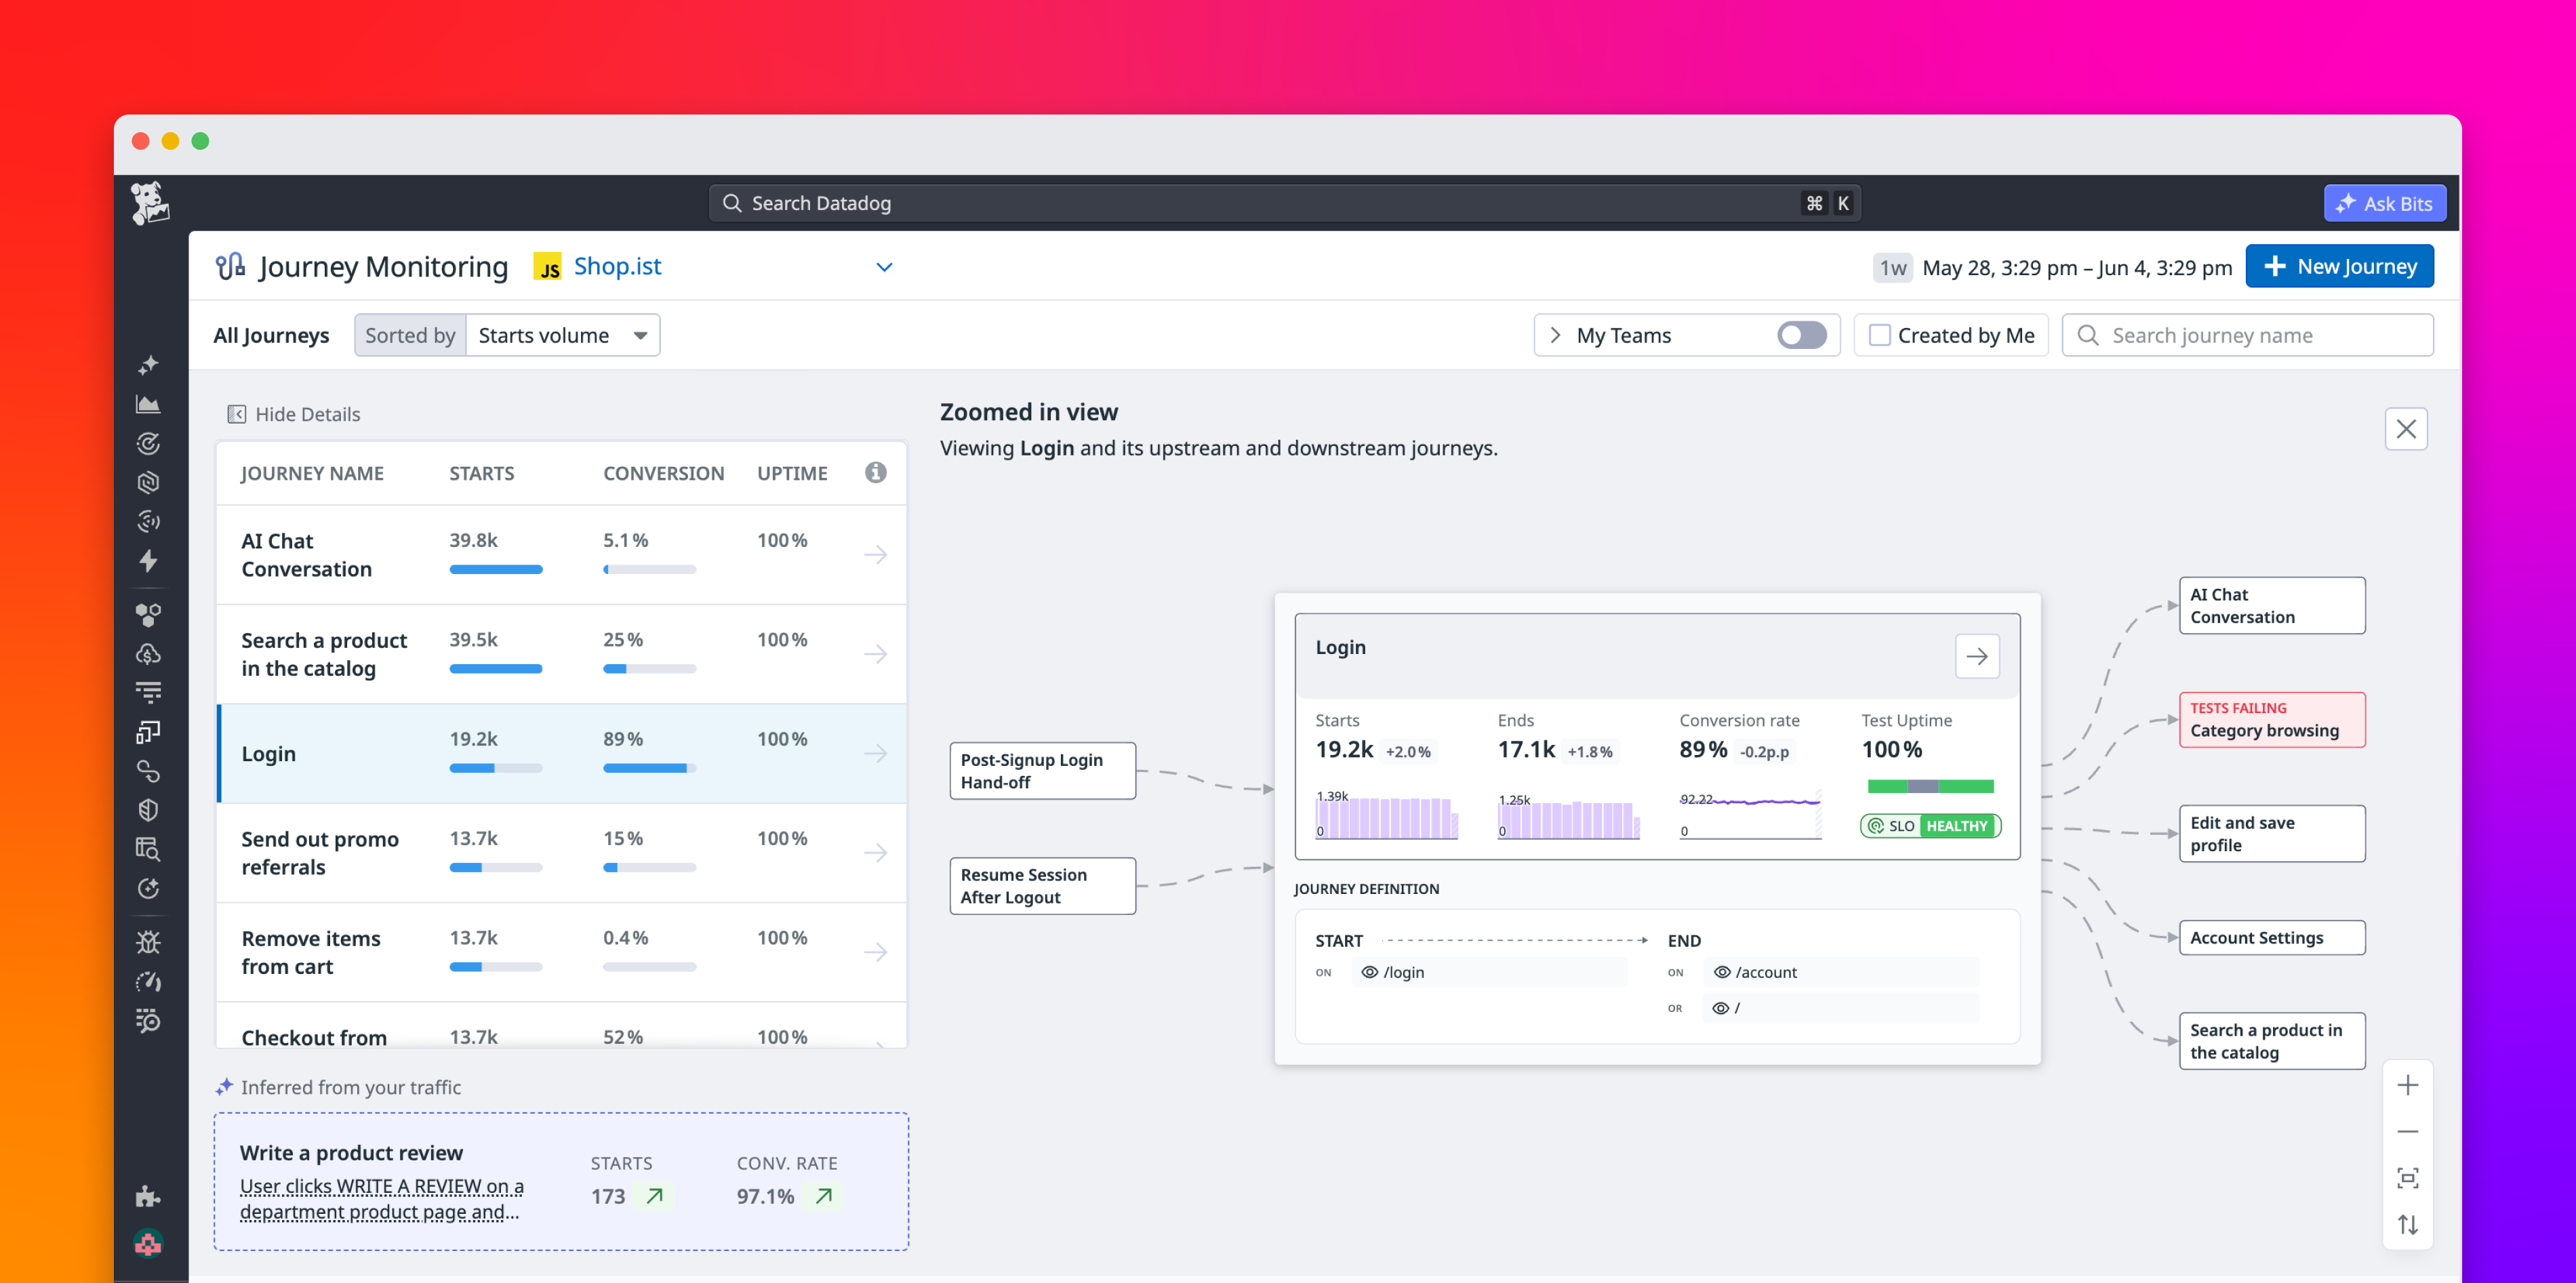
Datadog Journey Monitoring enables teams to monitor critical digital experiences from a single hub. It brings user behavior, technical performance, availability service level objectives (SLOs) from Datadog RUM, and test results from Datadog Synthetic Monitoring together so product, engineering, and reliability teams can evaluate journeys through the same lens. In this post, we’ll show how Journey Monitoring lets you:
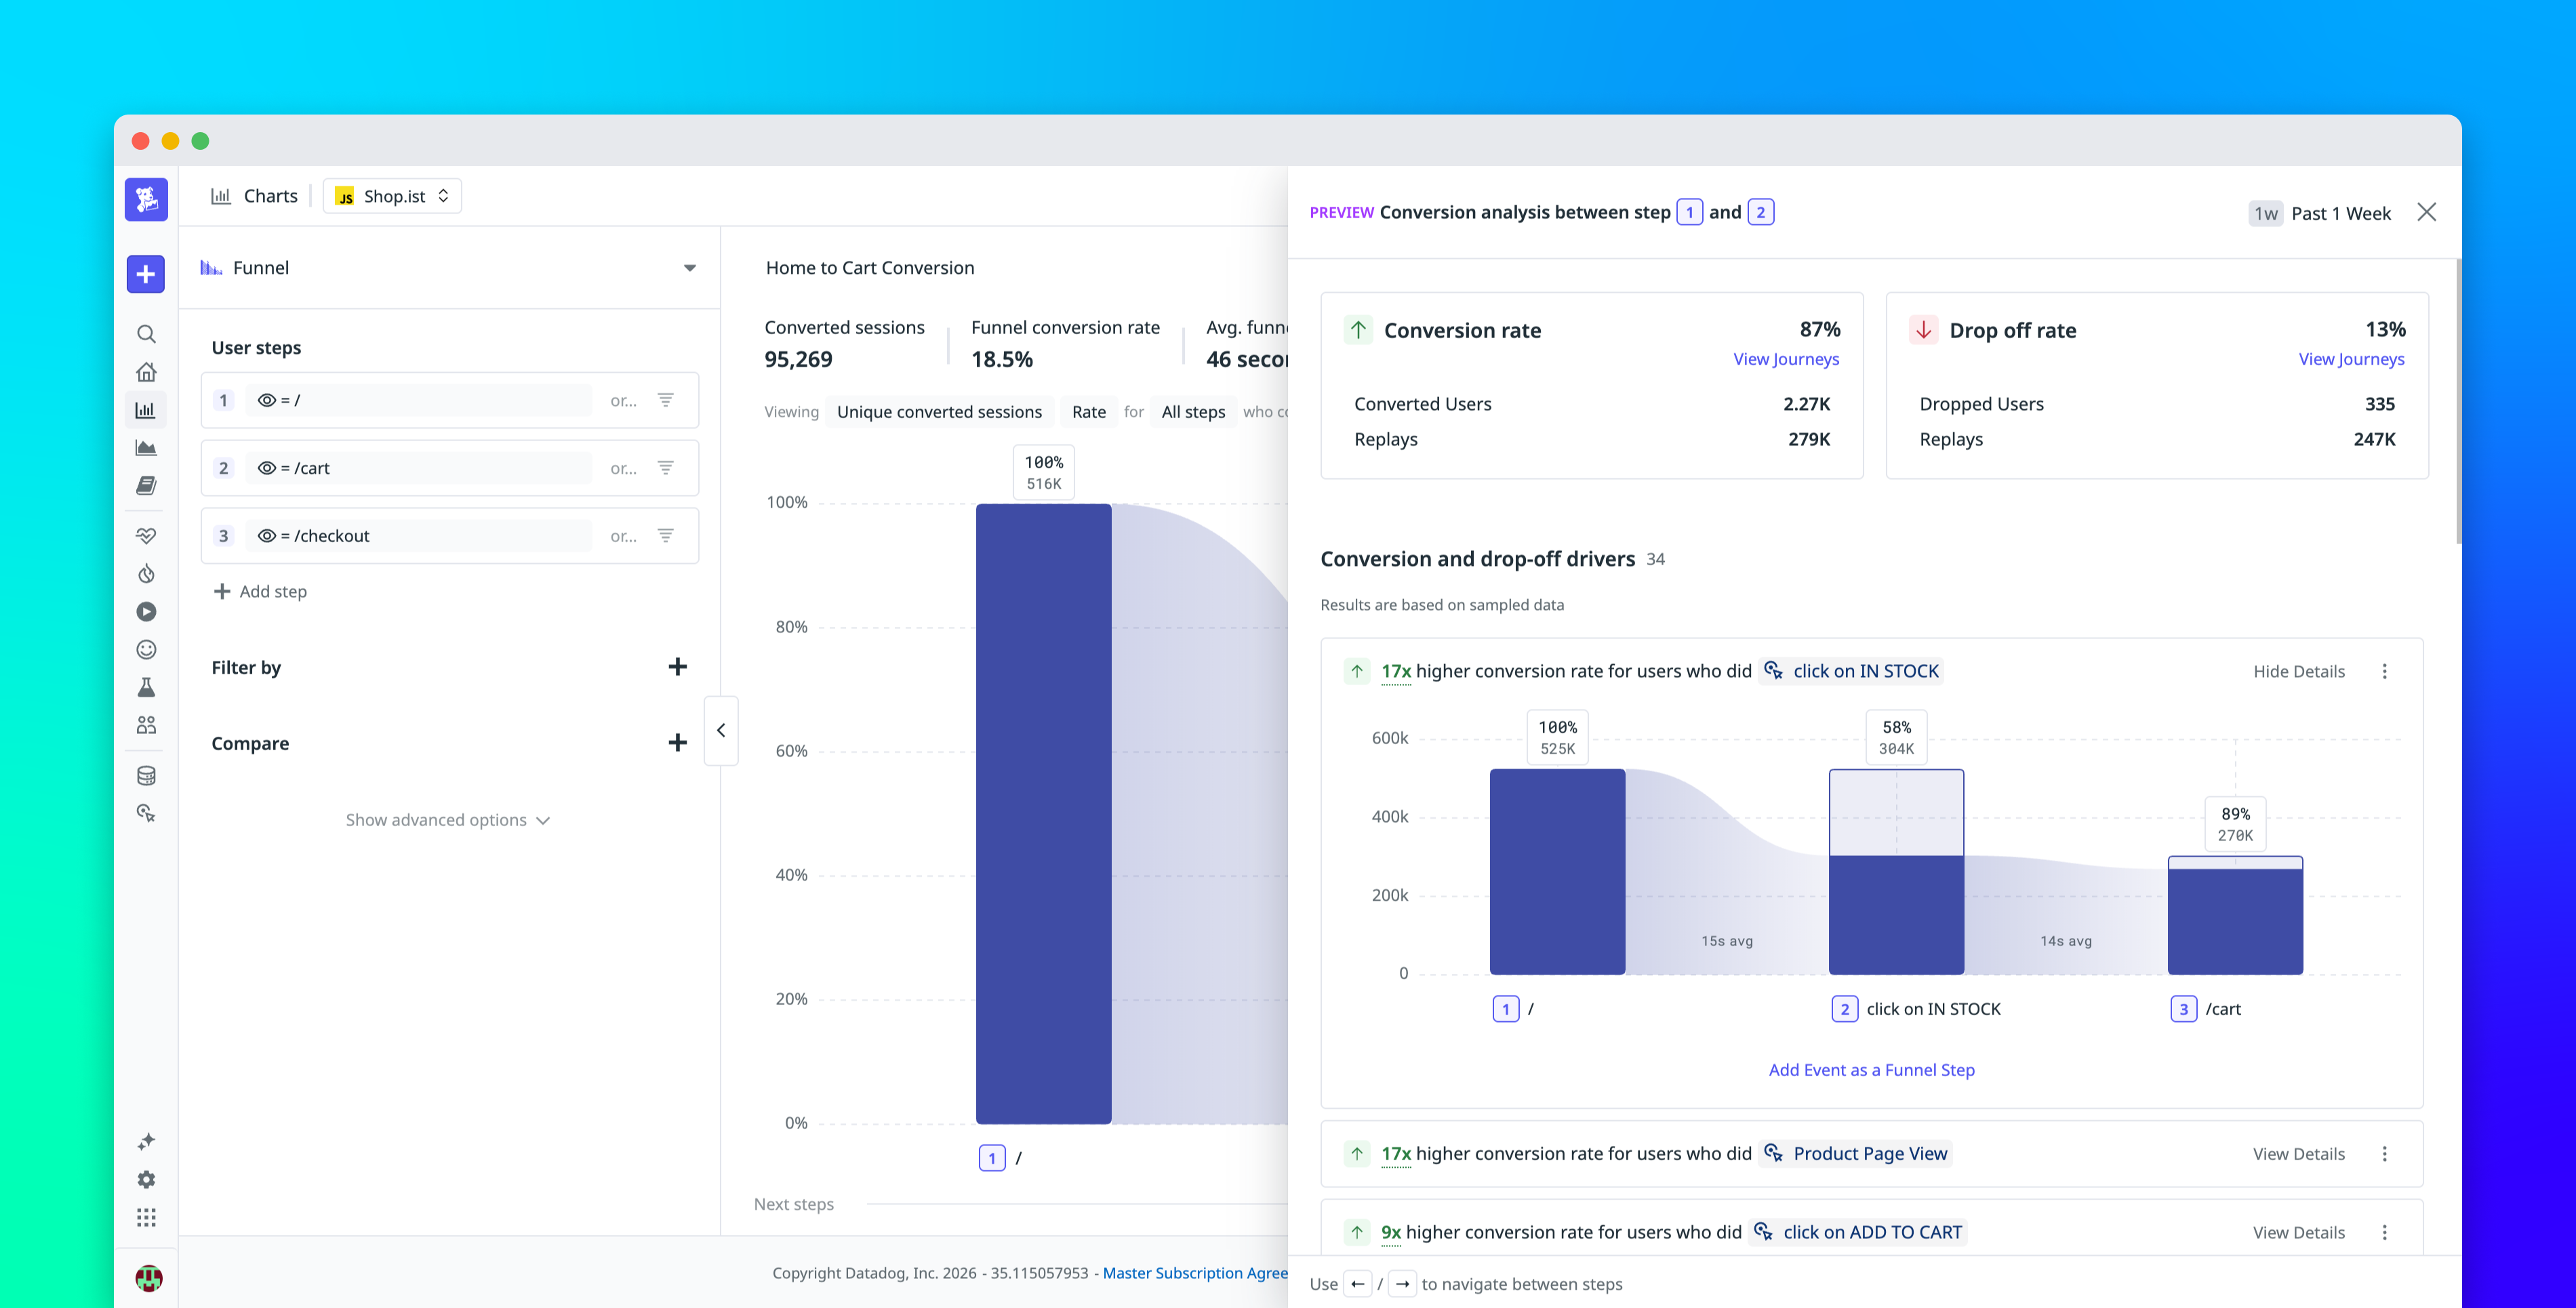
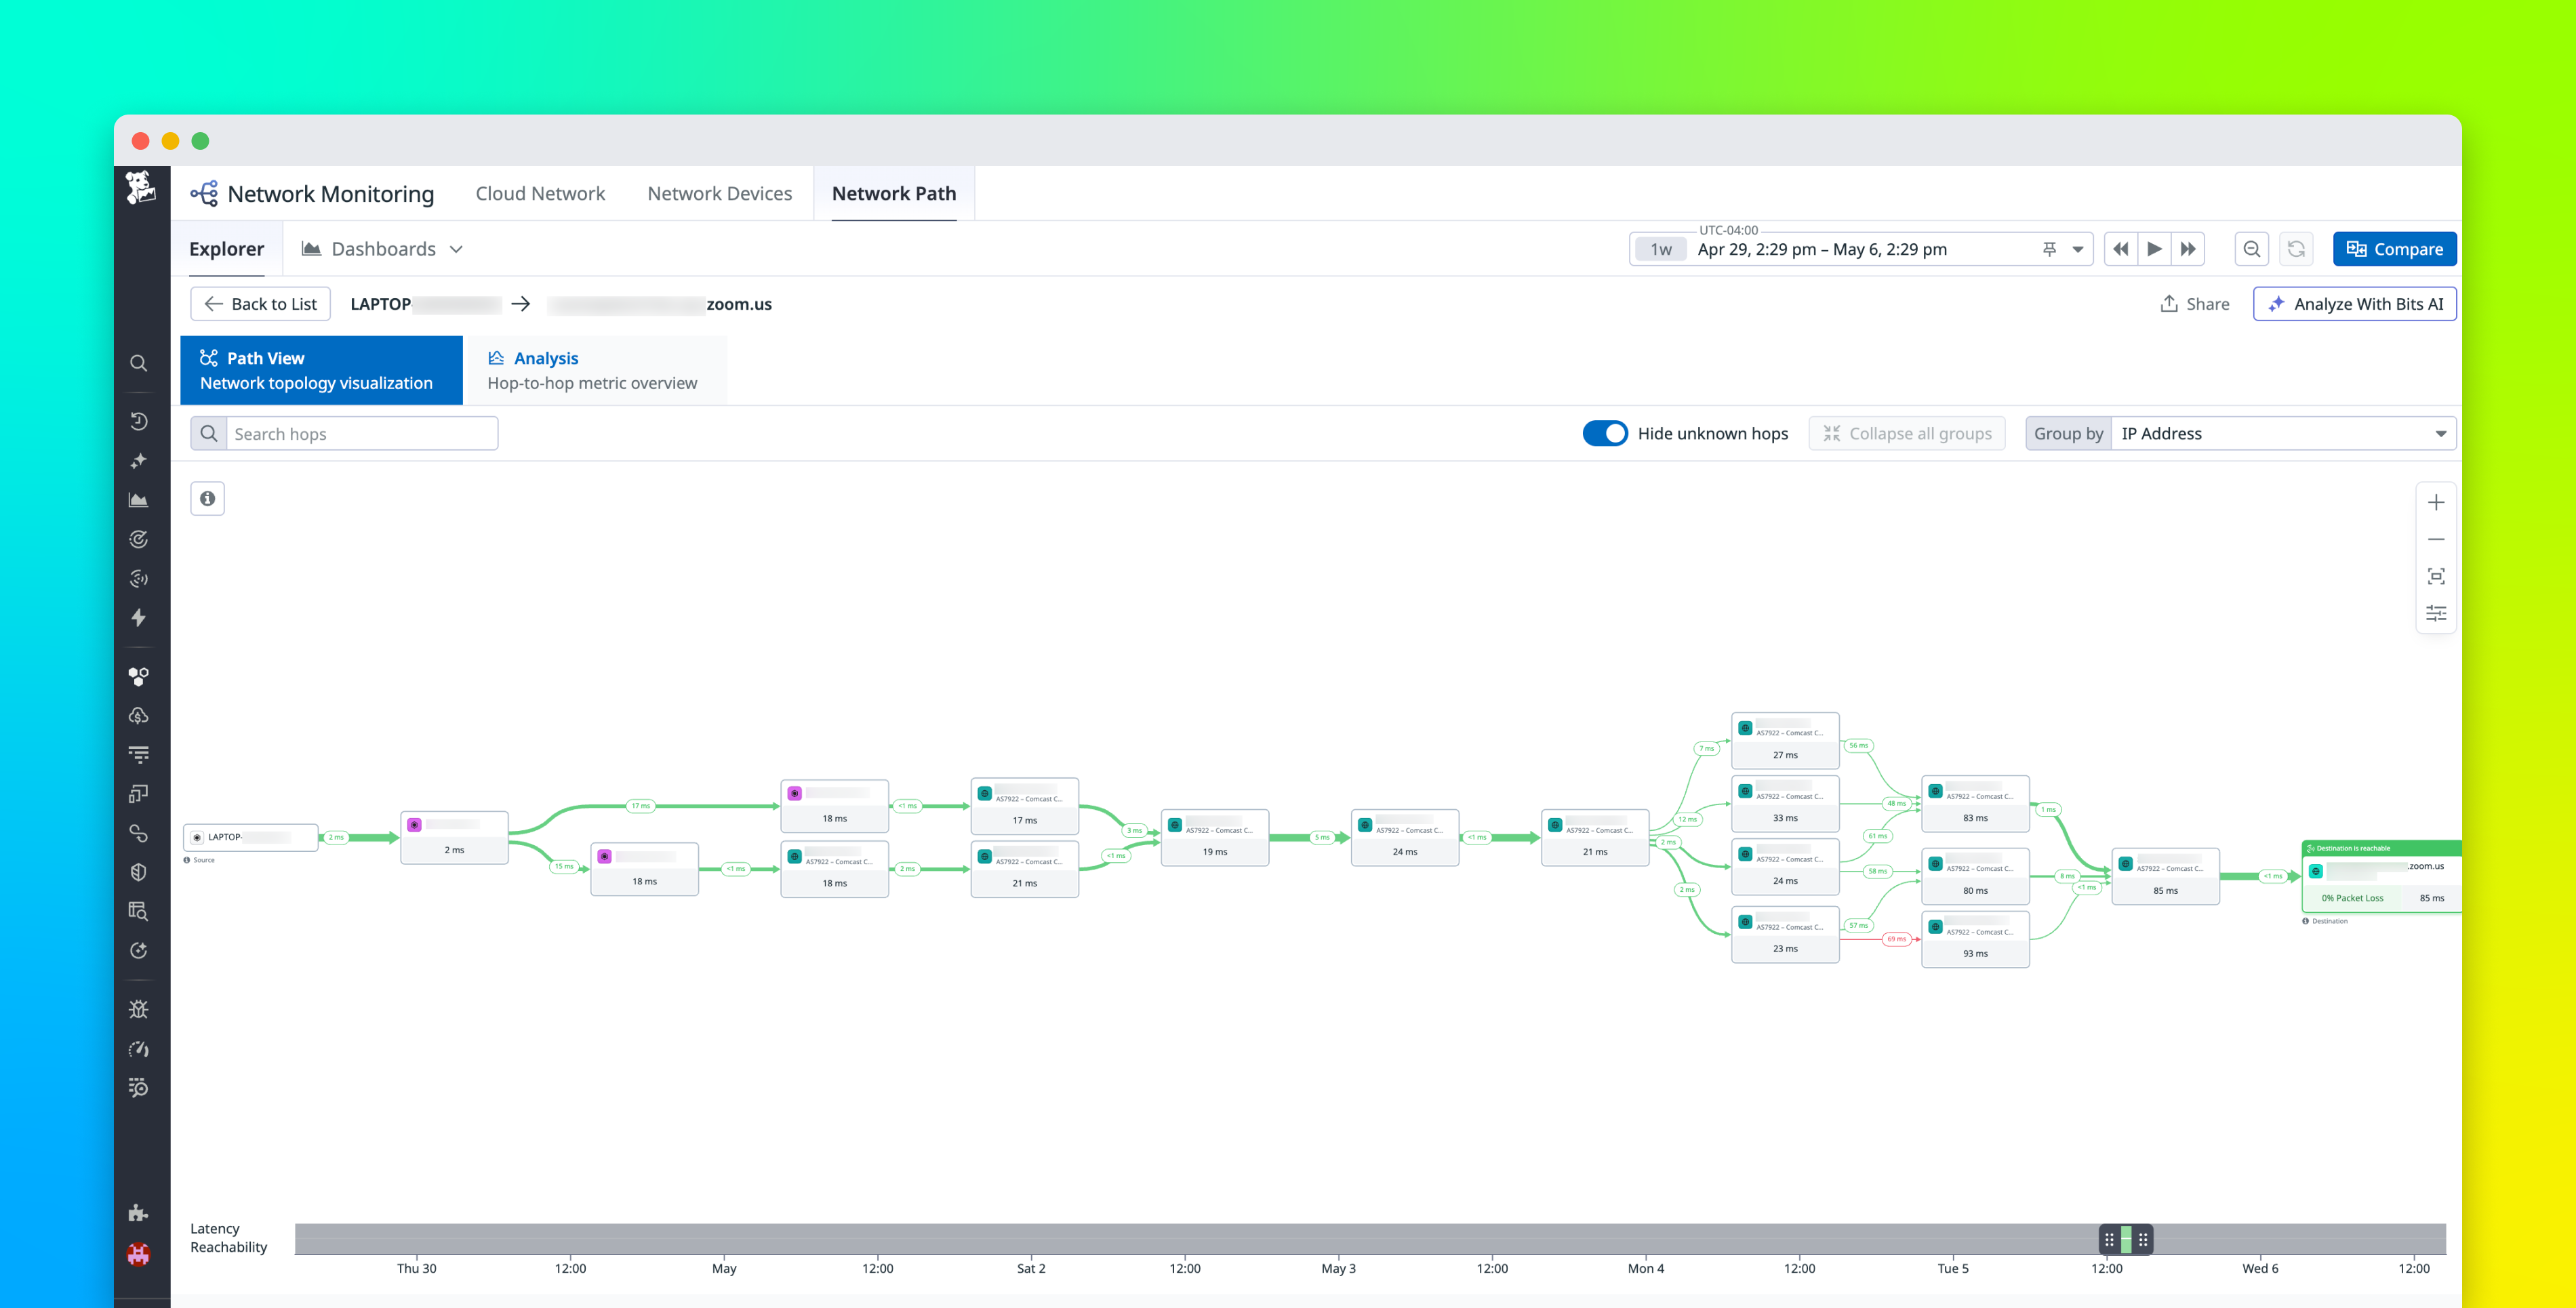
Evaluate behavioral issues with Product Analytics and technical issues with RUM and Synthetics Spot the source of journey issues at a glanceInvestigate root causes without losing journey contextKeep pace with your product as new journeys emerge