For most product teams, funnels are a staple of the analytics toolkit despite a frustrating limitation. You can see which step users are dropping off at, but understanding why requires hours of manual slicing across segments, separate comparison views, and a lot of trial and error before you land on a useful hypothesis. And even when you find something meaningful, taking action typically means jumping to another tool, building a new segment, or filing a request with a data team.
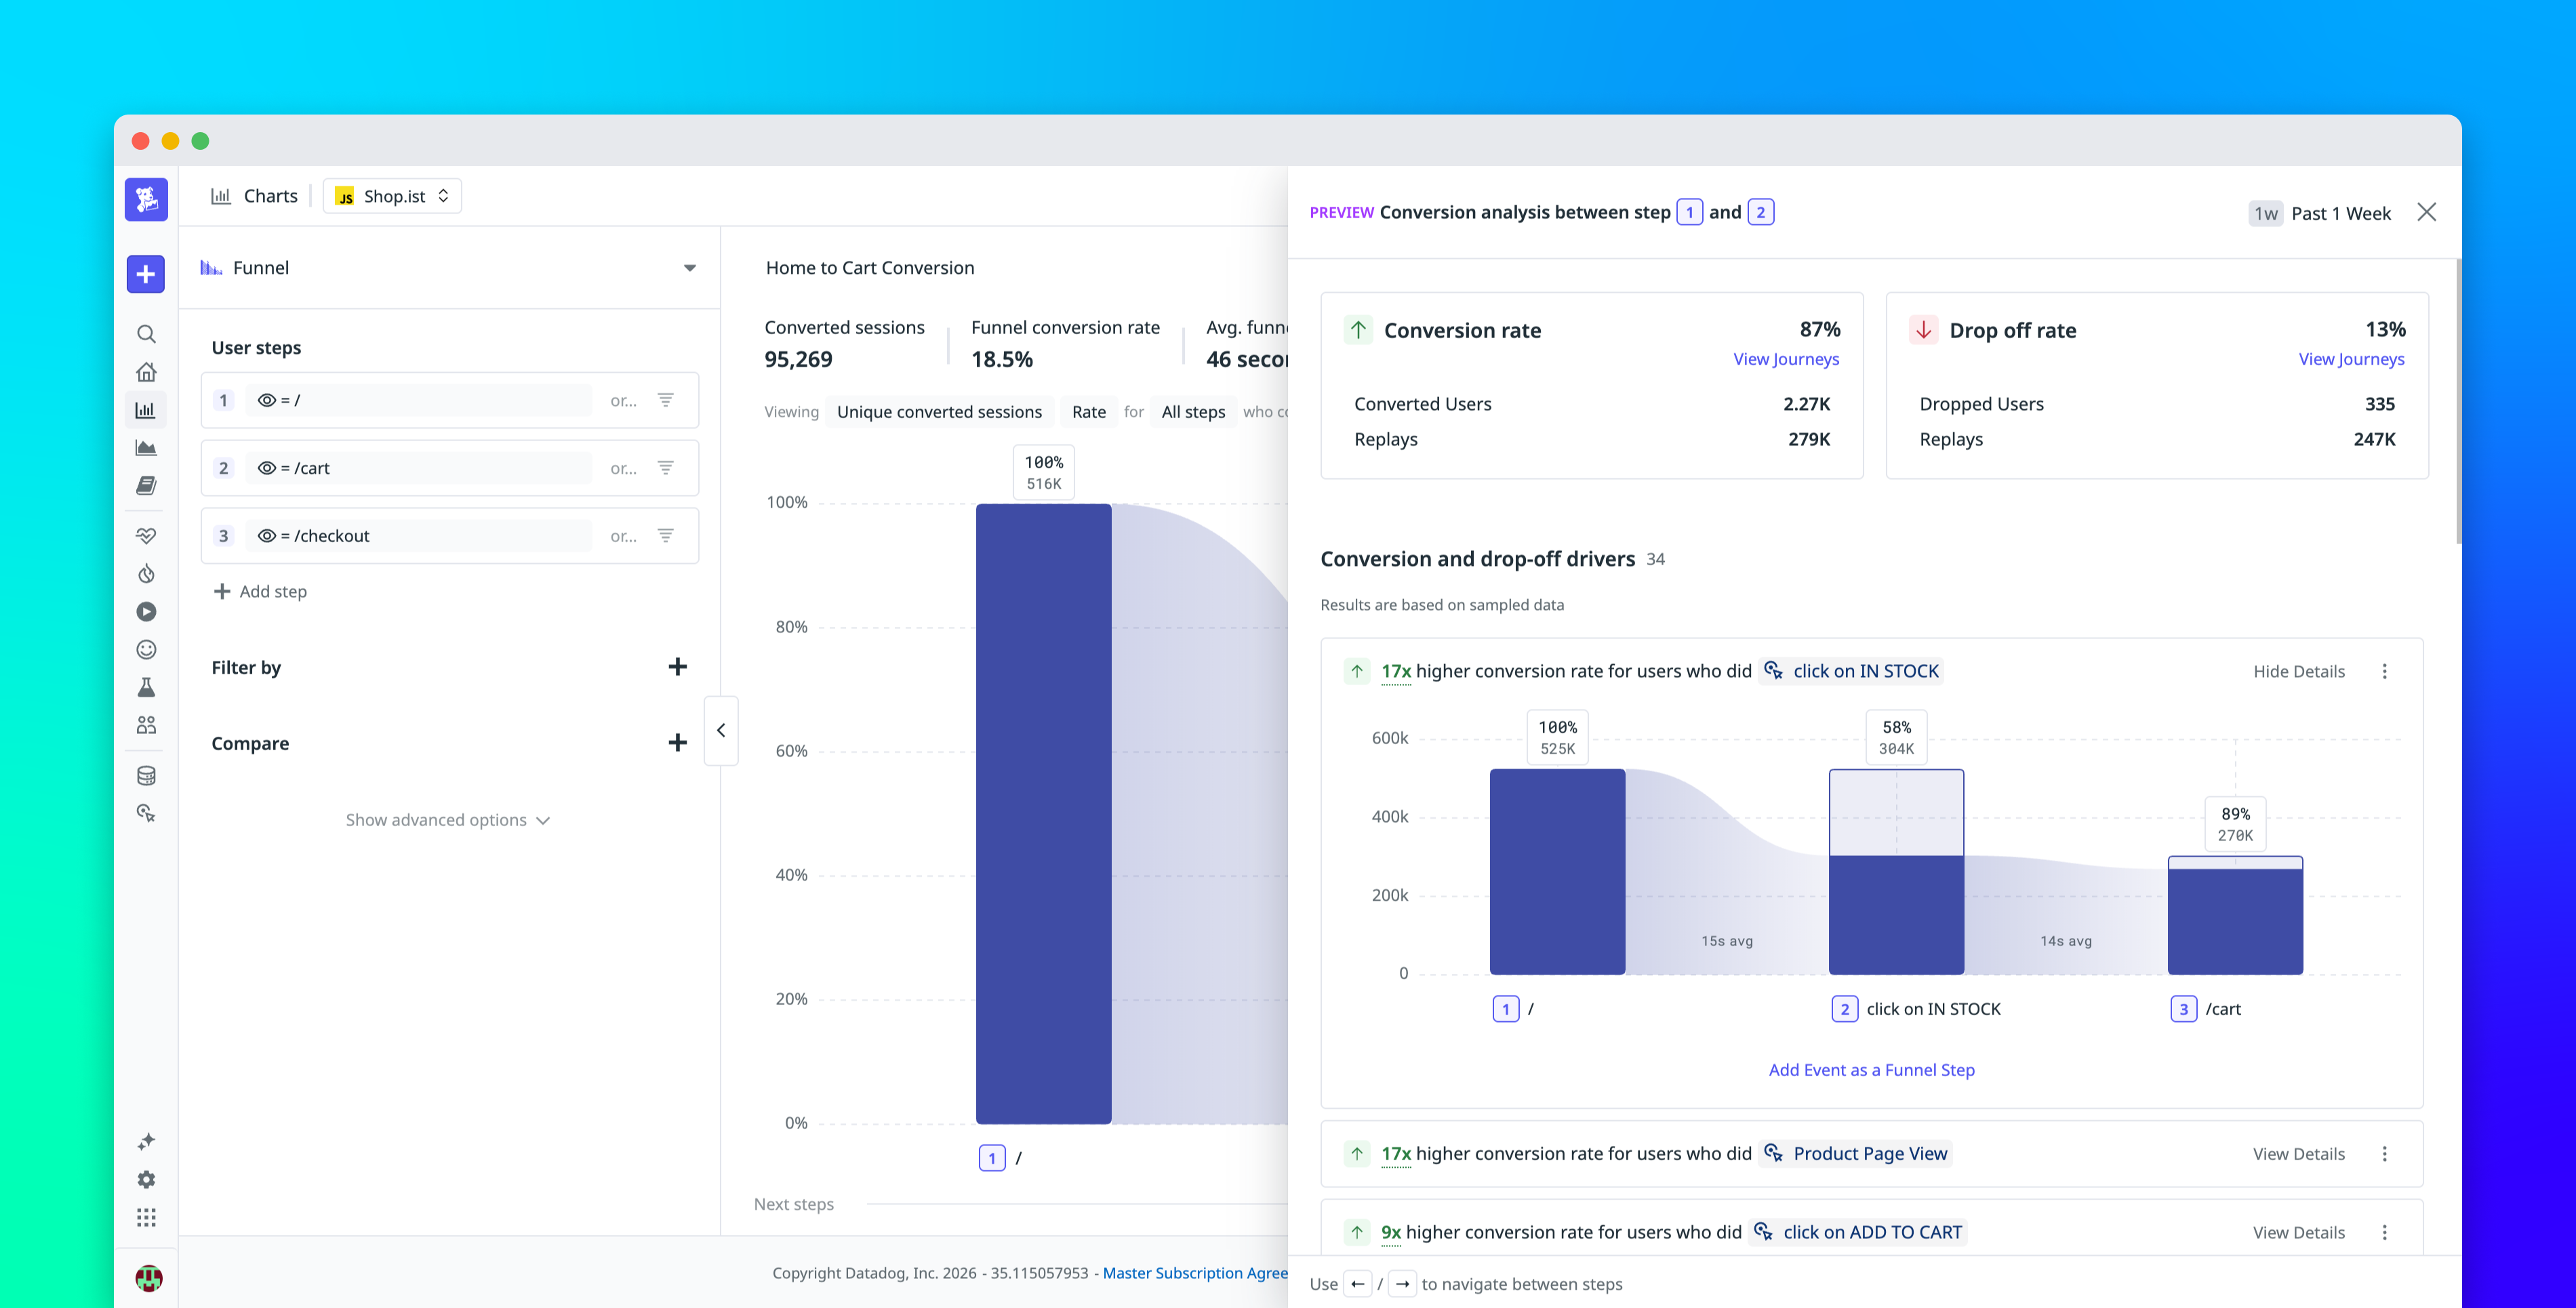
Datadog Product Analytics funnels now close that gap. Our new Conversion Analysis panel uses statistical analysis to automatically surface the user attributes and behaviors most correlated with conversions and drop-offs at any step. Journey Paths visualize where users actually go after they leave your funnel, and side-by-side comparisons let you benchmark across segments or time periods in a single chart. Across these tools, direct shortcuts let you create a segment or launch Session Replay without leaving the funnel view.
In this post, we’ll cover how to:
Surface the drivers behind conversions and drop-offs at any funnel stepExplore where users drop off with Journey PathsBenchmark segments and time periods with side-by-side comparisons