When users report slow applications or poor video call quality, IT and network teams often can’t tell where the issue originates. Without a way to trace network paths across device, network, and application layers, teams are left switching between separate tools to correlate telemetry.
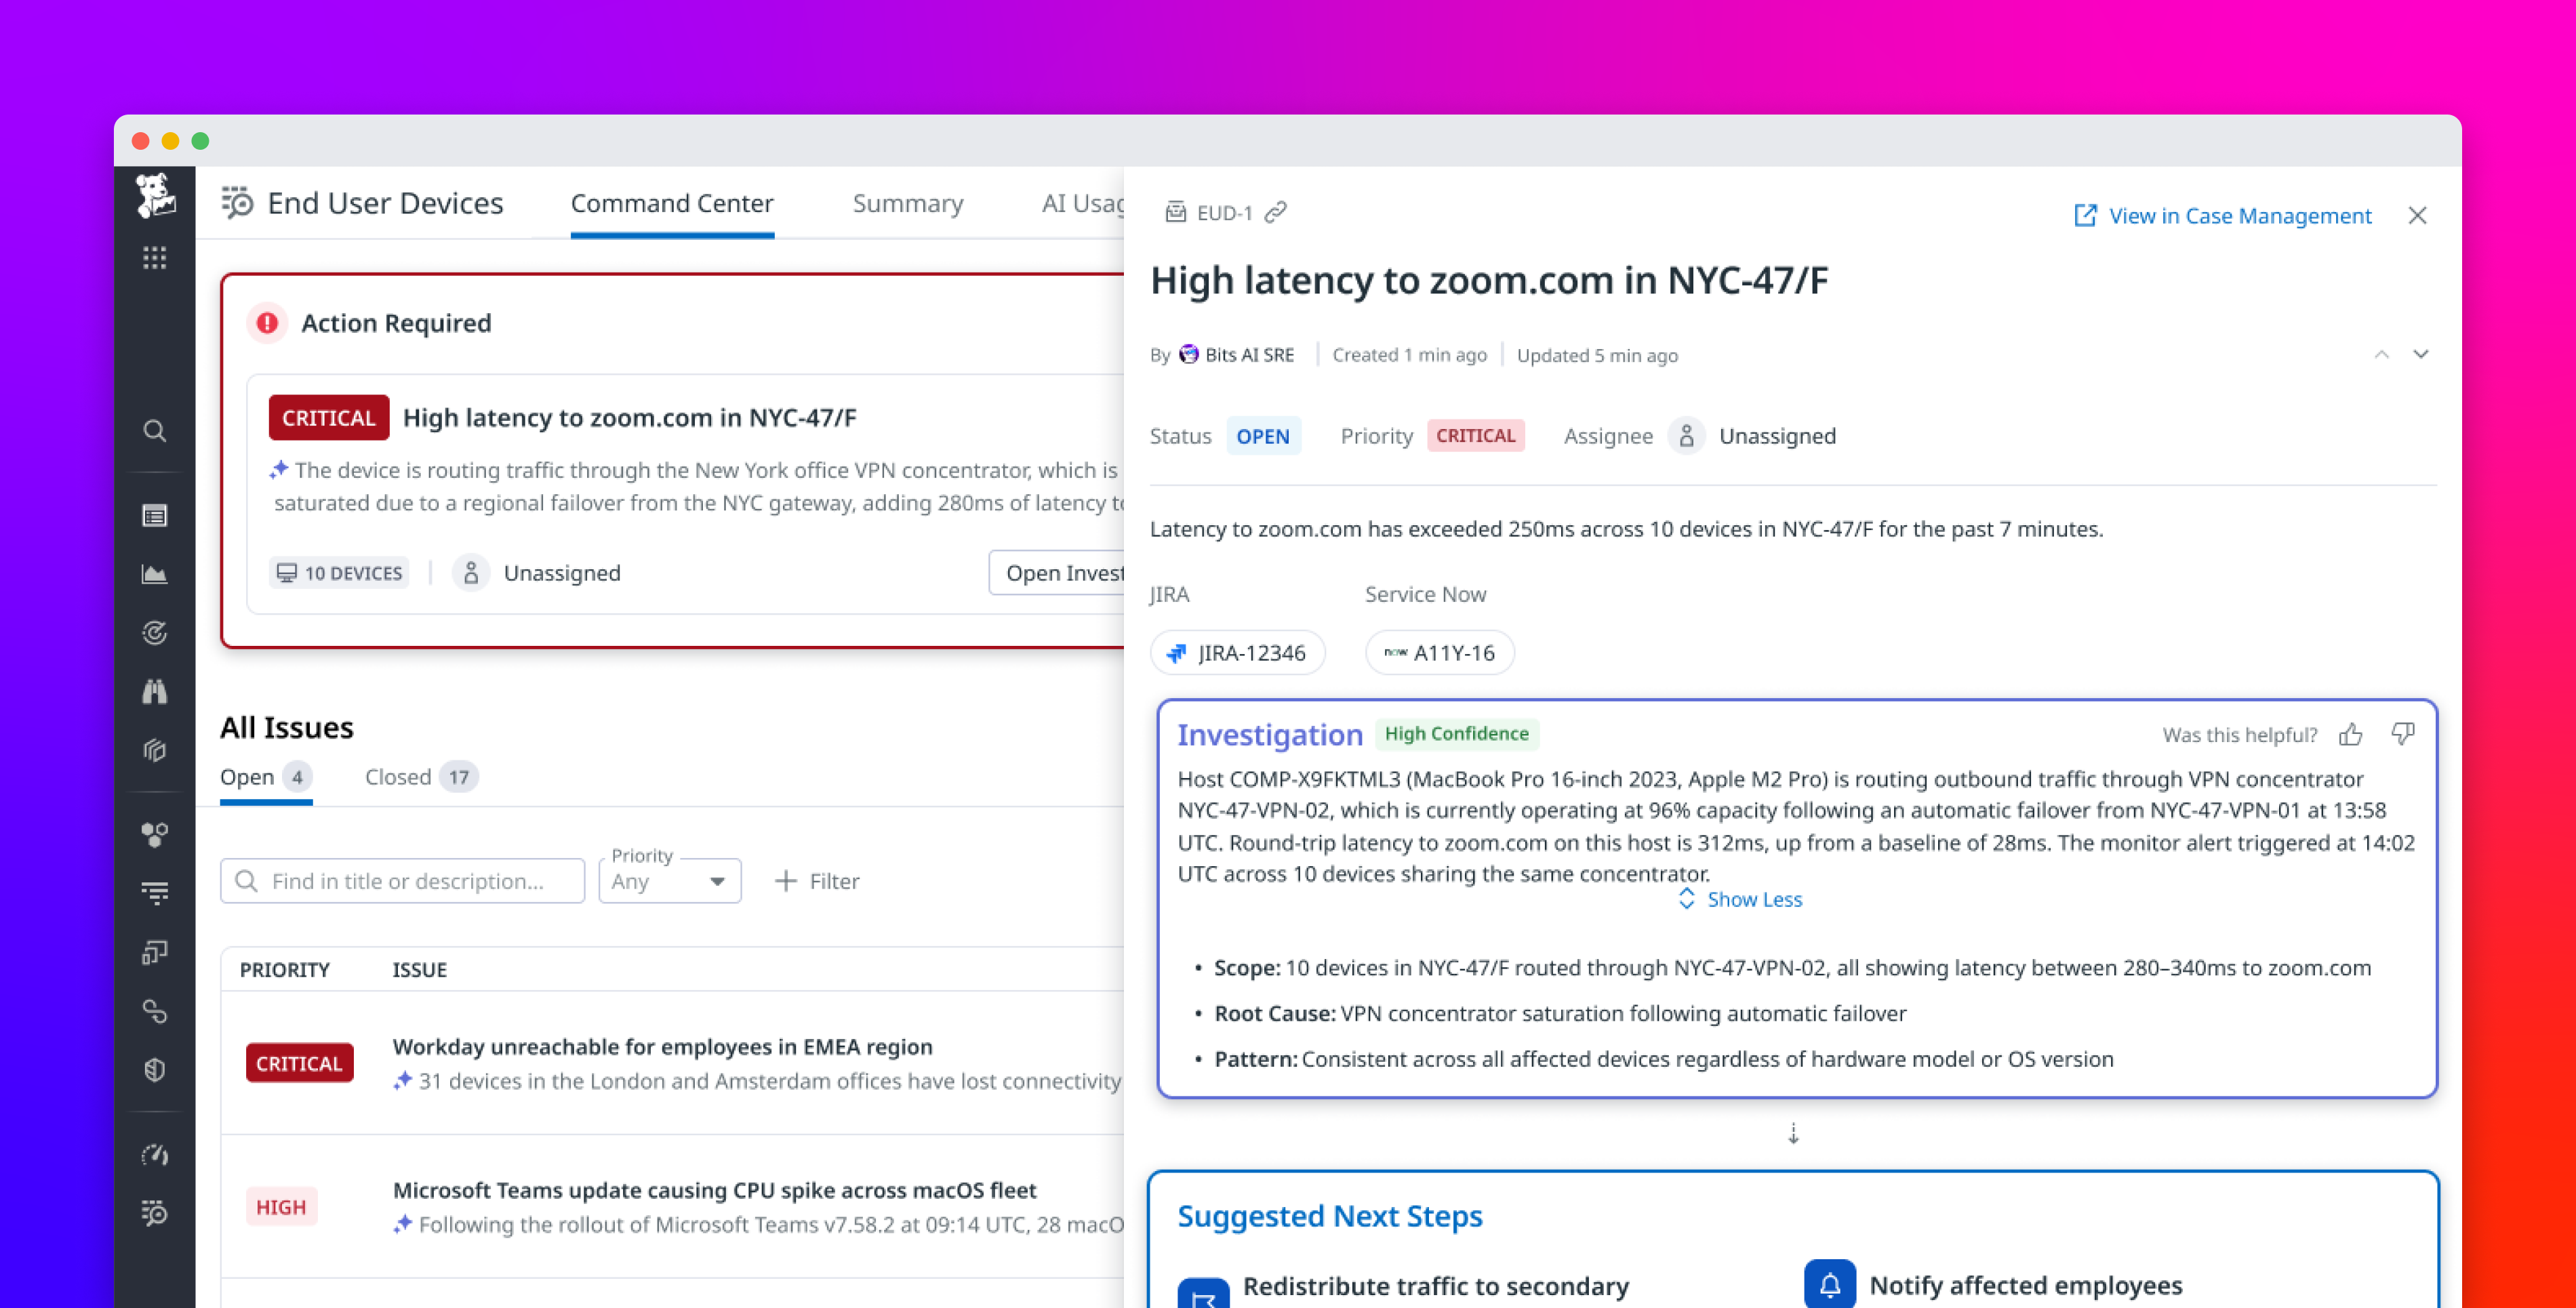
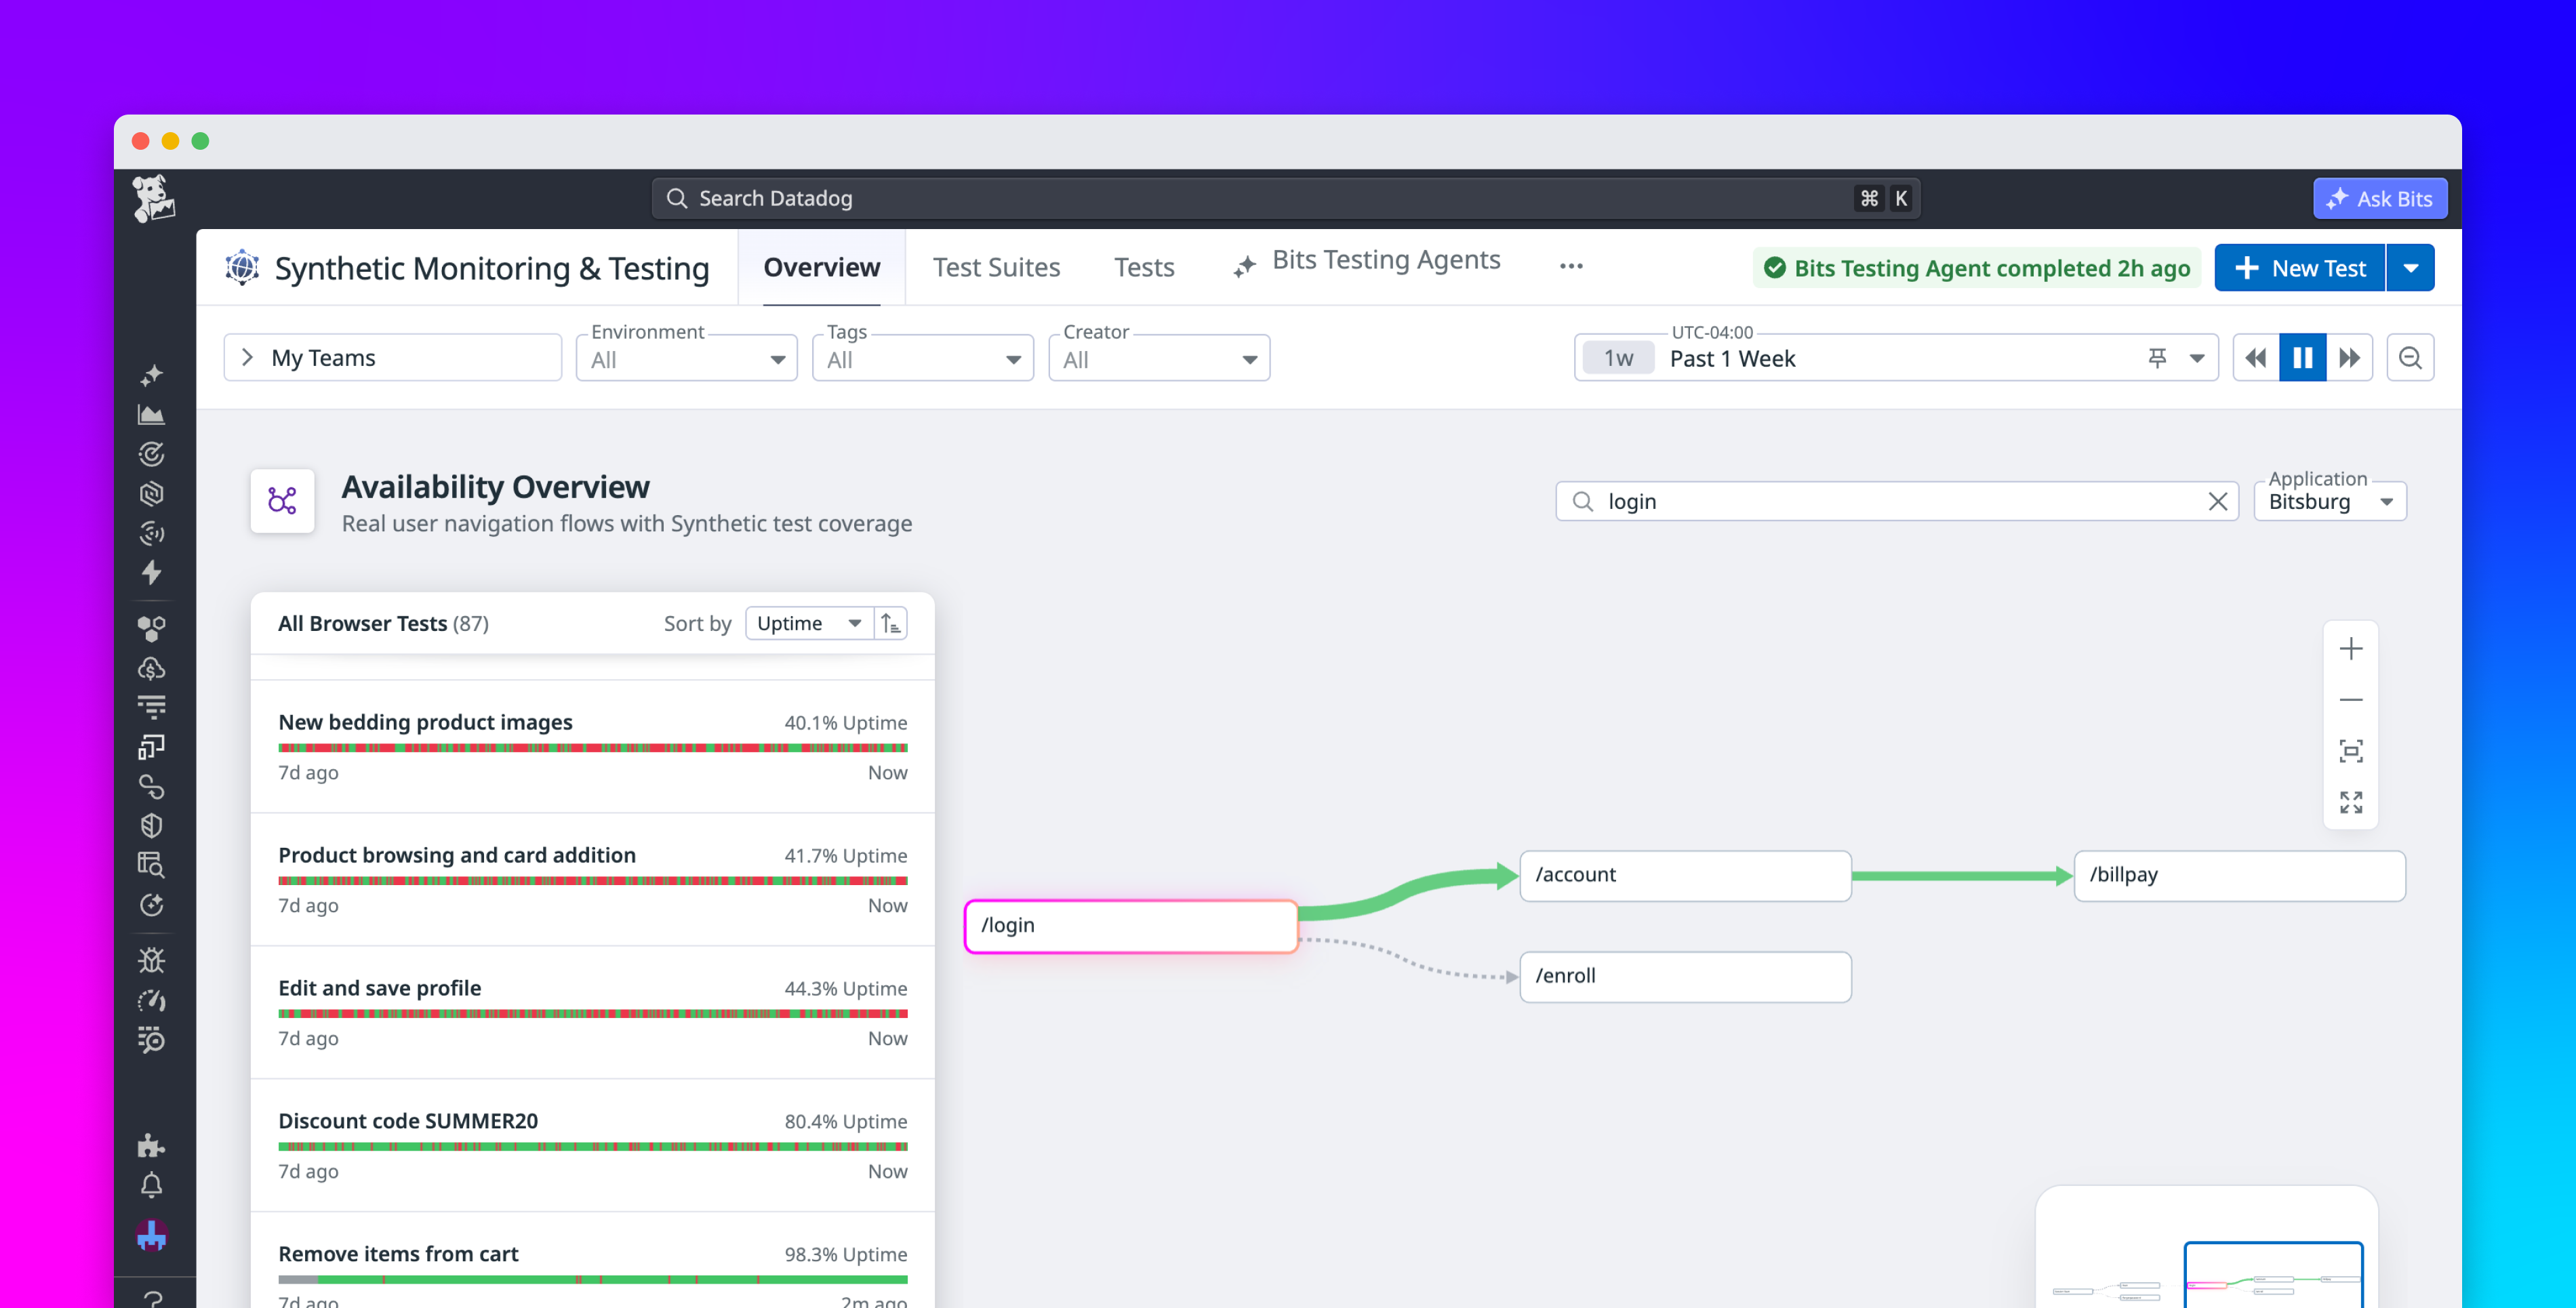
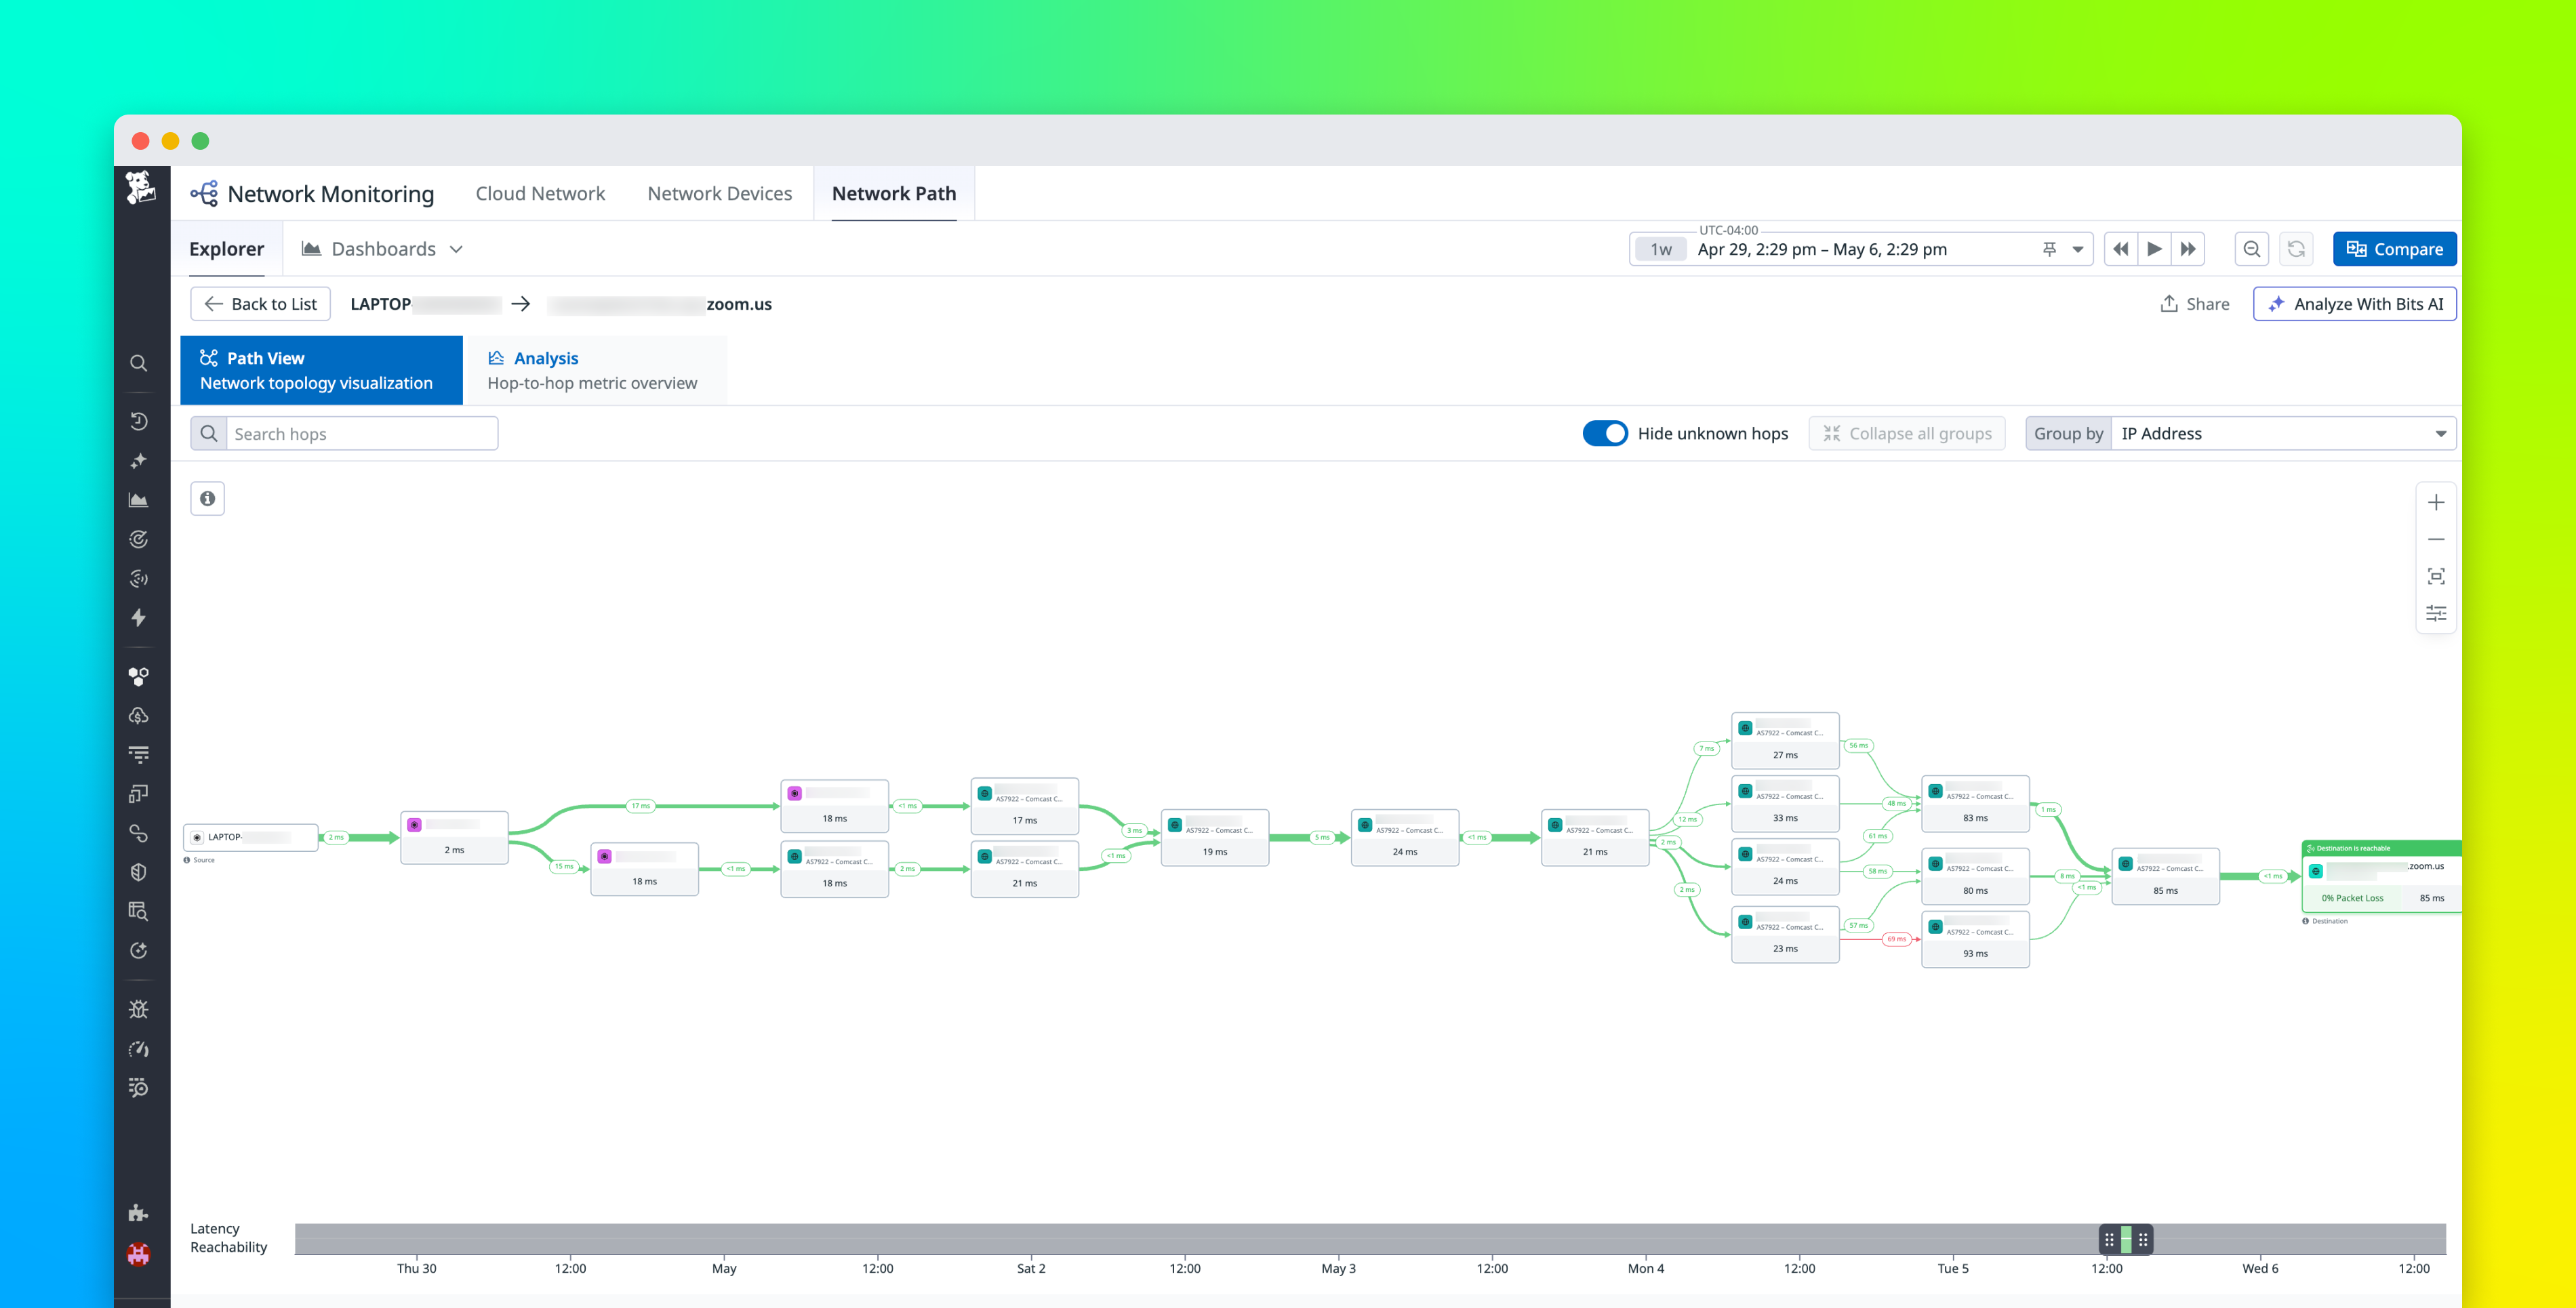
By combining Datadog End User Device Monitoring, now available in Preview, with Datadog Network Path, IT admins and network engineers can trace the full network path from an end user’s device, such as a laptop or desktop, to a SaaS application. You can visualize traffic flow hop by hop, including per-hop latency and packet loss. Network Path helps identify where slowdowns occur so you can compare behavior across devices and time windows, and perform more precise root cause analysis.
In this post, we’ll show how you can:
Visualize each network hop from device to SaaS applicationPinpoint where slowdowns occur hop by hopCompare paths across devices and time periodsStart network path analysis directly from a user’s device
Visualize each network hop from device to SaaS application