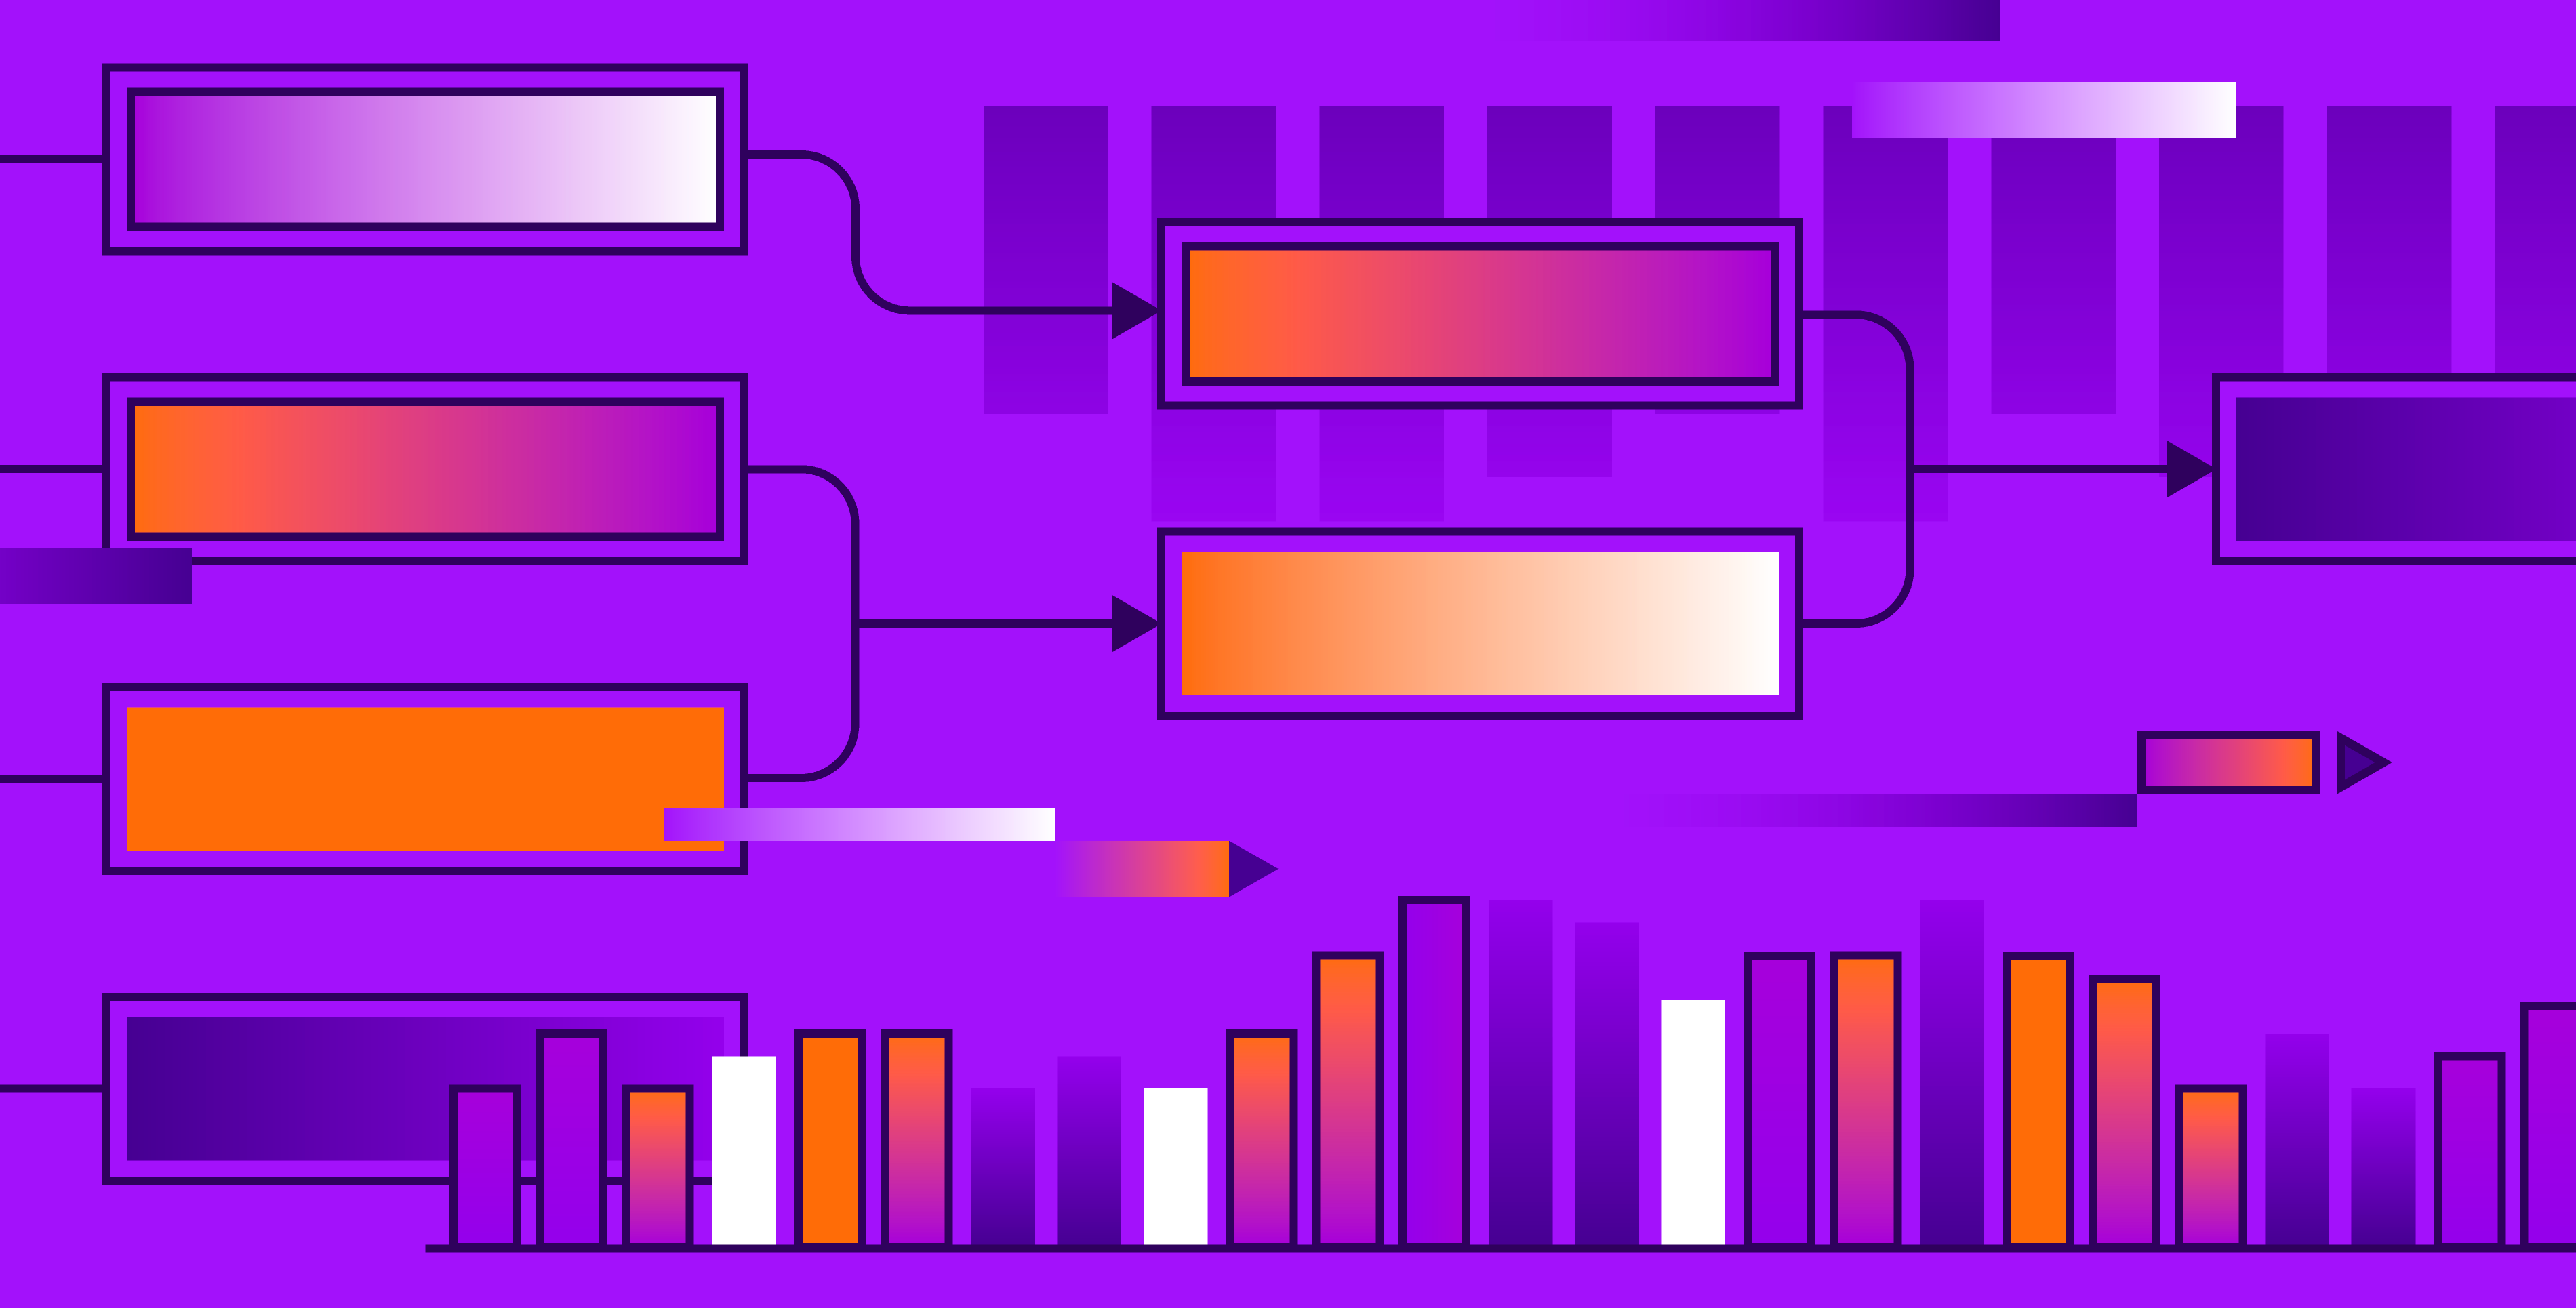
Load balancers are the primary entry points to distributed applications. By strategically directing the flow of incoming web traffic to specific endpoints, load balancers help optimize throughput and ensure the horizontal scalability of applications. In modern systems, load balancers often do more than their name suggests: Beyond basic load distribution, they analyze requests and route traffic based on a wide range of variables, such as client identity. They are also often responsible for implementing critical security mechanisms—for example, decrypting traffic at the edge to block malicious payloads—and performing system health checks. All of this means that load balancers generate some of the highest volumes of logs in modern environments.
In this post, we’ll help you understand and strategically monitor your load balancer logs. There are many types of load balancers, and their logs are varied in both structure and content. We’ll focus on load balancers where they are most commonly implemented, in layers 4 and 7 of the OSI model: the transport layer and the application layer. We’ll examine the anatomy of both application (layer 7) and network (layer 4) load balancer logs, highlight key patterns to watch for, and discuss how Datadog Log Management and Observability Pipelines can help you manage and effectively use your load balancer logs.