Large-scale data processing jobs that run on Apache Spark engines, including Databricks, can take hours or days to complete and cost thousands of dollars per month. When a job exceeds its expected duration or cost, data engineers need to understand whether the problem comes from infrastructure sizing, Spark configuration, query design, code, or a combination of these factors. The Spark UI and Spark History Server contain valuable execution details, but finding the right bottleneck and mapping it back to the right fix can take hours of manual investigation.
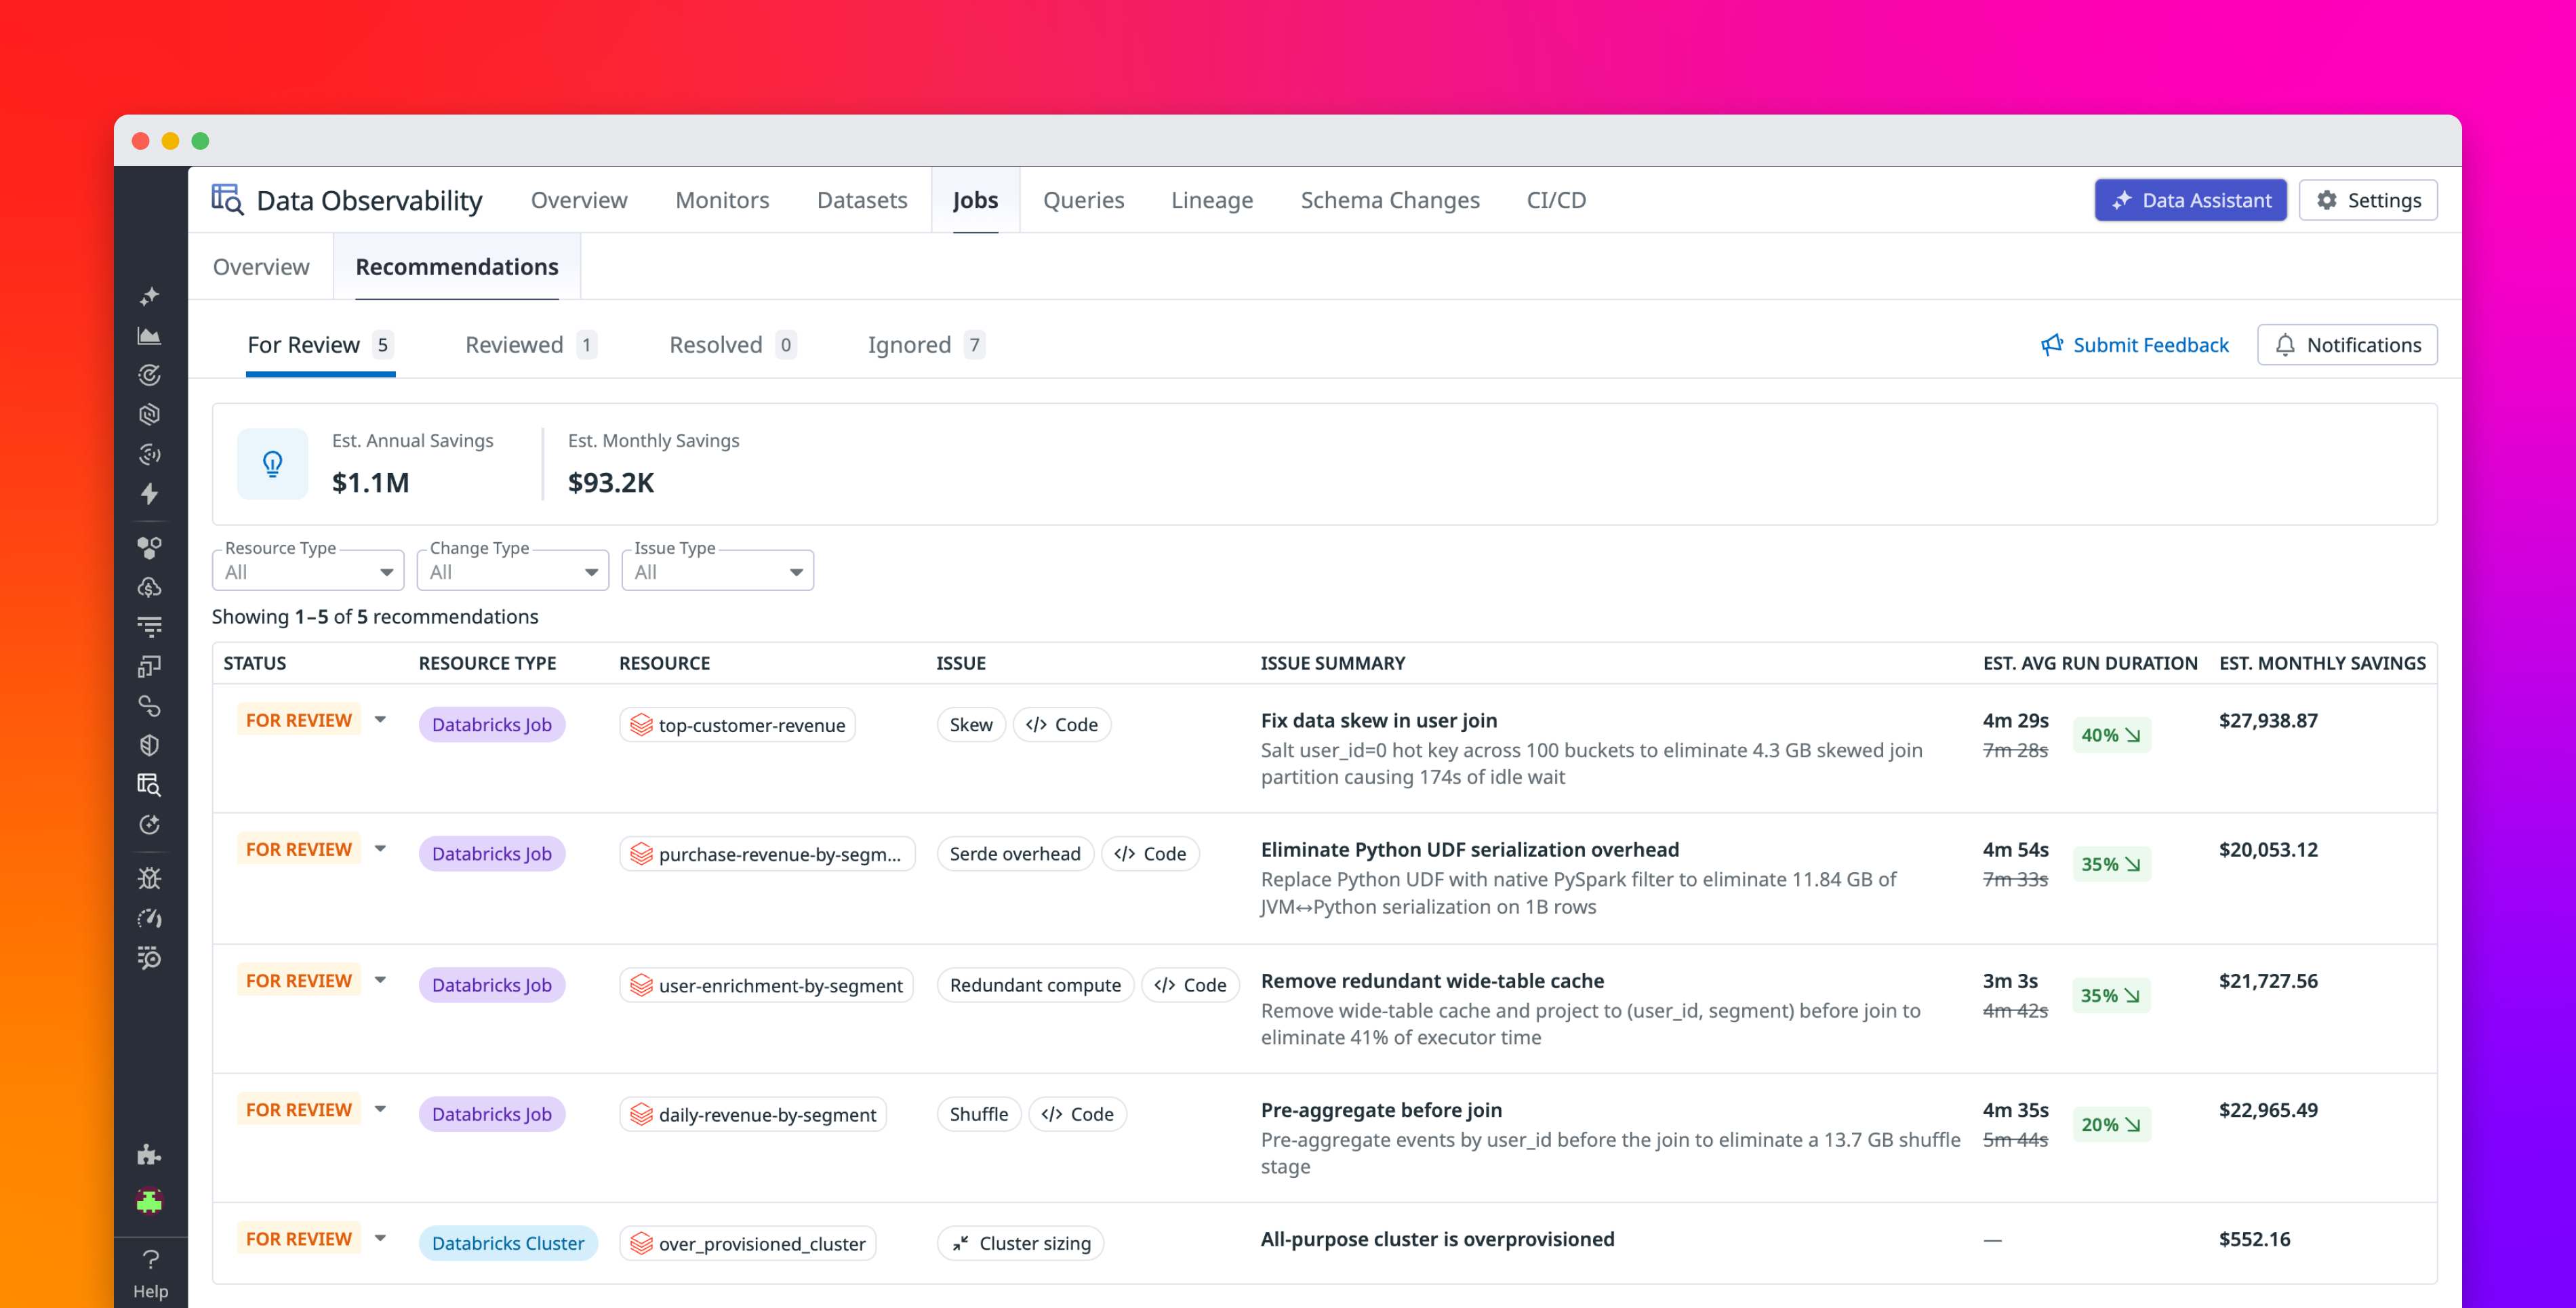
Datadog Data Observability’s Jobs Monitoring feature now helps data engineering teams identify high-impact optimization opportunities across Spark and Databricks jobs, then turn those findings into targeted fixes. Recommendations use job execution context from Jobs Monitoring to proactively surface changes at the code, query, configuration, and infrastructure layers. With Datadog MCP Server tools, Bits Code, and source code context, engineers can apply optimizations directly in the Datadog UI or bring production job performance data into their existing AI-assisted development workflows—without loading large and noisy Spark history data into an agent’s context window.