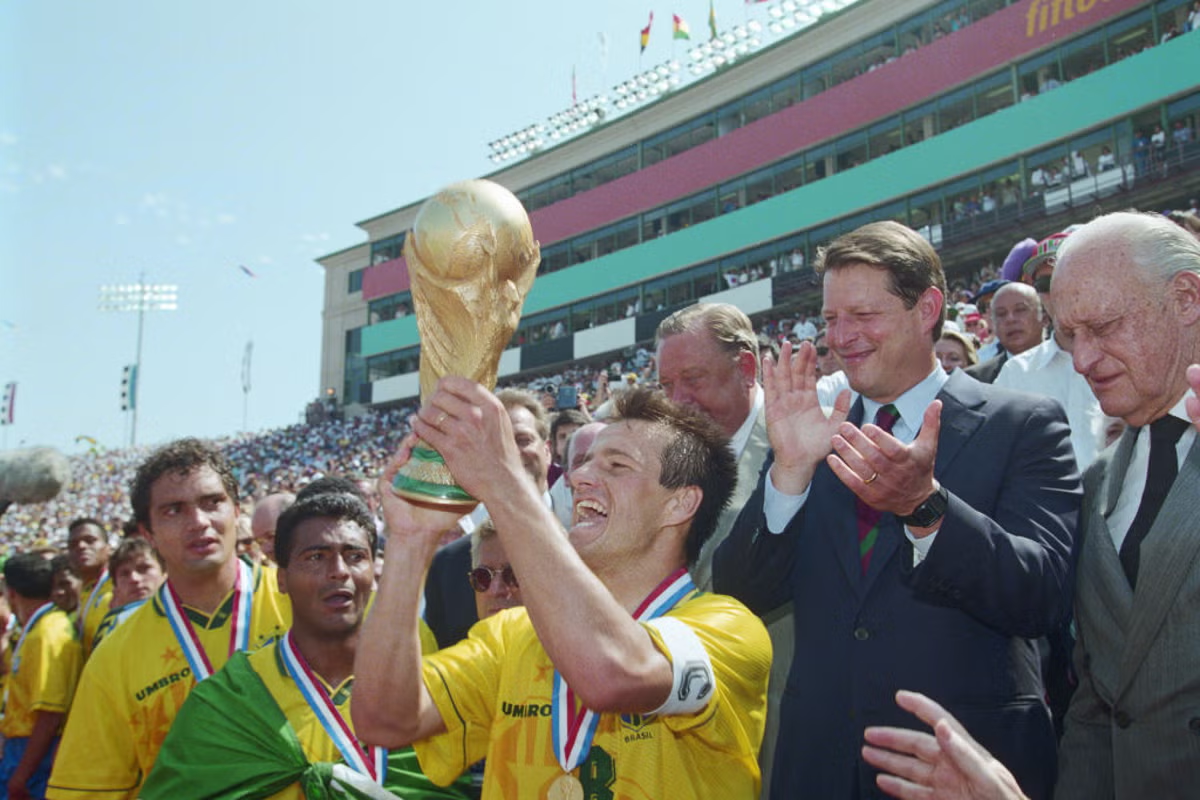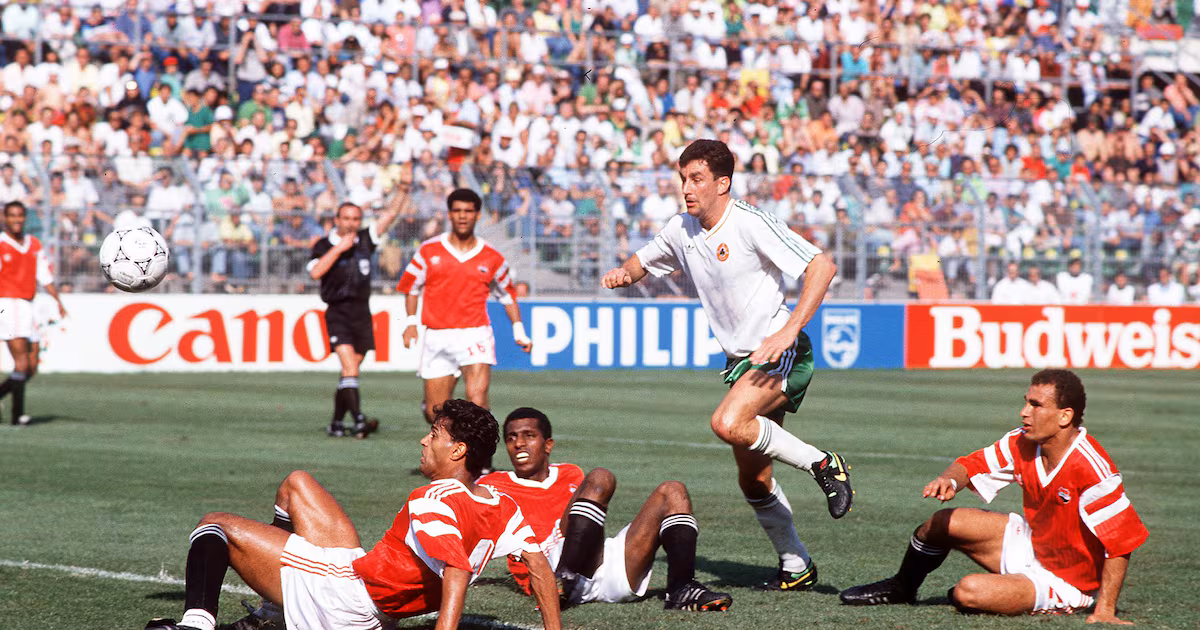
Get free access to the most comprehensive World Cup coverage in The Athletic app.This is a fully updated version of a John Muller piece The Athletic originally published ahead of the 2022 World Cup.When an estimated 400 million people tuned in to the 1966 World Cup final between England and West Germany at Wembley, many of them watching a game live on television for the first time, it changed the way we remember football.Before the 1954 tournament, World Cups weren’t televised at all. If you wanted to know how teams played, you bought a newspaper the next day and read a column about it by some cigar-chomping sportswriter in a three-piece suit. Now fans could follow along for themselves in fuzzy black and white: And here comes Hurst, he’s got — some people are on the pitch, they think it’s all over… It is now!But watching every game of a World Cup yourself can be a pretty hefty time commitment, as a billion exasperated spouses every four years can attest. And as for actually remembering individual matches you watched even one tournament ago, let alone four or five? Forget it.Luckily, the arrival of football as a televised sport had another, unanticipated side effect: it made it possible to turn the game into data.Opta, the data provider whose detailed records of on-ball events are behind most football stats you’ve seen, has gone back through decades of video and logged every World Cup game from 1966 on, touch by touch, the same way they cover a weekend’s Premier League action.At last, we can savour the most famous moments in football history the way they were meant to be experienced… as a bunch of rows in a spreadsheet.No, for real, this is cool.You’ve seen clips of goals. You’ve read ghostwritten autobiographies and tactical histories the size of a team bus. But unless you’re blessed with an eidetic memory of that Yugoslavia vs United Arab Emirates match in Bologna you watched in your Ninja Turtles pyjamas (or Hero Turtles as the were called in the UK) at age five, there’s been no objective way to measure the many ways the game has changed.Except now, armed with over half a century of data, we can give it a try.Here, era by era, chart by chart, Total Football passing network by Pele possession value per 90 stat, is The Athletic’s data history of the past 15 World Cups…Football was very different in 1966 — England won World Cups for starters (Central Press/Hulton Archive/Getty Images)The long ball era: 1966-70That Wembley final people tuned in to watch didn’t look a whole lot like football as we know it today.The passes back then were so long. A full 25 per cent of the pass attempts by England and West Germany in the 1966 final travelled at least 20 yards up the pitch. For comparison, only one game by any team hit that mark at the 2022 World Cup four years ago — Iran versus Wales in the group stage.Another thing back then was that, with the ball always sailing overhead, players weren’t always super strict about what we might call “positions”. Pop quiz — what formation did England play in that final?OK, a quick word on some nerdery. The visualisation above is called a passing network, and it shows players’ median positions during the longest stretch of the game where their side didn’t make a substitution — which, given subs weren’t introduced at the World Cup until 1970, meant all 120 minutes of this final.The size of players’ circles corresponds to how many passes they attempted, and the thickness of a line between players indicates how often one player passed to another (at a rate of at least five passes per 90 minutes to earn a line).See how Jack Charlton is just sort of floating around on his lonely red dot at the bottom, unmoored from the team? That was normal for a centre-back in the long-ball era. Don’t worry, the game’s going to come to you in a few decades, buddy.The colours of the lines and circles are based on a metric called “possession value”, which really just means “goal probability”. When a player passes the ball somewhere that makes their team more likely to score, the change in scoring percentages is the value of the pass.Possession value metrics come in a lot of flavours, some more sophisticated than others, but the one we’re using is based on a simple grid that tells you how often the average (modern) team goes on to score from a given location. It’s a ball-progression stat. Pass the ball closer to the other team’s goal, and you’ll earn some possession value. Pass it backwards, and you get nothing — good day, sir.As a model of the game, that’s a little crude, right? And yet it’s more or less how football worked at the time. During the 1966 World Cup, teams kicked the ball forward seven yards for every yard they passed backwards. By 2022, that ratio had sunk closer to three to one. “A pass backwards does not mean fear but the start of another, better move,” Pep Guardiola once wrote. A generation earlier, that kind of touchy-feely talk might have got him sacked.You can see from the pass sonar above that passes angled straight ahead have become less common (shorter slices at 11 and one o’clock) and a lot less long (darker purple instead of white or yellow). Maybe more importantly, the sonar shows that teams in the long-ball era were reluctant to play sideways. There is a reason most completed passes in the modern game travel across the pitch, not up and down it — but we’ll get to that.The point is, football is always changing. Sometimes those changes are driven by tactical trends, sometimes by the laws of the game, and sometimes by other, weirder stuff, like, say, choosing to stage a World Cup in the desert outside Doha.One of the stories we football analytics dorks like to tell about how we’ve changed the game goes something like this: around 15 years ago, Opta and other companies began collecting event data, and in the last decade analysts have used it to popularise a metric called expected goals (xG) that said, basically, “Shoot from closer to goal, dummies.” Gradually, in league after league, Philistines heard the good news of statistics and lo, it came to pass that players did shoot from closer to goal.That may all be true, but World Cup data makes clear that the great shot shift was going on a long time before anybody had heard of xG. In 1970, 62 per cent of shots came from outside the penalty area. By 2006, that was down to 54 per cent. Fifty years ago, it took around 15 non-penalty shots to score a goal. Most recently, it was closer to one in nine shots.Shooting was especially selective at the last couple of tournaments, it’s true, but long-term trends make it fair to wonder how much data really had to do with it. What was it stats people are always saying about correlation and causation?Every once in a while, the data can turn up ways that football hasn’t changed that much after all.In 1970, Brazil demolished Italy so beautifully in the final that one newspaper compared their achievement to the Moon landing.They did it with short passing (less than 10 per cent of Brazil’s passes were long balls) and circulation (fewer than five forward passing yards for every one backwards). Each backward pass wasn’t a sign of fear but the start of another, better move — except for the one where Clodoaldo inexplicably tried a no-look backheel in his own half and gifted Italy their goal. That was a worse, but very Brazilian, move.Brazil still took 19 of 27 shots from outside the box, and their disconnected centre-backs are a relic of the long-ball era.Still, the team’s clearly defined shape, with its narrow wingers, well-connected midfield and attacking right-back, looks a lot like a contemporary 4-2-3-1. To watch footage of the game is to discover a strange thing, both ancient and modern, like a first-gen iPod stuffed in the back of a drawer. Maybe it can still play that Nelly album?
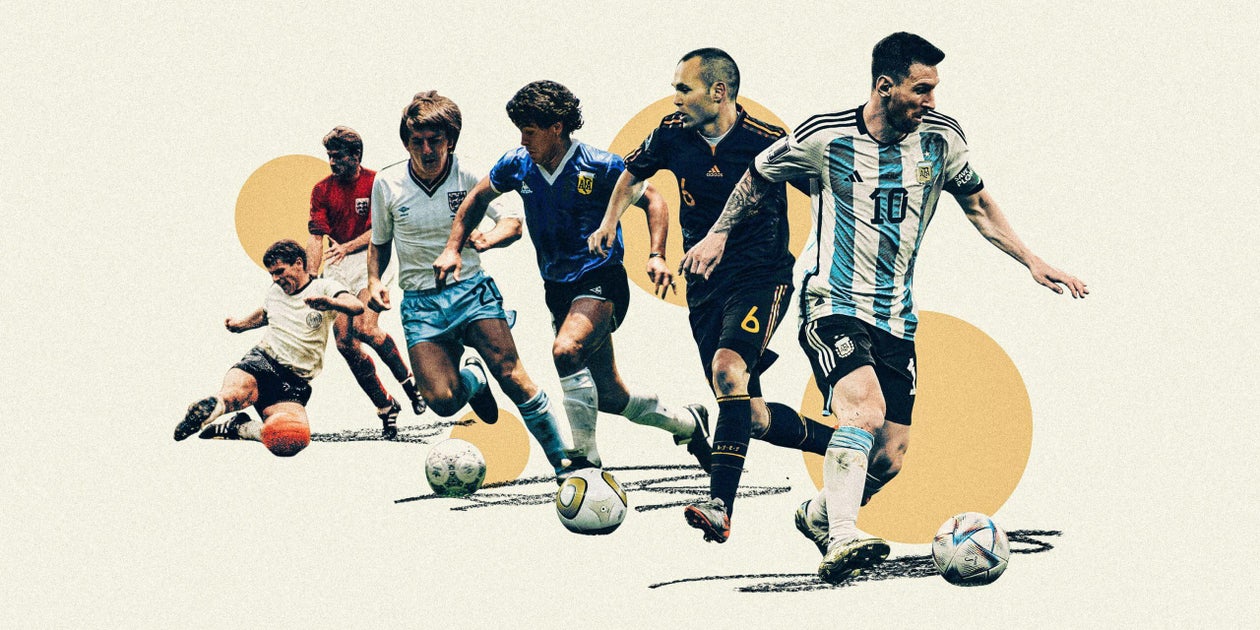
From long balls to short kings: The evolution of World Cup football from 1966 to now
Using visualisations and Opta's historic World Cup data, The Athletic looks at how football has changed across the past 15 tournaments
4,337 words~20 min read