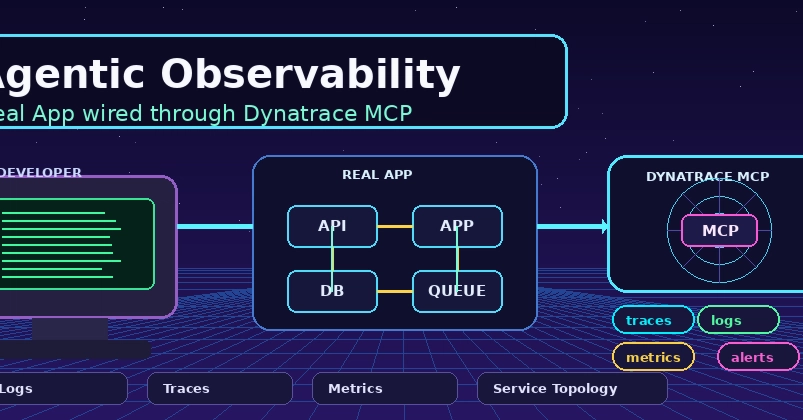
When should I reach for a log, a trace, or a metric? I hit that question constantly when I instrument code, and I watch coding agents hit it too. It sounds like it should be obvious. Errors, traces, logs, and metrics are the four kinds of telemetry most apps run on, four tools in one box, and they overlap enough that the honest answer is every developer’s favourite: it depends. You can stuff context into span attributes instead of logging it. You can count log events instead of emitting a metric. You can add a duration to a log and call it a span.
[I had a spiderman meme here but legal told me it would be infringing so I removed it]
But the fact that you can doesn’t mean you should. Each signal exists because it answers a different question, and feeds a different workflow once it lands. Left without solid guidelines, the default is to reach for whatever’s most familiar or already there, and miss what the other kinds are for.
This post is the guidance I wanted to have, for myself and my robots. Want just the skill? Skip to the end.
In Sentry, errors, traces, logs, and metrics all come from one SDK, included on every plan. Errors and tracing have been around for years (2012 and 2020), structured logs landed last year, and Application Metrics completed the set back in May of this year. If you’ve had your application instrumented with Sentry for a while, errors and traces are probably already flowing, with logs and metrics left as tools for you to complete your telemetry story.