Every engineering team runs into the same annoying problem sooner or later. Monitoring tells you that something is broken, but it usually stops right there. You can see error rates. You can see latency spikes. You can see failed requests. But the questions that matter during an incident are often still unanswered.
Who owns this service? What depends on it? Where is the runbook? Which Slack channel should I use? Is this a real outage or a known failure mode?
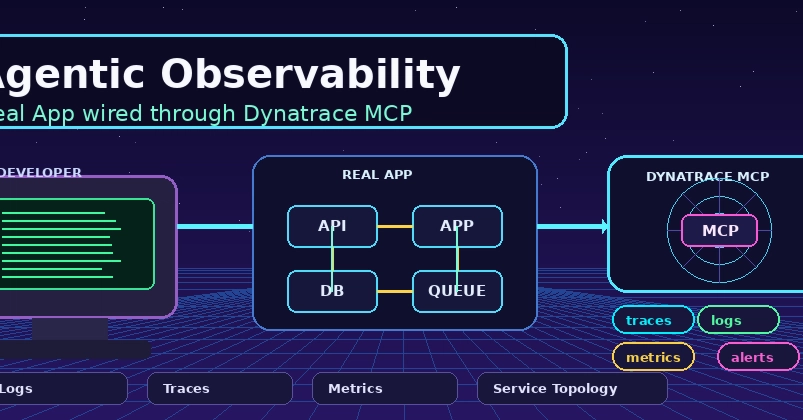
That gap is exactly why I put together this small Agentic Observability demo. I built a tiny shopping app, instrumented it with OpenTelemetry, sent the telemetry into Dynatrace, and then used Port as the context layer so I could connect operational signals with engineering knowledge. The result is a much more useful troubleshooting workflow. Instead of staring at dashboards and guessing, I can ask what is happening and get back both live health data and human context in one place.
This setup is intentionally small, but it maps really well to the kind of confusion that happens in real systems. The app has products, a cart, checkout flow, and a few baked-in failure scenarios so the observability story actually has something interesting to surface.