Traditional observability gives you more to accumulate: more dashboards, more silos, more tabs. Sentry connects errors, traces, logs, replays, and application metrics into workflows and issues so you can actually fix things faster. Tolerated by 4 million developers GitHubAtlassianDisneyCloudflareInstacartGorgias Trace requests across your entire stack From browser to database, in one view Modern applications span dozens of services, queues, and databases. Sentry's distributed tracing follows requests end-to-end so you can pinpoint exactly where slowdowns and failures originate. It works across frontend, backend, mobile, and AI agents running inside your app. Explore tracing One place for errors, traces, logs, replays, and metrics Stop copying trace IDs between tools Logs, errors, traces, and metrics usually live in separate panes that don't talk to each other. Sentry connects all of these signals, including high-cardinality application metrics that link back to traces, so you can go from symptom to root cause in one place. You can also send existing logs to Sentry via log drains, so your whole team is looking at the same data. Watch the workshop Catch issues before users report them Detect regressions at deploy time Sentry detects regressions the moment they appear, not when a customer opens a support ticket. Anomaly detection surfaces latency spikes and error rate changes without manual threshold configuration. Performance Insights automatically finds N+1 queries, slow database calls, and render-blocking operations, ranked by user impact. Learn about alerts Separate tools for errors, traces, logs, and metrics.Requires agents, sidecars, and complex configuration.Dashboards show metrics, not where the problem is in your code.Threshold-based alerts that require manual tuning.Pricing scales with data volume in ways that are hard to predict.Errors, traces, logs, replays, and high-cardinality application metrics connected in one workflow.SDK-based setup. Install and go, no infrastructure to manage.Every issue and every metric links to the exact function, file, and commit.Anomaly detection with no manual threshold configuration.Transparent, predictable pricing with a generous free tier.
Application Observability | Sentry
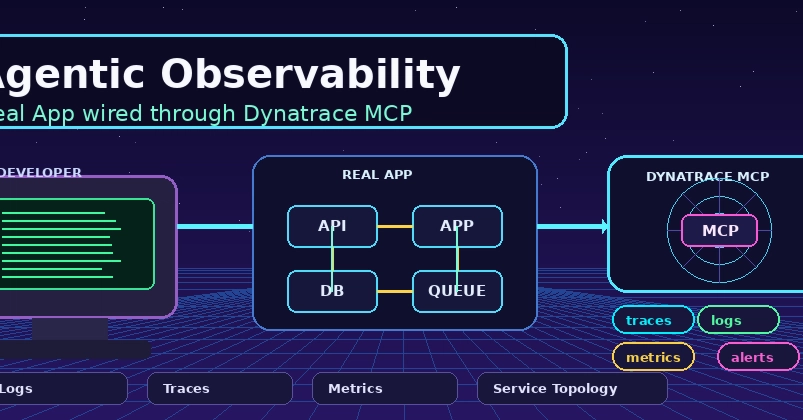
Your observability stack accumulated over time. Sentry connects errors, traces, logs, replays, and application metrics in one place so you can find and fix problems faster.
399 words~2 min read