Introduction
Modern cloud-native systems generate an enormous amount of telemetry data every second. Applications, containers, Kubernetes clusters, APIs, databases, and infrastructure components continuously emit metrics, logs, and traces to help engineering teams understand system behavior and troubleshoot issues. While observability has become essential for operating distributed systems reliably, it has also introduced a new challenge: managing the scale, cost, and quality of telemetry.
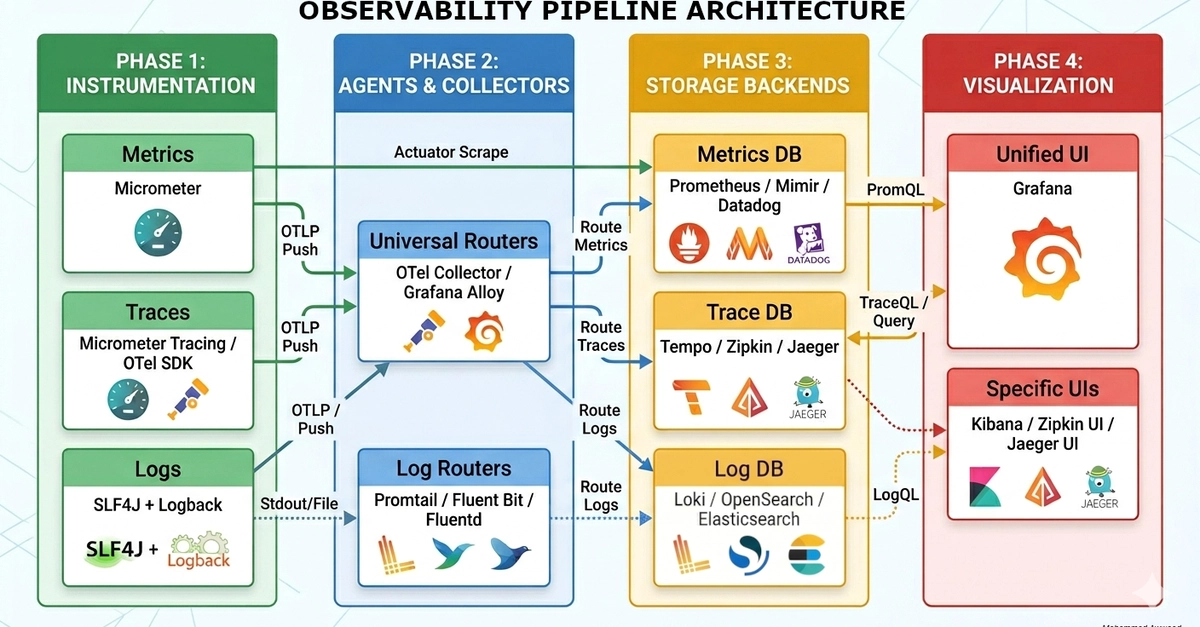
OpenTelemetry (OTel) has emerged as the industry standard for collecting and processing observability data. It provides a vendor-neutral framework for instrumenting applications and exporting telemetry to different observability backends. However, simply adopting OpenTelemetry is not enough. Without proper optimization strategies, organizations often face excessive telemetry ingestion costs, noisy dashboards, high-cardinality metrics, trace overload, and inefficient debugging workflows.
This article explores practical approaches for optimizing observability using OpenTelemetry. It focuses on metrics, logs, and traces individually while also discussing broader optimization strategies across the telemetry pipeline.