If you’ve spent any time modernizing a Java-based microservices architecture recently, you’ve likely hit the "Observability Wall." The ecosystem is drowning in tools. We hear about Prometheus, Loki, OpenSearch, Zipkin, Tempo, OpenTelemetry, Grafana Alloy, Datadog—the list never ends.
Observability isn't about collecting tools; it’s about establishing reliable data streams that tell you exactly what your system is doing.
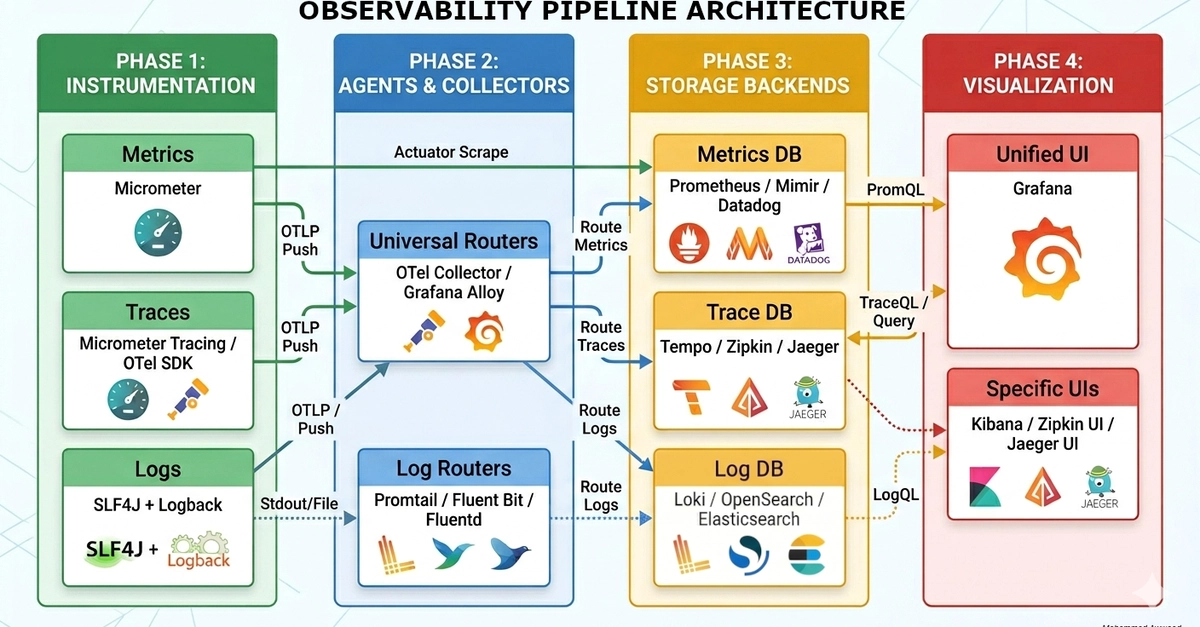
In this article, we’re going to demystify observability architecture in the Java ecosystem, structure it into a clean 4-phase pipeline, and discuss the architectural realities of when to choose an all-in-one stack versus a customized best-of-breed setup.
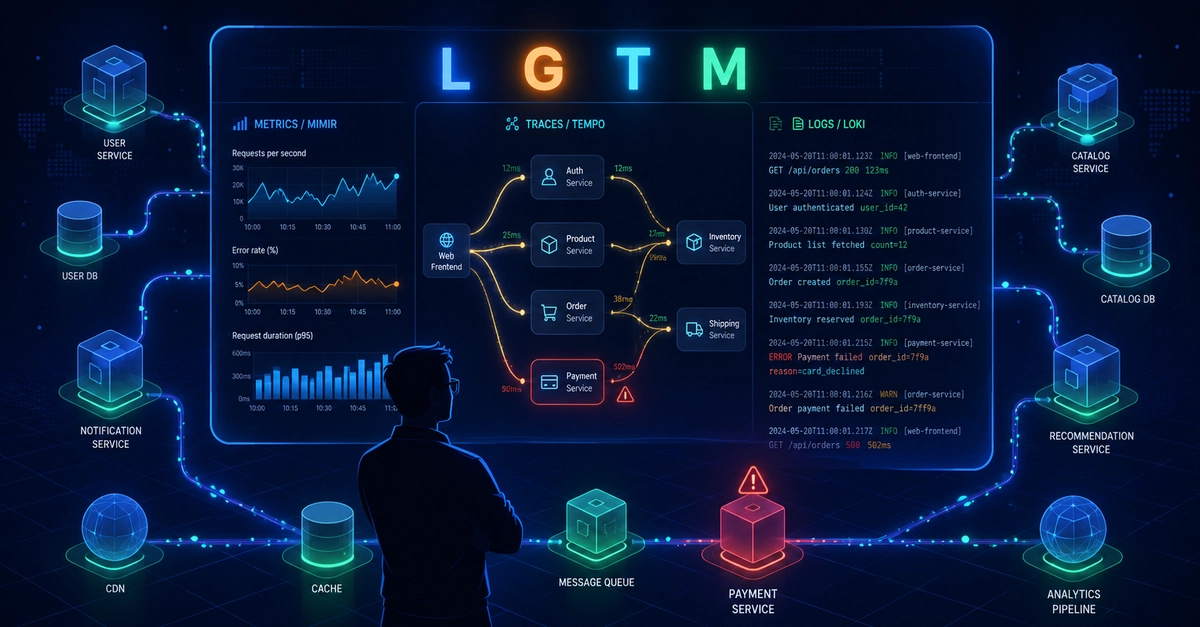
The 3 Pillars of Observability
Before we talk about architecture, we have to define the data. Observability relies on three distinct types of telemetry data, commonly known as the "Three Pillars":