Observability Practices in Action: Instrumenting a Node.js API with Metrics, Logs, and Traces
It's 3 AM. An alert fires. Checkout latency spiked, and orders are failing intermittently. You SSH into a server, grep through log files, and hope you find something before your coffee gets cold — or before customers start noticing.
This scenario is exactly what observability was built to prevent. Not by adding more dashboards for the sake of having dashboards, but by giving engineers the ability to ask new questions about their system without shipping new code every time something unexpected breaks.
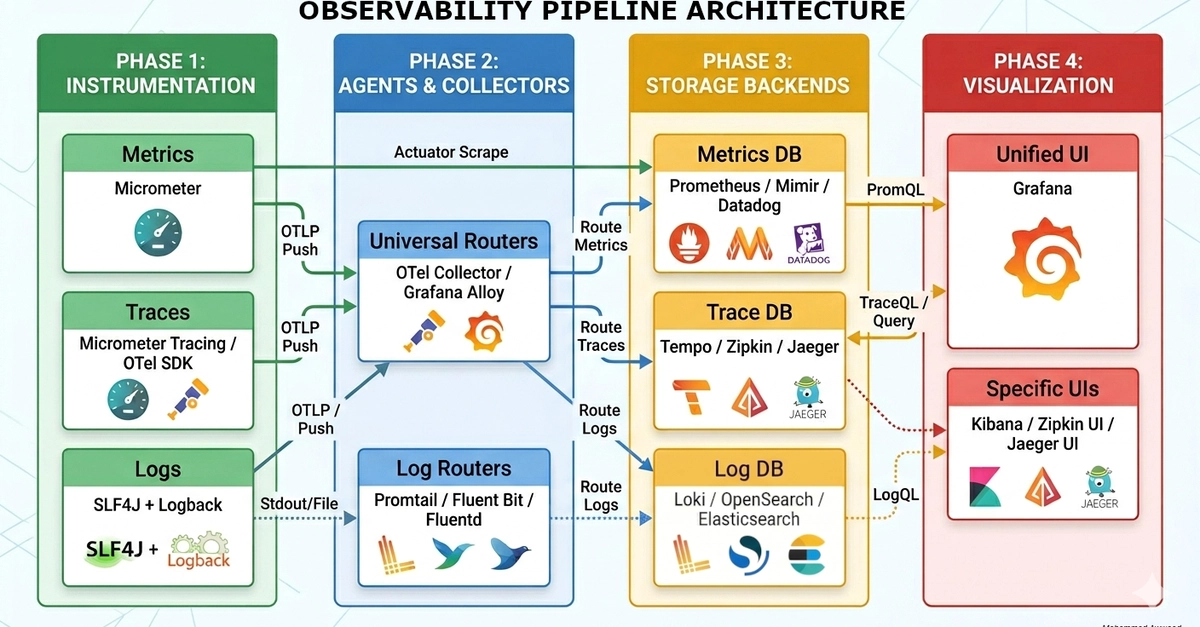
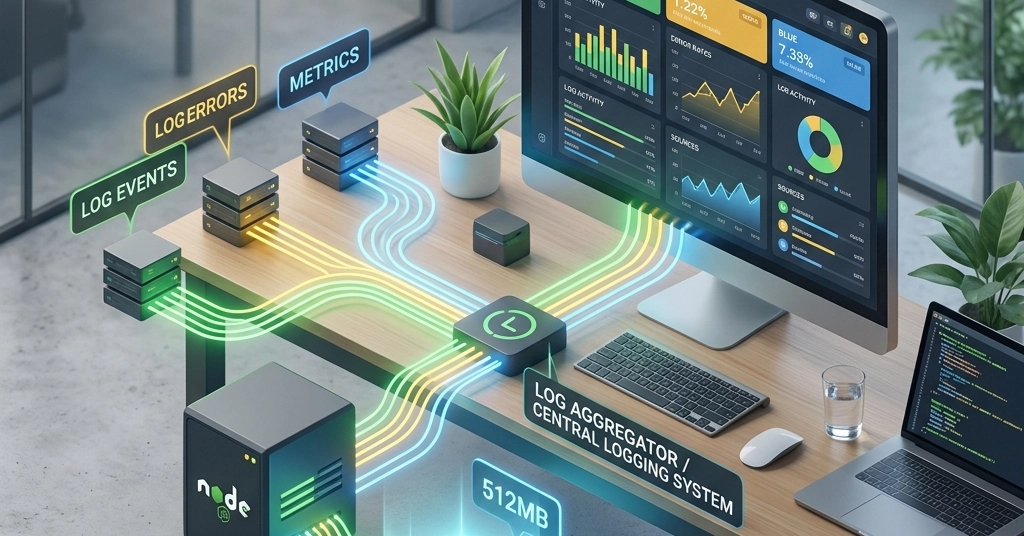
In this article, I'll walk through what observability actually means, why it's different from traditional monitoring, and then get hands-on: instrumenting a real Node.js API with metrics (Prometheus), structured logs, and distributed traces (OpenTelemetry), visualized in Grafana. By the end, you'll have a working local stack you can run yourself.
Monitoring vs. Observability: a real distinction, not a buzzword swap