Introduction
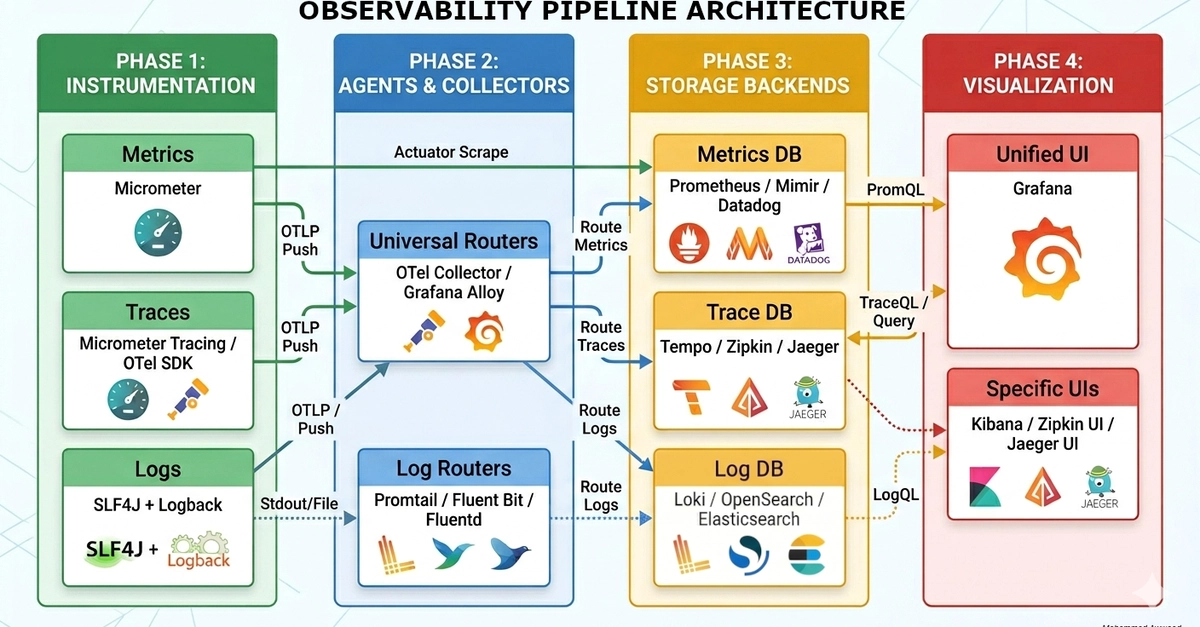
In modern DevOps, simply knowing whether your application is "up" or "down" isn't enough. Users care about latency, reliability, and the consistency of your service. To meet these expectations at scale, we built a production-grade observability platform using the LGTM stack (Loki, Grafana, Tempo, Prometheus), integrated DORA metrics for CI/CD visibility, and implemented SLI/SLO/error budget frameworks to align engineering with business outcomes.
This blog post walks through our complete implementation—from architecture and infrastructure-as-code to burn-rate alerting, incident management, and live chaos testing. We'll show you how to move beyond CPU/RAM monitoring into meaningful reliability engineering.
Why LGTM Over Managed Alternatives?
We evaluated several observability solutions: Datadog, New Relic, Splunk, and managed ELK. Here's why we chose LGTM: