Telemetry volumes are growing rapidly. Over time, teams often adopt multiple tools to manage that growth, whether by choice or as a matter of tradeoffs between query access and storage cost. For example, teams may use Datadog for observability, Databricks for long-term storage in data lakes, and ClickHouse for analytics workloads and SIEM tools. In some cases, logs are duplicated across multiple destinations. In others, they are sequestered in a single tool that’s not accessible to all the teams that need them. The resulting fragmentation can cost teams valuable time as they are forced to switch contexts and rewrite queries for different syntaxes.
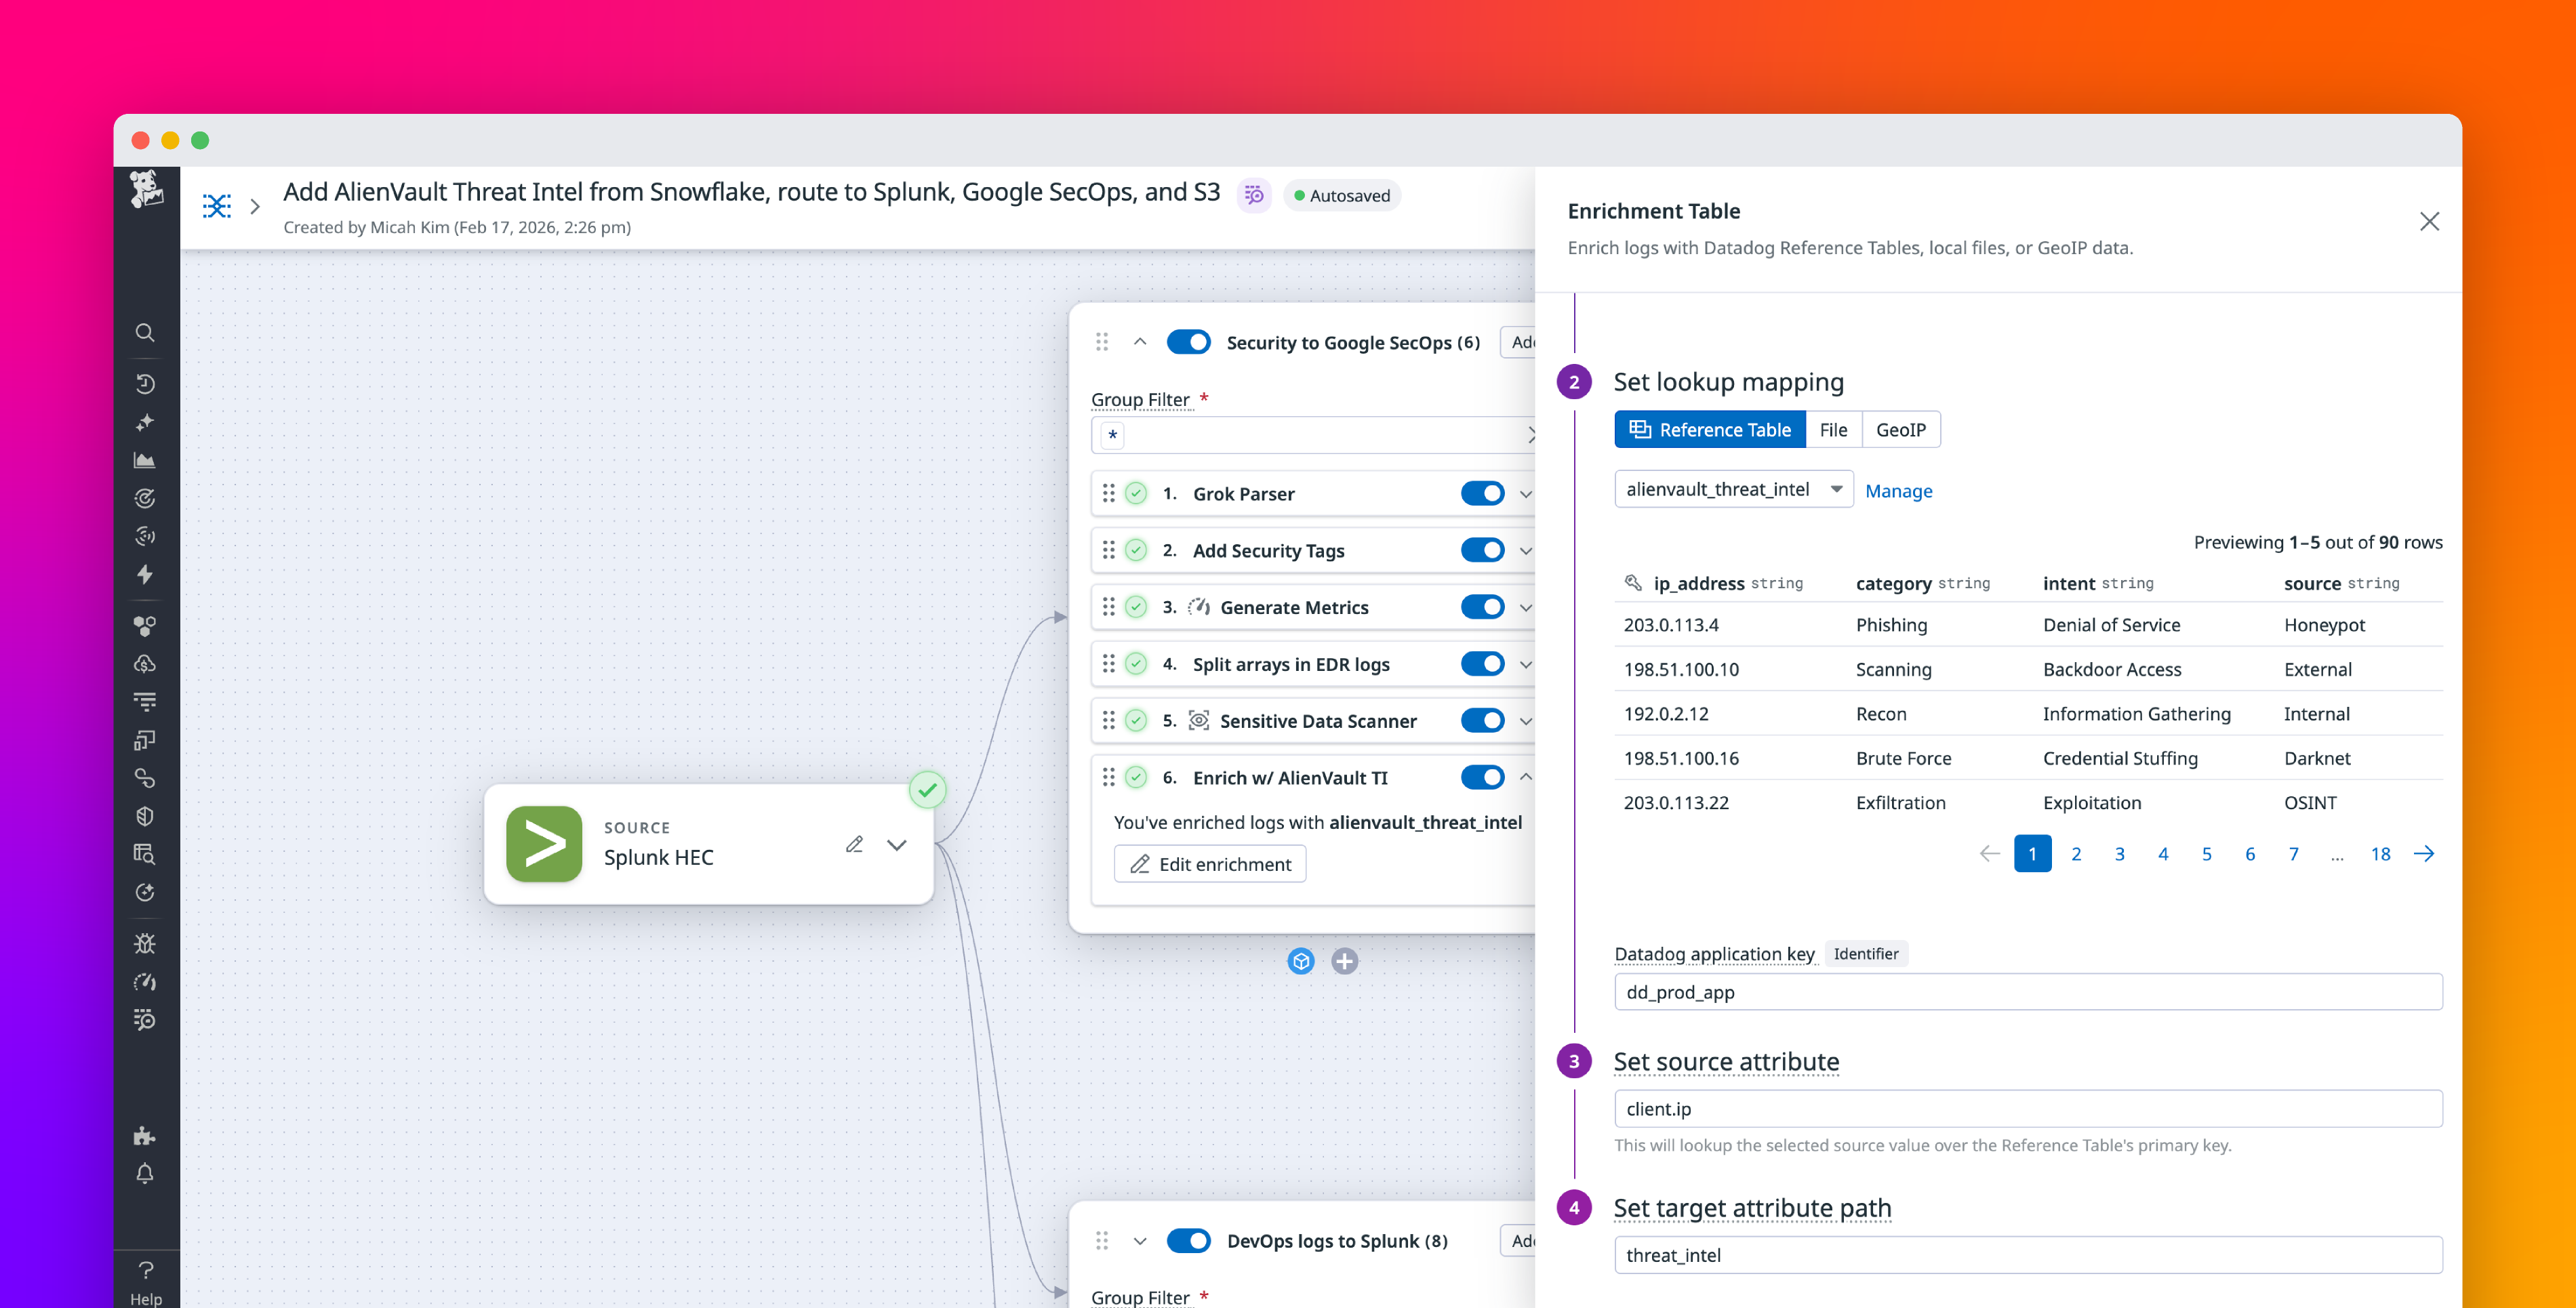
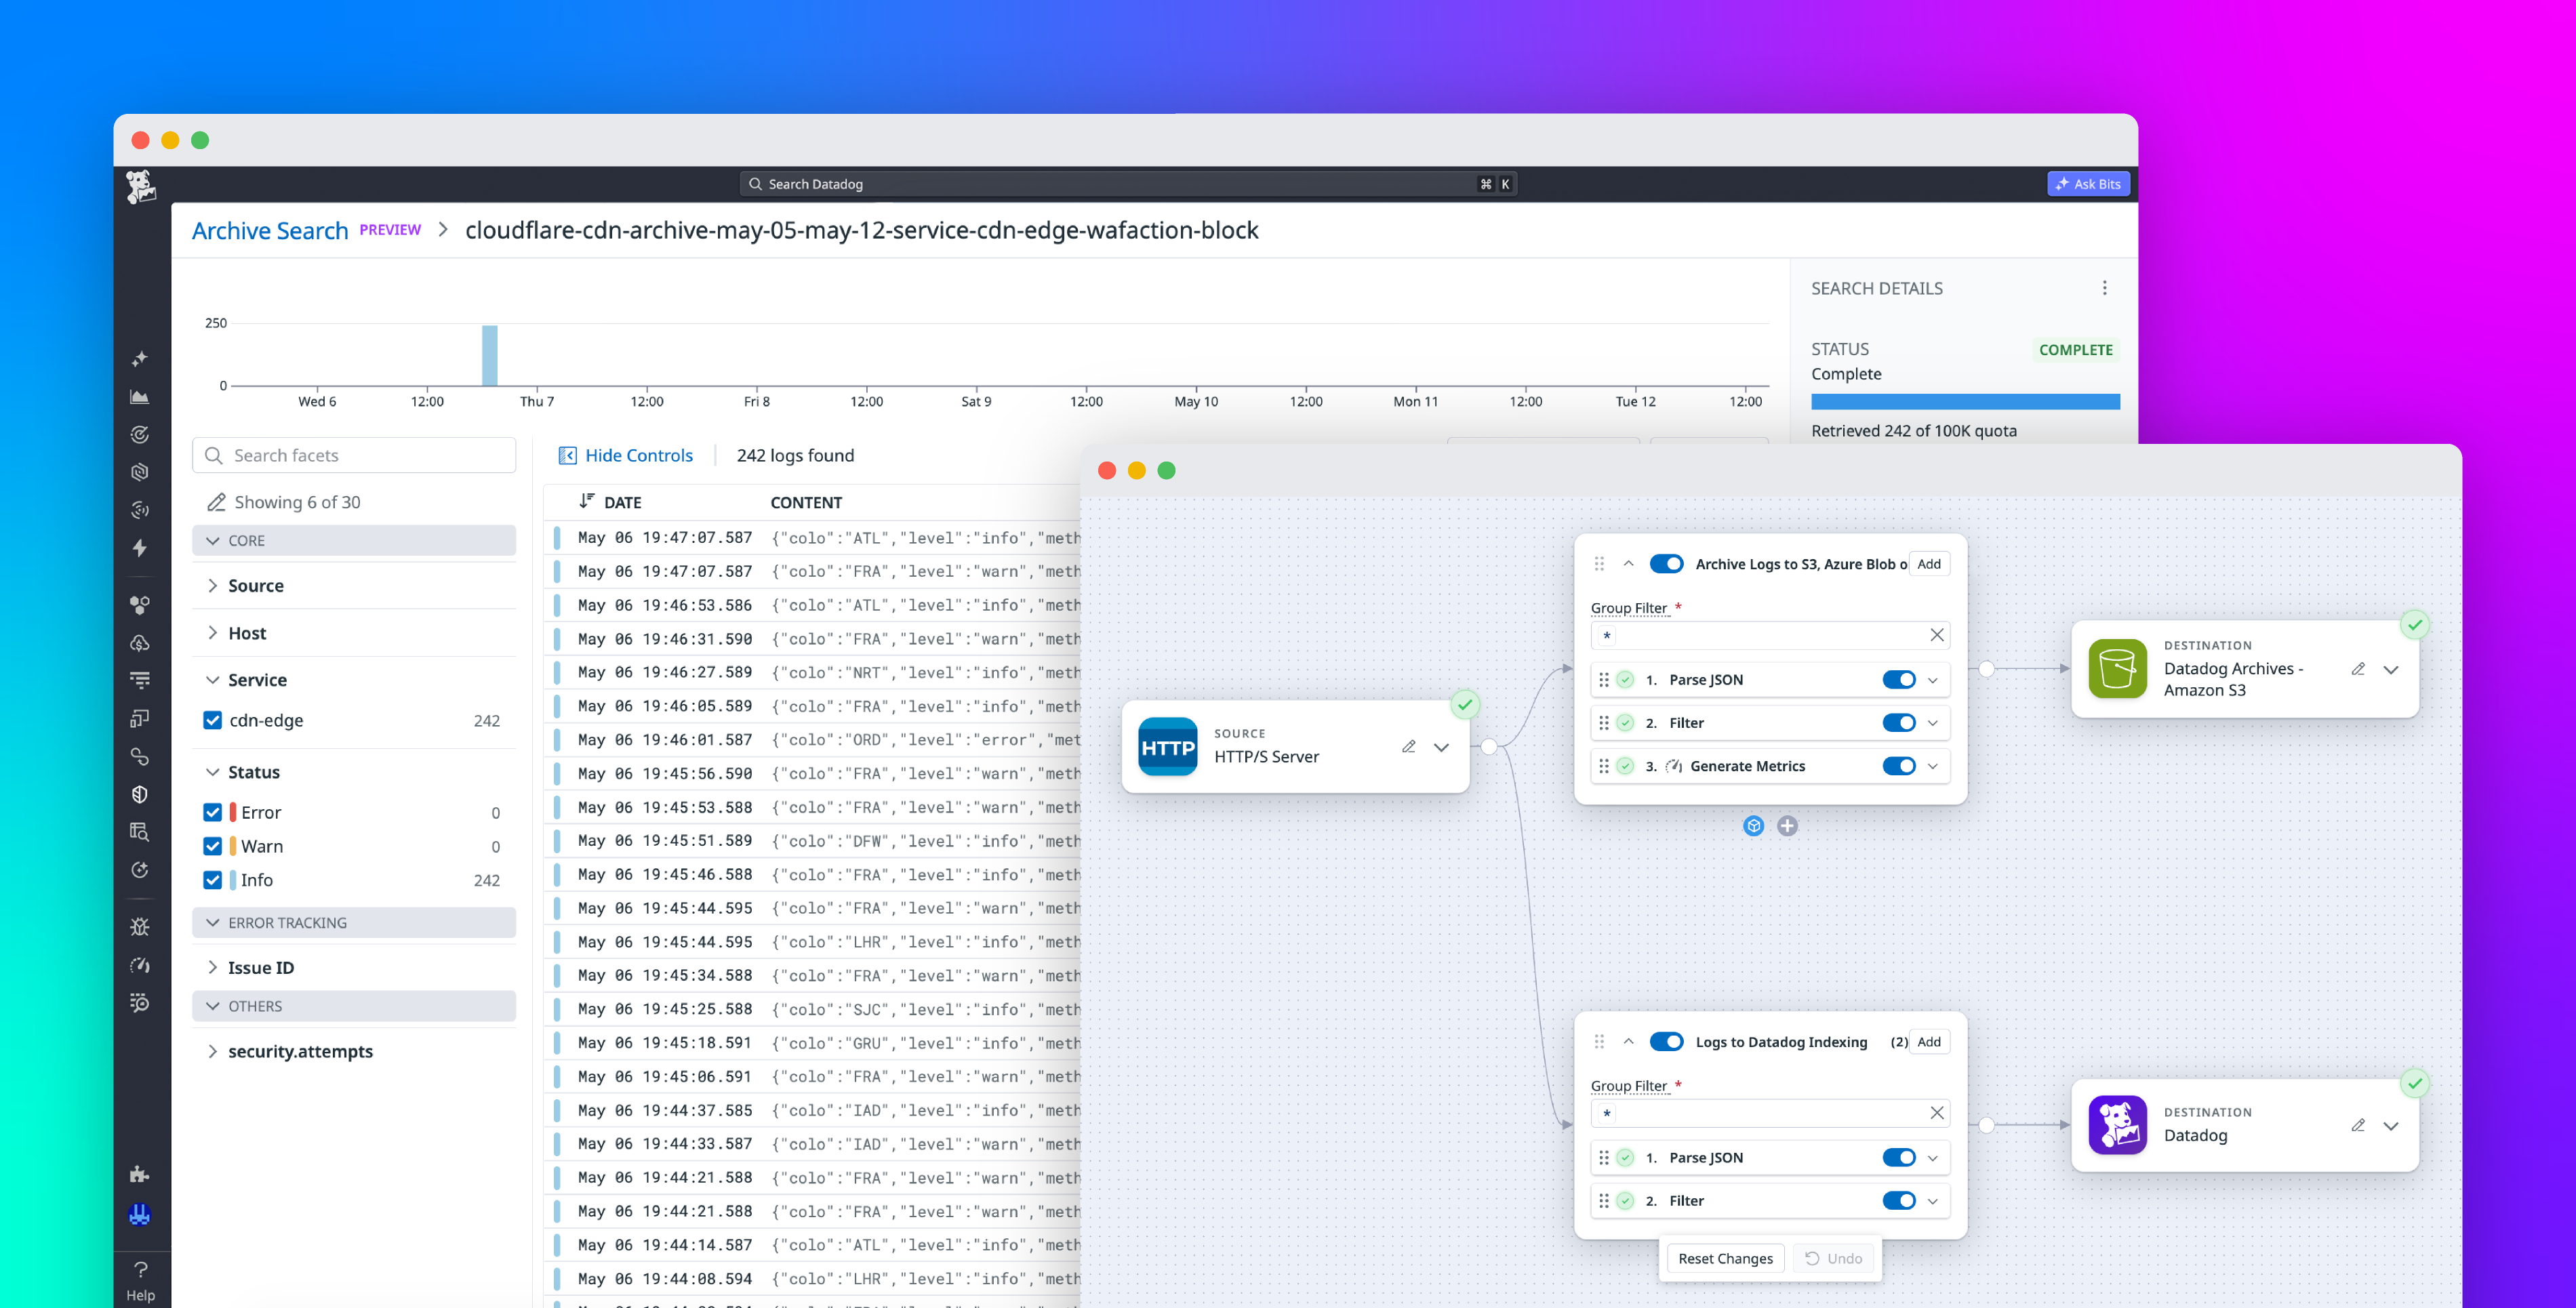
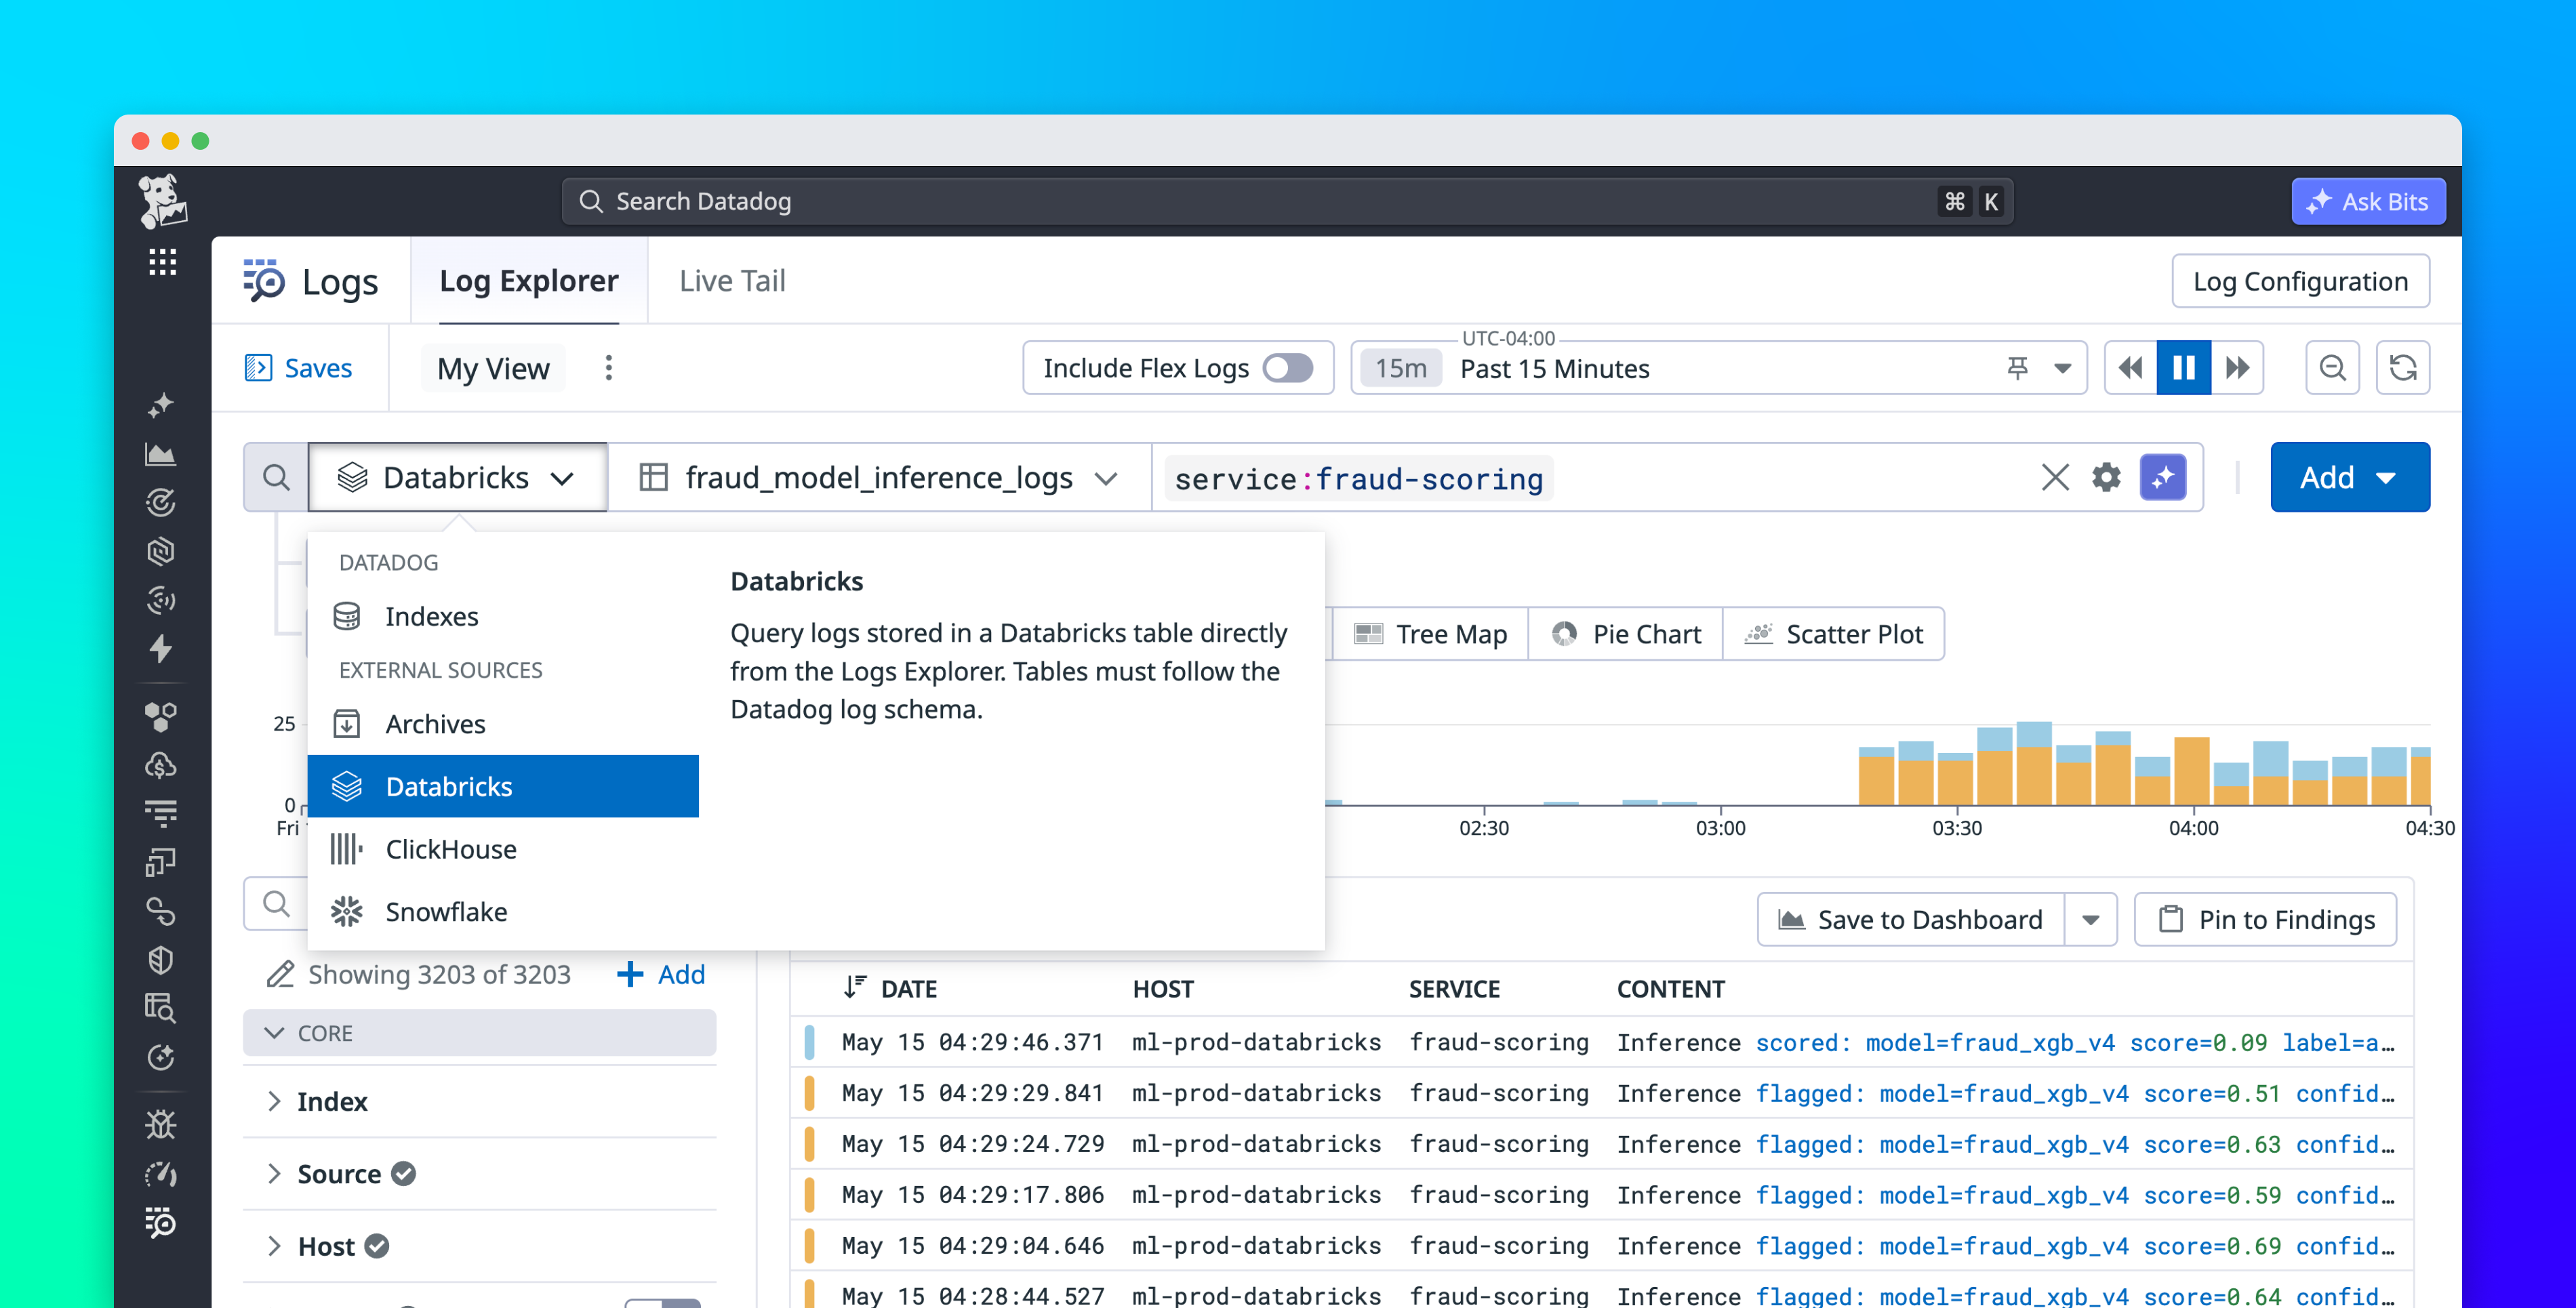
Datadog Federated Logs lets you query external data stores from the Log Explorer, meaning you can query all of your logs from a single interface using a consistent query syntax, no matter where they live. In this post, we’ll show how Federated Logs helps you follow investigations wherever they lead, without switching tools, and maintain end-to-end control over your log data across every destination.
Follow investigations wherever they lead, without switching tools
Consider an e-commerce platform with AI-powered fraud detection. The application engineers on the payments team send operational logs (request errors, latency, deploys) to Datadog, where the rest of the team’s production telemetry already lives. The fraud detection model lives in a lakehouse like Databricks, where the team’s training data, model artifacts, feature tables, notebooks, and scoring jobs can all share the same environment. This separation doesn’t matter until a payment failure traces back to the fraud model, at which point the investigation has to span both stores.