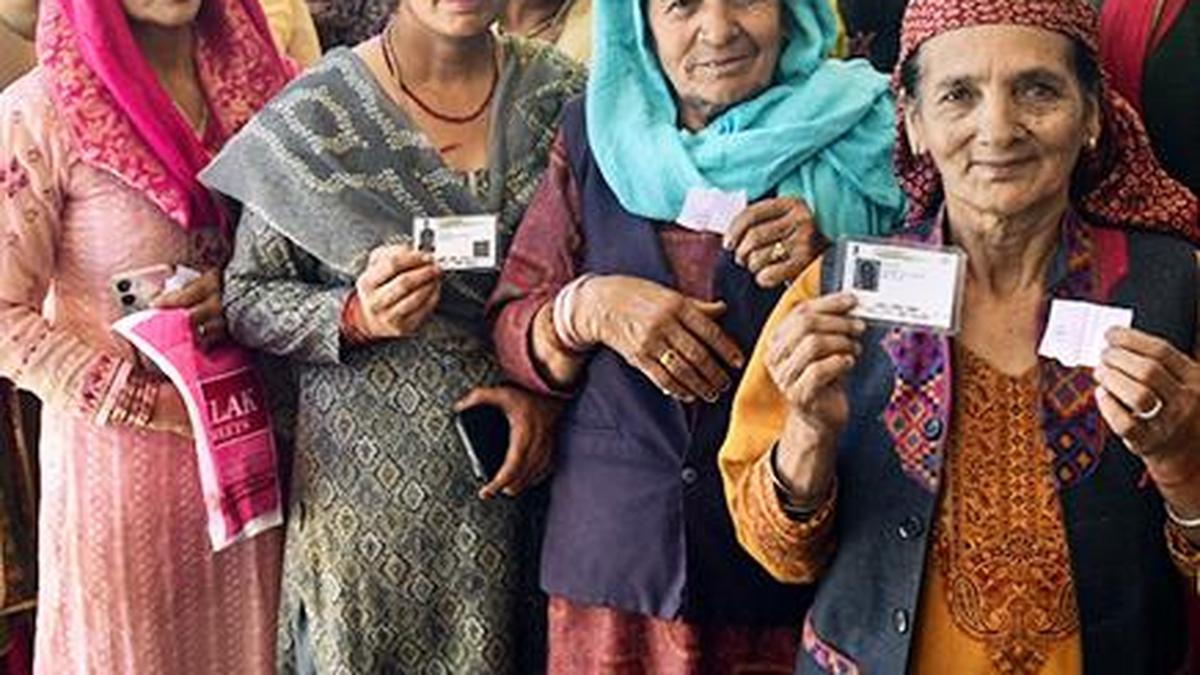
Women waiting in a queue to cast their votes for the panchayat elections, in Mandi on Tuesday. ANI ANI
| Photo Credit: ANI
May 1, celebrated globally as International Workers’ Day, traditionally turns attention to wages, rights, and working conditions. Yet, an equally important dimension often goes unnoticed — how India’s workforce participates in politics. Occupation-wise data from the Lokniti-CSDS post-poll National Election Study 2024, reveals a layered story. The composition of the workforce itself highlights deep structural divides, particularly along gender lines (Table 1).Chart appears incomplete? Click to remove AMP modeAcross most occupations, men dominate, especially in business (87%), skilled work (84%), and semi-skilled work (82%). Even within salaried employment, men constitute nearly four-fifths of the workforce. In contrast, unpaid domestic roles remain overwhelmingly feminised, with 95% of housewives/househusbands being women. The student category offers a glimpse of a more balanced future, with a relatively closer gender split of 58% male and 42% female. Such structural inequalities in the workforce raise an important question: do these groups also differ in how actively they engage in politics?Despite being central to the economy, most occupational groups exhibit low levels of political participation as highlighted in Table 2.A majority across nearly all categories describe themselves as “not at all active” in politics, specifically 60% among salaried workers, and 82% among housewives/househusbands. Even among the most engaged groups, those reporting high levels of participation rarely exceed 10-13%. This suggests that large sections of the workforce, particularly those with fewer resources or greater domestic responsibilities, remain distanced from active political processes. The issue is not merely awareness, but the capacity and opportunity to participate meaningfully. However, low participation does not necessarily imply weak or uninformed political opinions. To understand this, it is useful to examine workers’ policy preferences.Click here to subscribe to our Data newsletterWhen it comes to welfare preferences, the workforce demonstrates a nuanced and pragmatic outlook as shown in Table 3.Across occupations, the most preferred option is not an either-or choice between direct cash transfers and subsidies, but a combination of both. Roughly one-third of respondents in each category support a hybrid model that provides both income support and subsidised essentials. While a smaller proportion favours only direct cash transfers (around 19-23%) or only subsidies (around 30-35%), the dominant preference reflects a desire for both flexibility and security. This indicates that workers are not guided by rigid ideological positions but by practical considerations shaped by everyday economic realities.Table 4 shows that across occupational groups, the largest share of respondents consider both Central and State government performances equally important while making electoral decisions, with proportions ranging from 37% to 45%.Although certain groups such as farmers and students show a slightly greater inclination towards evaluating the Central government, the overall trend suggests that voters are capable of assessing governance across multiple levels. Rather than relying on singular narratives, the workforce appears to adopt a more comprehensive approach to political accountability. It remains largely politically passive, particularly among vulnerable and unpaid groups, yet demonstrates thoughtful and balanced preferences when it comes to welfare and governance.Kirti Sharma and Krishangi Sinha are researchers with Lokniti, CSDS. Views are personal and do not express the views of the institution.Also read:Voting patterns of government employees in recent elections | Data Published - May 27, 2026 07:49 pm IST