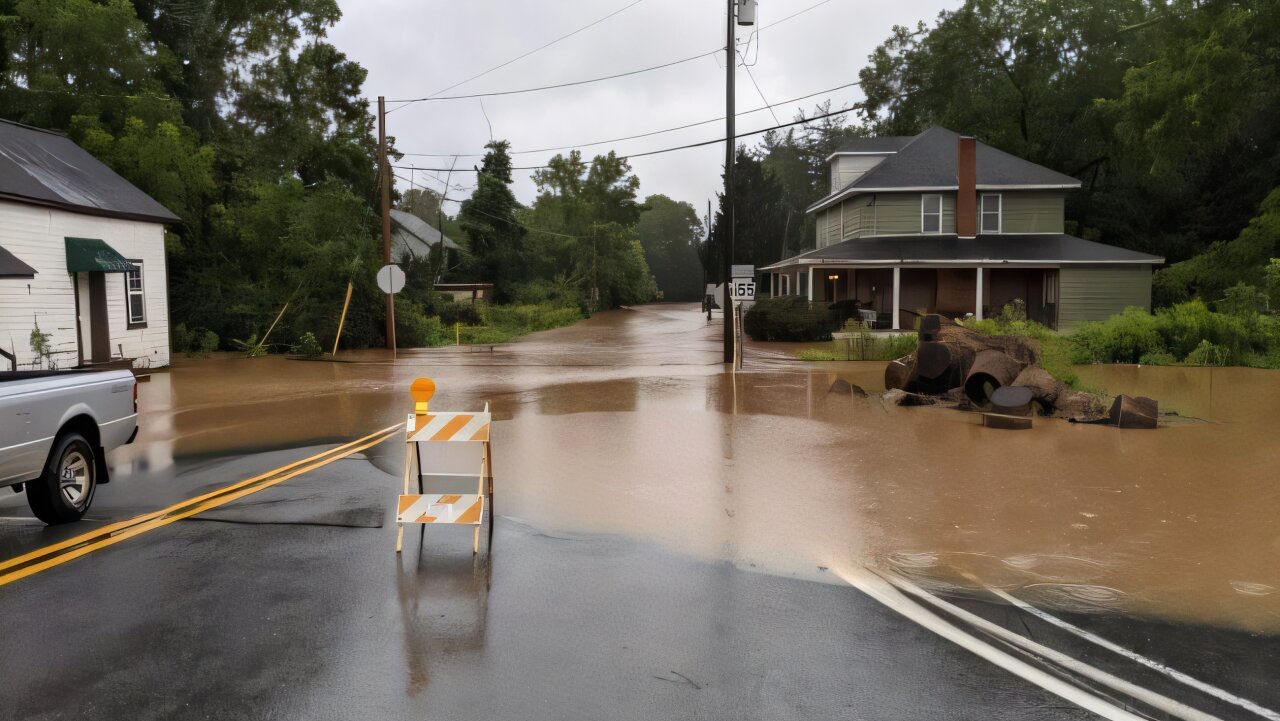
Flooding from excessive rainfall associated with the remnants of Hurricane Ida in the Appalachian region of Pennsylvania near Needmore, PA, September 2021. Credit: Victor Cortes, USGS
Extreme precipitation events are among the most damaging natural disasters and a major concern in our changing climate. In the U.S., since 1980, the most destructive events alone have caused more than 2,800 deaths and $700 billion in damages. But what is the total area of the country affected by these events each year? And how have these patterns changed over the past several decades? In a recent study in Geophysical Research Letters, led by researchers at Lamont-Doherty Earth Observatory, which is part of the Columbia Climate School, the authors discovered some unexpected trends.
What are the trends?
Extreme rainfall events that cover large areas, including hurricanes, atmospheric rivers and thunderstorm complexes, are a growing threat, but many studies on extreme precipitation focus on the statistics of rainfall recorded at individual locations, like weather stations. This new study takes a slightly different approach, looking at not only when heavy rainfall events occur but also how much nearby area was affected by the same event on the same day.