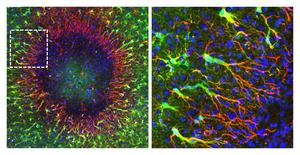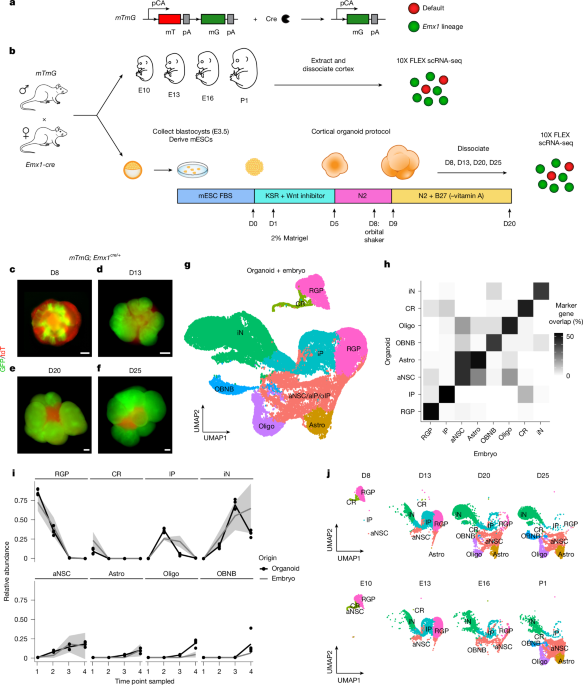
MainThe cerebral cortex is the seat of cognitive brain function and is composed of an enormous number and diversity of neurons and glial cells. Neural stem cells (NSCs), including RGP cells4,5 and their cognate cell lineages, generate and comprise all major neocortical projection neuron classes and macroglia6,7,8. Systematic clonal analysis at single-cell level in situ using MADM has provided an inaugural quantitative and temporally stereotyped framework of RGP lineage progression in mice in vivo1,9. Nascent RGPs initially undergo symmetric proliferative divisions, expanding their pool. Subsequent to a predictable number of proliferative divisions, and at a defined developmental stage, RGPs switch to asymmetric neurogenic division. RGPs in mouse generate projection neurons in units of 8–9 neurons, whereby birth order defines cell fate and laminar position. Following neurogenesis, a fraction of RGPs adopt gliogenic potential to produce astrocytes and oligodendrocytes1. RGP lineage progression proceeds in a strictly linear manner with sequential, largely non-overlapping and consecutive developmental timeframes. Faithful RGP proliferation behaviour and lineage progression are essential for the generation of a cerebral cortex of correct size and cell-type diversity10,11,12,13. The fundamental principles that instruct the transitions along RGP lineage and their chronological neurogenic or gliogenic potential are still unknown, although cell-intrinsic epigenetic and genetic cues seem to be critical. Indeed, cortical progenitors14,15,16 and mouse embryonic stem cells (mESCs) programmed to cortical lineage17 recapitulate limited RGP lineage motifs in isolated cell culture, and thus in the absence of an endogenous stem cell niche. Furthermore, recent advances in recreating major stages of embryonic development in vitro have revealed that self-organizing principles are sufficient for pluripotent embryonic stem cell lineage progression within all three germ layers18,19,20. Here, we focus specifically on cortical organoid systems in which self-organization appears to be the major driver for the concerted three-dimensional structural assembly of cortical structures, with all major cell types, from a set of embryonic NSCs, closely recapitulating developmental processes and cortical tissue-specific features21,22,23,24. However, whether and how self-organization can instruct committed multipotent progenitor cells and orchestrate temporally stereotyped NSC lineage progression in order to produce faithful quantitative and qualitative postmitotic cell fates and cell-type diversity is not known. Here we utilized lineage tracing with true single-cell resolution in situ and in silico to decipher the neurogenic RGP proliferation behaviour in an in vitro organoid system. We found that in self-organizing cortical organoids, RGP lineage progression contrasts in specific aspects with the in vivo concept of linear, temporally stereotyped progression of RGP cell lineage. The genuine stem cell niche therefore seems to be essential for faithful temporal control of RGP lineage progression and the generation of cortical cell-type diversity at the clonal level.Organoids model in vivo developmentTo establish an in vitro system that allows the study of Emx1+ RGPs and their entire prospectively labelled lineage-related progeny, we conceived a genetic strategy to target the Emx1+ lineage (which generates most, if not all, cortical excitatory neurons and macroglia in vivo) in differentiating cortical organoids (Fig. 1a,b). We first crossed the Emx1-cre driver to the mTmG reporter system to label all cells derived from Emx1+ lineages with GFP in a tdTomato (tdT) background (that is, all Emx1− cells), isolated mTmG+/−;Emx1cre/+ blastocysts at E3.5, and derived mESCs. Immunohistochemistry using pluripotency markers (OCT3/4 and NANOG) and G-band karyotyping qualitatively validated the newly established mESC lines (Supplementary Fig. 1). Next, we generated mTmG+/−;Emx1cre/+ cortical organoids, isolated samples in a time course at differentiation day 8 (D8), D13, D20 and D25 (Fig. 1b–f), and subjected the samples to 10X FLEX single-cell RNA sequencing (scRNA-seq) (two independent cell lines and two batches each; Methods).Fig. 1: A mouse cortical organoid system recapitulates major aspects of in vivo corticogenesis at transcriptional single-cell level.a, Genetic strategy to permanently label cortical Emx1 lineage with GFP using a mTmG reporter and Emx1-cre driver. b, Schematic illustrating the experimental scRNA-seq approach to trace RGP lineage progression at the transcriptional level. Mice with mTmG reporter and Emx1-cre transgenes were crossed to generate mTmG+/−;Emx1cre/+ embryos (top) and blastocysts (bottom) for downstream processing (Methods). B27, B27 supplement; FBS, fetal bovine serum; KSR, knockout serum replacement; N2, N2 supplement. c–f, Wide-field images of mTmG+/−;Emx1cre/+ organoids at D8 (c), D13 (d), D20 (e) and D25 (f). Note, GFP+ cells reflect derivatives of Emx1+ progenitor cell lineages whereas tdT+ cells were derived from Emx1− progenitors. Organoids of this genotype were generated in at least three independent batches. Scale bars, 200 µm. g, UMAP and cell-type annotation of integrated organoid and in vivo mouse cells within the Emx1+ neuronal lineage: RGPs; Cajal–Retzius cells (CR); intermediate progenitors (IP); immature neurons (iNs); adult NSCs (aNSC), astrocyte intermediate progenitors (aIP) and oligodendrocyte intermediate progenitors (oIP); astrocytes (astro); oligodendrocytes (oligo); and olfactory bulb neuroblasts (OBNB). h, Overlap analysis of top 100 marker genes identified for each indicated cell type in organoid and in vivo mouse embryo. i, Relative abundance of cell types as described in g at distinct organoid differentiation and mouse in vivo time points. Note that aNSC also includes aIPs and oIPs. Data are represented as mean and individual data points of four biological replicates (organoid) or mean ± s.d. for three embryo datasets (this study and refs. 25,26). Numbers on the x axis indicate developmental age (1, E10–E11 or D8; 2, E13 or D13; 3, E16 or D20; 4, E18–P1 or D25). j, UMAP as depicted in g but separated by developmental time point for organoids (top) and embryos (bottom).After initial quality control of the scRNA-seq dataset, we identified Gfp+ cells from the Emx1+ lineage using dimensionality reduction and visualization using uniform manifold approximation projection (UMAP) (Supplementary Figs. 2 and 3). To identify the closest matching in vivo brain region for organoid cells, we used a spatially resolved in vivo scRNA-seq dataset25, which confirmed that only cells with a forebrain identity expressed Gfp. After extracting Gfp+ cells and removing cells with a transcriptional stress signature, we retained 1,302 to 9,220 high-quality cells per individual sample (Extended Data Fig. 1a–d). Next, we systematically compared in vitro organoid differentiation to corresponding in vivo embryo development. To align developmental age, we first made use of two previously published scRNA-seq datasets of mouse cortex development25,26, focusing on four key cell types: RGPs (declining abundance during development), intermediate progenitors (transient increase during development), neurons (increasing abundance during early development) and glia (increase towards end of embryonic development). This analysis revealed that: (1) D8, D13, D20 and D25 of organoid differentiation matched with embryonic day 10 (E10), E13, E16 and postnatal day 1 (P1) of mouse development, respectively; and (2) the qualitative trajectory (shape of the curve) of in vivo and in vitro development was remarkably similar, indicating comparable developmental dynamics (Extended Data Fig. 1e,f). On the basis of these findings, we generated 10X FLEX scRNA-seq datasets for mTmG+/−;Emx1cre/+ embryos at E10, E13, E16 and P1 (Fig. 1b) and produced UMAPs for clustering; Gfp detection confirmed specific Emx1 expression in forebrain tissue (Supplementary Figs. 4 and 5), and we retained 3,422 to 9,314 high-quality cells per time point (Extended Data Fig. 1a–d). Next, we directly compared both in vitro and in vivo datasets through data integration (Extended Data Fig. 2a). On the basis of marker gene expression, we identified all reported major cell types originating from Emx1-expressing RGPs in the developing cerebral cortex (Fig. 1g), and confirmed highly similar marker gene expression in comparable cell types in cortical organoids and embryos (Fig. 1h and Extended Data Fig. 2b,c). Finally, we assessed cell-type abundance and found high reproducibility between organoid batches (Fig. 1i) and remarkable overlap between matching organoid and embryo developmental time points (Fig. 1i,j). In conclusion, we show that cortical organoid and Emx1+ lineage differentiation at single-cell resolution closely resembles in vivo corticogenesis.MADM in the cortical organoid systemTo unequivocally probe NSC lineage progression in a self-organizing cortical organoid system in situ, we established MADM technology in mESCs (Fig. 2a). MADM enables cell lineage tracing at single-cell resolution, and provides unparalleled qualitative and quantitative information about birth order of clonally related cells, progenitor cell proliferation behaviour and potential2,3. The MADM system is based on Cre recombinase-mediated reconstitution of two split marker genes (Gfp and tdT) in genetically defined progenitor cells undergoing mitosis2,3 (Extended Data Fig. 3a,b). With the use of a temporally controlled tamoxifen-inducible CreER driver, MADM events permanently mark nascent daughter cells generated by a dividing progenitor cell and their respective lineages in two distinct fluorescent colours2,3 (Extended Data Fig. 3a,b). MADM can thus provide an optical readout of individual progenitor division patterns with precise temporal accuracy.Fig. 2: RGP cell lineage progression in cortical organoid system differs from the in vivo context.a, Illustration of the MADM system for neocortical stem cell lineage tracing in vivo (top, from refs. 1,56) and in vitro (bottom, this study) (Methods, ‘Induction of MADM clones in organoids’). Top right, one in six progenitors produce glia (star). Tam, tamoxifen. b, MADM clone induction protocol with 4-OHT administration at different developmental time points and collection at D20 for analysis. Onset of markers defining RGPs (PAX6), intermediate progenitors (TBR2) and the major cortical projection neuron classes are indicated (see Extended Data Fig. 4). c–f, Representative MADM clone. MADM-labelled cells across three sections (c–e) were reconstructed as maximum z-projections (f) with a total of 79 GFP+ and 95 tdT+ cells. Grey outlines indicate the organoid periphery. Scale bars, 25 µm. g, Average cell number per clone (D8, n = 109; D9, n = 46; D10, n = 93; D11, n = 50; D12, n = 61; D13, n = 68; D15, n = 40). Clone size decreased significantly over time (Kruskal–Wallis test, P < 0.0001). Pairwise comparisons on consecutive days showed no significance, except between D10 and D11 (multiple comparisons test, P = 0.0092). h–j, Illustrations (top; representative clones induced at D10 and analysed at D20 (left) and schematics (right)) of clone architectures and inferred division modes of RGPs, and quantification of cells (bottom) within the three MADM clone types (see Methods, ‘Image acquisition and analysis of MADM clones’). Average number of cells in proliferative (h), asymmetric neurogenic (i) and small neurogenic (j) clones induced on a single day between D8–D15 and analysed at D20. Clone size was significantly different across the period of induction for proliferative clones (h; D8, n = 53; D9, n = 20; D10, n = 46; D11, n = 18; D12, n = 17; D13, n = 13; generalized linear mixed model (GLMM) likelihood ratio test (LRT), P = 1.28 × 10⁻⁵), for asymmetric neurogenic clones (i; D8, n = 32; D9, n = 15; D10, n = 31; D11, n = 14; D12, n = 17; D13, n = 20; D15, n = 10; GLMM LRT, P = 0.018) and for small neurogenic clones (j; D8, n = 24; D9, n = 11; D10, n = 16; D11, n = 18; D12, n = 27; D13, n = 35; D15, n = 30; GLMM LRT, P = 0.037). g–j, Data are mean ± s.e.m. k, Stacked bar plot indicating the relative abundance of MADM clone architectures for each induction time point. Error bars indicate standard error of the proportion. D8, n = 109; D9, n = 46; D10, n = 93; D11, n = 50; D12, n = 61; D13, n = 68; D15, n = 40. n denotes the number of individual MADM clones (g–k). Scale bars, 50 µm. *P < 0.05, **P < 0.01, ***P < 0.001, ****P < 0.0001; NS, not significant (P ≥ 0.05).Source dataTo exploit the MADM paradigm in the cortical organoid system, we generated novel mESC lines (Supplementary Fig. 6) and first analysed MADM labelling at the population level (MADM-11GT/TG;Emx1cre/+; Extended Data Fig. 3b) in combination with specific markers. We observed an overall decrease in progenitors (PAX6+ RGPs and TBR2+ intermediate progenitors) as organoids developed, with a concomitant increase in postmitotic neurons (CTIP2+ and SATB2+) (Extended Data Fig. 4). To assess cell death, we performed caspase-3 immunostaining and observed that the overall proportion of MADM+caspase-3+ cells as a percentage of MADM+ cells was below 6% (on average across batches and differentiation time points), which was in a similar range to naturally occurring cell death rates in vivo1,27 (Extended Data Fig. 5a–i). We also showed that cell death was largely restricted to the core of the organoids (Extended Data Fig. 5j–s), in agreement with previous findings in human organoids28.To conduct MADM-based lineage tracing at the individual RGP level (Fig. 2a), we combined MADM reporter cassettes with the temporally inducible Emx1-creER driver (MADM-11GT/TG;Emx1-creER+/−). Previous efforts using such a genetic paradigm and utilizing progressive MADM clonal interval sampling in vivo have led to an inaugural quantitative framework of RGP lineage progression1, which will serve as a blueprint for subsequent analysis herein (Fig. 2a, top right). We therefore crossed the same MADM reporter-CreER driver mice as previously used for in vivo analysis, but instead of growing embryos to term, we isolated blastocysts and derived MADM-11GT/TG;Emx1-creER+/− mESC lines (Supplementary Fig. 7) for subsequent cortical organoid generation.Clonal analysis in cortical organoidsGiven that MADM mESCs have the identical genotype as in our previous in vivo experiments, we next pursued MADM-based clonal analysis with the use of 4-hydroxytamoxifen (4-OHT) and assessed RGP lineage progression in a self-organizing cortical organoid system. We conceived a systematic MADM clone induction paradigm (Fig. 2b) with the goal of obtaining around one cluster of red and green MADM-labelled cells per organoid. Individual MADM clones were digitally reconstructed for quantification29 (Fig. 2c–f). We induced MADM clones starting at D8 and up to D15 with analysis at D20. The average MADM clone size appeared smaller than in vivo (up to twofold even at the earliest differentiation stage) but decreased significantly over time, consistent with diminishing progenitor potential. However, pairwise comparisons of average clone size between consecutive clone induction time points were rarely significant in cortical organoids (Fig. 2g), unlike in vivo, where clonal output decreased exponentially and significantly between corresponding developmental time points1.Previous work has demonstrated that RGP proliferation behaviour correlates with lineage progression, whereby at early developmental stages, RGPs exclusively divide symmetrically to amplify their pool (proliferative division), followed by a self-renewing asymmetric neurogenic division mode1. Therefore, we next analysed MADM clones to infer progenitor division mode (Fig. 2h–j and Extended Data Fig. 6) in cortical organoids by applying the same MADM-defined clone classes, which remain applicable despite incomplete layering, as in previous in vivo experiments1. Whereas we observed both proliferative and asymmetric neurogenic division modes, we also noted a sizeable fraction of clones that did not fall into any of the above categories, which we termed ‘small neurogenic’.Next, we quantified progenitor potential and output by taking into account progenitor cell division mode. Proliferative clone size in organoids decreased gradually over time from 44.17 ± 4.5 at D8 to 14.46 ± 2.1 at D13 (Fig. 2h), and was almost half the size on average at D10 (37.07 ± 3.69 cells per clone) when compared to proliferative clones in vivo at E10 (71.2 ± 8.3 cells per clone1 (Extended Data Fig. 7a–c); note that E10 and D10 are comparable transcriptionally (Extended Data Fig. 1e)). The output potential of the two sister RGPs emerging from a proliferative mother RGP in vivo was shown to be very similar (that is, mean ratio of larger/smaller sister subclone in the range of about 1.6) across time and thus within the full spectrum of clone sizes. However, in cortical organoids, sister RGPs showed less correlated proliferation potential, especially at early differentiation time points (Extended Data Fig. 7d). Despite a progressive decrease in asymmetric clone size and an absence of small neurogenic clones in vivo during the neurogenic phase (E12–E16), the reductions in size of asymmetric and small neurogenic clones in organoids were less pronounced over time (Fig. 2i,j and Extended Data Fig. 8).Next, we quantified the abundance of all three MADM clone architectures (inferred progenitor division mode) for each clone induction time point (Fig. 2k). Of note, all three progenitor division modes occurred concurrently at every clone induction time point. Proliferative divisions persisted until late differentiation stages; asymmetric neurogenic divisions did not become predominant, but instead small neurogenic clone architectures increased over time. Although smaller clone sizes also appeared at later developmental stages in vivo owing to decreasing progenitor potential1,30, small neurogenic clones were not detected when MADM events were induced at earlier developmental stages such as E10, a stage at which RGPs were found almost exclusively (96.7%) in symmetric proliferative division mode in vivo1 (Extended Data Fig. 7a–c).The presence of high numbers of small neurogenic clones, even for clones induced at early differentiation stages, could reflect false positives, in the sense that an increased rate of cell death over time would ‘erode’ original large proliferative clones to small sizes, which would thus ultimately appear as small neurogenic clones. To test this possibility, we assessed MADM clones 5 days earlier (that is, at D15 rather than at D20) and determined their relative abundance compared to D20 (Extended Data Fig. 9). We utilized NEUROD2 (a marker for postmitotic nascent projection neurons) immunostaining and reasoned that (1) a small neurogenic clone would contain only NEUROD2+ cells; (2) in an asymmetric neurogenic clone the smaller subclone would contain only NEUROD2+ cells; and (3) a proliferative clone would contain NEUROD2− cells in both subclones. We induced clones at D8, D10 and D11 with analysis at D15, but found similar relative proportions of clone architectures for all three induction time points when compared to the data obtained at D20 (Extended Data Fig. 9k–m). Thus, cell death seems to not be a major factor influencing the interpretation of our data, although we cannot exclude the possibility that sparse, sporadic cell death may eliminate some cells. Nevertheless, small neurogenic clones represent an organoid-specific clone type that is not observed in vivo.We found that rosette size did not correlate with abundance of any clone type, but small neurogenic clones had a significantly smaller spread across sections compared with asymmetric neurogenic clones (Extended Data Fig. 10a–c). Using optical clearing methods, we observed that gross organoid morphology did not correlate with specific abundance of any of the three clone types (Extended Data Fig. 10d–h).Organoids were competent to switch from neurogenesis to gliogenesis. Whereas at D20 organoids contained very few glia, around 46% of all clones contained glia at D25, and a large fraction of clones with more than 30 neurons contained glia at D25, similar to the in vivo paradigm (Extended Data Fig. 11). Together, the above findings in self-organizing cortical organoids contrast with the in vivo concept of linear, temporally stereotyped progression of RGP cell division mode from strictly proliferative to exclusively asymmetric neurogenic, while still sequentially executing the switch from neurogenic to gliogenic.RGP lineage restriction in organoidsIndividual RGPs in vivo are multipotent and generate both CTIP2+ subcerebral projection neurons (SCPNs) and SATB2+ callosal projection neurons (CPNs) in a temporally sequential manner, with SCPNs produced predominantly at early neurogenic stages and CPNs produced at later neurogenic stages7,26,31. To assess RGP multipotency in cortical organoids, we induced MADM clones at D8 (early) and D13 (late) differentiation stages, and monitored the presence of clonally related CTIP2+ and SATB2+ cells within individual MADM clones (Fig. 3a–j). We found a large number of MADM clones that contained CTIP2+ SCPNs but no SATB2+ CPNs, and conversely, a substantial number of clones that contained SATB2+ CPNs but no CTIP2+ SCPNs. Lineage restriction was found in MADM clones induced at D8 (35.6% of clones) and D13 (32.1% of clones), and among all three types of clone architecture (that is, proliferative, asymmetric neurogenic and small neurogenic), regardless of batch (Fig. 3k and Supplementary Fig. 8). When compared to the in vivo condition, in which around 3% of RGP clones showed some bias towards either SCPN or CPN1,9, lineage restriction in the cortical organoid system was increased by an order of magnitude (Fig. 3l).Fig. 3: RGPs show a high level of lineage restriction in organoid system.a–e, A representative proliferative MADM clone, induced at D8 and analysed at D20, with lineage restriction towards CTIP2+ cells. The clone is depicted in consecutive sections immunostained for GFP, tdT, CTIP2 and SATB2 (a–d) and as a reconstruction (e). The clone contained 37 cells (30 CTIP2+, 0 SATB2+ and 7 SATB2−CTIP2− cells). f,g, A representative small neurogenic clone, induced at D8 and analysed at D20, with lineage restriction towards SATB2+ cells. The clone is depicted immunostained for GFP, tdT, CTIP2 and SATB2 (f) and as a reconstruction (g). The clone contained 4 cells (4 SATB2+ and 0 CTIP2+ cells). Note that D8 corresponds to an early differentiation time point whereby RGPs at a comparable developmental stage in vivo mostly produce CTIP2+ neurons. h,i, A representative small neurogenic clone, induced at D13 and analysed at D20, with lineage restriction towards CTIP2+ cells. The clone is depicted immunostained for GFP, tdT, CTIP2 and SATB2 (h) and as a reconstruction (i). The clone contained 2 cells (0 SATB2+ and 2 CTIP2+ cells). Note that D13 corresponds to a late developmental stage, in which RGPs in vivo mostly produce SATB2+. j, Colour scheme indicating cell-type identities in e,g,i. k, Bar plot indicating the percentage of proliferative, asymmetric neurogenic and small neurogenic clones with lineage restriction towards CTIP2+ or SATB2+, induced at D8 (left; proliferative, n = 37; asymmetric, n = 28; small, n = 22) or D13 (right; proliferative, n = 24; asymmetric, n = 31; small, n = 23) and analysed at D20. Error bars indicate standard error of the proportion. l, Percentage of total lineage-restricted MADM clones induced at D8 (n = 87; 31 out of 87 clones, 35.6%) and D13 (n = 78; 25 out of 78 clones, 32.1%) in organoids, and in vivo (n = 386; 11 out of 386 clones, 2.85%; see Methods, ‘Laminar positioning in MADM clones’). Data are mean + standard error of the proportion. Chi-square test: D8 versus in vivo P ≤ 0.0001; D13 versus in vivo P ≤ 0.0001. n denotes the number of individual MADM clones (k,l). Scale bars, 50 µm.Source dataTo corroborate the above findings using a different methodology and to gain further insight into the transcriptomic features of lineage-restricted clones, we established MADM-CloneSeq32 in cortical organoids. This approach combines MADM clone generation with scRNA-seq in situ to determine the transcriptional identity of clonally related cells, offering an unprecedented correlation of lineage relationship, progenitor division mode and transcriptomic features while preserving spatial information (Fig. 4a). In total, we collected 287 cells from 68 asymmetric neurogenic and small neurogenic MADM clones induced at D13 from 45 cortical organoids and performed RNA sequencing using SMART-seq v3 technology (Fig. 4a). To assess the transcriptional identity of MADM-CloneSeq cells, we created an integrated scRNA-seq dataset, including MADM-CloneSeq cells, 64,647 cells from all mTmG;Emx1-cre organoid replicates (RGP, intermediate progenitor and neurons from D13, D20 and D25; see above), and 49,039 cells from an in vivo developmental time course of cortical development (E12–P126; Methods). By using reference annotation and marker gene expression, we annotated neurons with upper layer (UL) and deep layer (DL) identity (Fig. 4b) in the reference dataset and confirmed the presence of neurons with UL or DL transcriptional identity in our organoid scRNA-seq dataset (Extended Data Fig. 12a,b). We applied a stringent filtering pipeline and retained 195 MADM-CloneSeq cells from 21 asymmetric neurogenic and 34 small neurogenic clones that were similar in quality and clone coverage (Extended Data Figs. 12c,d and 13a). Cells associated with asymmetric neurogenic and small neurogenic clones showed no major transcriptional differences, based on the analysis of projecting MADM-CloneSeq cells onto the reference UMAP and nearest neighbour analysis (Fig. 4b–d and Extended Data Fig. 13b). We assigned each MADM-CloneSeq cell to DL and UL neuronal identities to unequivocally identify lineage-restricted clones (Extended Data Figs. 12a and 13c–e). Notably, we found lineage-restricted clones among both asymmetric and small neurogenic clones with similar abundance, as reported for histological analysis (Chi-square test, P > 0.3) (Extended Data Fig. 13d). To test whether lineage restriction observed in organoids was associated with putative developmental delay, we performed pseudotime analysis of asymmetric and small neurogenic clones (Fig. 4e–h) and found no significant difference between lineage-restricted and non-restricted (translaminar) small neurogenic clones (Fig. 4h).Fig. 4: MADM-CloneSeq in combination with scRNA-seq reveals a single developmental trajectory of RGP lineage progression to generate all neuronal cell types in a cortical organoid system.a, Schematic illustrating the MADM-CloneSeq experimental workflow in cortical organoids containing asymmetric neurogenic and small neurogenic clones induced at D13 and collected at D20. Cell collection scheme adapted from ref. 32, CC BY 4.0 (http://creativecommons.org/licenses/by/4.0/). b–d, Projection of 195 MADM-CloneSeq cells on a reference UMAP showing all cells (b), neurons from asymmetric neurogenic clones (c) and neurons from small neurogenic clones (d), in the context of a reference cell-type atlas26. APs, apical progenitors. e,f, UMAPs as depicted in c,d, but with reference cells coloured on the basis of pseudotime analysis. g, Box plots comparing pseudotime distribution of neurons from asymmetric (asym.) and small neurogenic clones (Welch’s two-sample t-test P value = 0.005, two-tailed). Note, although the variation of pseudotime within the small neurogenic clone cells was significantly smaller than in asymmetric neurogenic clone cells (asymmetric, 4.91; small, 1.56), resulting in a significant difference, the absolute difference in pseudotime was still small. These data indicate that small neurogenic clones are likely to be generated within a smaller temporal window. Asymmetric, n = 109 cells; small, n = 86 cells. h, Box plots comparing pseudotime distribution of neurons from DL-restricted, UL-restricted or translaminar small neurogenic clones (two-way ANOVA with Tukey’s honest significant difference P value = 0.9). g,h, The centre line indicates the median, box limits show the 25–75% interquartile range (IQR), whiskers extend to include the furthest data points within 1.5× the interquartile range from box edges, and data points outside this range are represented as dots. n = 16 translaminar, n = 11 DL-restricted, n = 7 UL-restricted. i, Overview of scRNA-seq analysis in mTmG;Emx1cre/+ cortical organoids. Emx1+ neuronal lineage cells were extracted (black dots) and subjected to dimensionality reduction, clustering and trajectory analysis. j, UMAPs with cell types as in Fig. 1g and predicted trajectories using different dimensionality reduction and clustering parameters. For details see Extended Data Fig. 15.Source dataUnitary lineage trajectory in organoidsThe presence of lineage-restricted and small neurogenic clones in the organoids raised the question about putative differences in RGPs and/or their lineage trajectories in vivo versus in vitro. However, scRNA-seq analysis did not show any indication of an organoid-specific RGP population, but instead indicated a homogenous pool of RGPs (Fig. 1g,j). Yet, direct analysis of transcriptional differences between organoid and embryonic RGPs revealed hundreds of differentially expressed genes (DEGs) that were largely specific for a particular developmental age (Extended Data Fig. 14a–c). Gene Ontology (GO) term analysis indicated that these DEGs were connected to biological processes such as regionalization, metabolism, development and signalling (Extended Data Fig. 14d–g). To assess whether gene expression differences in organoid RGPs might have an effect on their developmental trajectories, we focused on the integrated organoid scRNA dataset. We performed UMAP clustering and trajectory analysis using slingshot and identified a single unitary trajectory connecting RGPs via intermediate progenitors to neurons, which was consistent using several different UMAP and clustering parameters (Fig. 4j and Extended Data Fig. 15). However, we do not exclude the possible presence of minor diverging sublineages or subtle progenitor heterogeneity. On the basis of the above results, we conclude that RGPs in self-organizing cortical organoids form a transcriptionally uniform group of progenitor cells, despite showing distinct proliferation (division) patterns at any given differentiation time point, and demonstrating lineage restriction in one-third of cases in clonally related progenies.DiscussionSelf-organization constitutes a major factor that regulates a range of developmental processes without significant control from external agents33. Recent work has demonstrated that self-organization instructs the faithful formation of all germ layers and major tissues in embryos from pluripotent embryonic stem cells in isolated culture systems34,35,36,37. Here, to test the rigidity of self-organization in driving stem cell lineage progression, we probed lineage progression of RGPs (representing committed multipotent NSCs) in a cortical organoid culture system derived from mESCs. By using MADM-based clonal analysis, we determined the potential, proliferation behaviour and lineage progression of RGPs across differentiation at single-cell level. As a blueprint for comparison to the in vivo context, we leveraged our previously established framework that emerged from lineage tracing experiments that used identical genetic constituents for marking RGPs and their clonal progeny1. Whereas RGP lineage progression follows a strict linear and temporally stereotyped proliferation pattern and output potential in vivo, RGPs at any differentiation time point in organoids showed no bias in cell division capacity (Fig. 5) and more variable neuron output potential. At the qualitative level, RGP lineages in cortical organoids showed a high level of lineage restriction (that is, strong bias towards reduced neuron diversity within units of clonally related cells) independent of the differentiation time point. Thus, the integrity of developmental and/or temporal progression was lost or severely altered, possibly resulting in more flexible and/or permissive competence windows. Of note, the generation of glia occurred strictly after neurogenesis, similar to a number of stem cell niches in vivo1,32,38,39.Fig. 5: RGP cell lineage progression models in vivo and in a self-organizing cortical organoid system.a–c, Schematic illustrating cortical RGP lineage progression in vivo and in vitro during early (a), mid (b) and late (c) corticogenesis. a, In vivo, RGPs divide in a proliferative (prolif., symmetric division) manner (black) at the onset of corticogenesis, whereas in vitro we observed proliferative (black), asymmetric neurogenic (blue) and small neurogenic (light blue) RGP clone architectures concurrently, implying the respective division modes and thus no division mode bias at early stages of organoid differentiation. b, During mid neurogenesis, in vivo RGPs divide in an asymmetric manner (blue), producing post-mitotic neurons or intermediate progenitors with each division. RGPs in vitro continue to produce all three clone types until at least D13, after which we observe asymmetric and predominantly small neurogenic divisions. c, Once neurogenesis is complete, both in vivo and in vitro RGPs undergo neurogenic-to-gliogenic transition. In mice, gliogenesis begins around birth, whereas in organoids we observed the first glia at approximately D20, peaking at D25. d,e, Summary of RGP lineage progression in mouse (d) and the mouse cortical organoid system (e) over time. The black line represents proliferative divisions, the dark blue line represents asymmetric neurogenic divisions, and the light blue line represents small neurogenic divisions observed in the mouse cortical organoid system. f, Summary of RGP lineage restriction in the cortical organoid system over time. At both D8 and D13, around one-third of RGPs generate exclusively SCPNs or CPNs. Compared with estimated lineage restriction in vivo, the observed rates in the organoid system were about an order of magnitude higher.RGPs in vivo have been shown to exhibit a certain level of plasticity in response to a changing environment40. Thus, the absence of an endogenous stem cell niche and therefore various altered non-cell-autonomous cues in cortical organoids could result in altered temporal plasticity and/or sensitivity to the in vitro tissue environment. Although the precise nature of the non-cell-autonomous, niche-derived cues remains unclear, a variety of factors have been implicated, also considering radial glial development in humans8,41. Extracellular matrix42, extracellular vesicles43,44, mechanical support cells such as the radial glial fibre grid45,46, microglia47, immature nascent projection neurons, the absence of interneurons, blood vessels, choroid plexus and cerebrospinal fluid, missing axon targets (ref. 48 and references therein) and certain metabolic microenvironments28 could have effects on RGP lineage progression. Of note, our comparison of RGPs from distinct in vivo and in vitro niche environments indicates that predictions of biological function of DEGs using GO suggest metabolic changes, altered cell–cell interactions (adhesion) and responses to external signalling cues. Thus, our gene expression data may provide some basis for future hypothesis generation and directions.Our clonal dataset could imply that the entire population of RGPs in cortical organoids are more plastic and responding increasingly or only to stochastic means. Alternatively, they may have differentiated into distinct RGP types and/or RGP cell states (owing to the altered cellular environment) that would directly or indirectly result in the observed diversity of lineages, including the prominent small neurogenic clones and increased lineage-restricted clones. Prior studies have probed RGP cell and lineage diversity in vivo by using fate mapping49,50 and/or transcriptome assessment at the single-cell level26,51. At the population level and depending on the phenotype manifestation, RGP lineages may be grouped into distinct classes52. Yet, scRNA-seq data do not show significant clustered gene expression that would segregate and/or correlate with distinct RGP types at the transcriptional level in vivo. Our data show that RGPs in cortical organoids also form a uniform group of progenitors with a unitary lineage trajectory, similar to in vivo data26,53, despite altered proliferation behaviour and output. Prospective probing of RGP lineage progression rules in isolated systems across species, including human in normal and pathogenic conditions54,55, will help us to decipher the principles that drive NSC evolution and the aetiology of neurodevelopmental diseases.MethodsMaintenance of mouse linesAll animal procedures were approved by the Austrian Federal Ministry of Women, Science and Research in accordance with the Austrian and European Union animal law (license number: BMWF-66.018/0007-II/3b/2012; BMWFW-66.018/0006-WF/V/3b/2017; GZ: 2020-0.579.989 and GZ: 2025-0.597.515). Experimental mice were bred and maintained according to regulations approved by the institutional animal care and use committee and institutional ethics committee and the guidelines of the preclinical facility (PCF) at ISTA. Mice with specific pathogen-free status according to FELASA recommendation57 were bred and maintained in experimental rodent facilities (room temperature 21 ± 1 °C (mean ± s.e.m.); relative humidity 40–55%; photoperiod 12 h light:12 h dark). Food (V1126, Ssniff Spezialitaten) and tap water were available ad libitum. Mouse lines with MADM cassettes inserted on chromosome 1158, Emx1-cre59, Emx1-creER60 and mTmG reporter61 have been reported previously and were used to generate experimental mice. All mouse lines were kept in a mixed C57/Bl6 and CD1 genetic background. Mice were used at an age range of 2–8 months for general breeding, 2–4 months (females) for collecting blastocysts, and at P21 for clonal analysis experiments in vivo. All efforts were made to minimize the number of animals by following the 3R principles.Timed breeding and superovulation for the generation of genetically defined blastocystsMADM-11TG/TG and MADM-11GT/GT;Emx1cre/+ or MADM-11GT/GT;Emx1-creER+/− stock mice were crossed to generate MADM-11GT/TG;Emx1cre/+ or MADM-11GT/TG;Emx1-creER+/− blastocysts, respectively. For scRNA-seq experiments (see ‘scRNA-seq’), mTmG reporter mice were crossed to Emx1cre/+ mice to generate mTmG;Emx1cre/+ blastocysts. Superovulation was performed according to the ISTA Preclinical Facility protocol. In brief, to synchronize the oestrous cycle and induce superovulation, 0.1 ml (5 IU) pregnant mare serum gonadotropin (PMSG; Sigma) was administered by intraperitoneal injection during the afternoon (between 16:00 and 18:00) of day −3 before ovulation. On day −1 (46–48 h after PMSG), 0.1 ml (5 IU) human chorionic gonadotropin (Sigma) was administered by intraperitoneal injection and the female immediately added to the male cage. Hormones in lyophilized powder form were resuspended in Dulbecco’s PBS (Sigma) and stored in aliquots at −20 °C until use.Derivation and culture of mESCsBlastocyst collection at E3.5 and derivation of mESCs from individually cultured blastocysts were performed as described previously62. Blastocysts were flushed from the uterine horn with M2 medium (Sigma) using a syringe, collected with a micropipette and washed with 1 ml of M2 medium. Blastocysts were cultured for up to 24 h in KSOM medium (Sigma) until expansion of the blastocoel and/or hatching was observed. Each blastocyst was transferred to a single well in a 96-well plate that was prepared with mouse embryonic fibroblasts (MEFs; Thermo Fisher Scientific) the day before at a density of 1.5 × 10⁴ cells per well. Blastocysts were cultured in KO-DMEM (Thermo Fisher Scientific) medium containing 15% knockout serum replacement (Thermo Fisher Scientific), 1 mM sodium pyruvate (Thermo Fisher Scientific), 0.1 mM non-essential animo acids (Thermo Fisher Scientific), 0.1 mM 2-mercaptoethanol (Sigma), 2 mM GlutaMAX (Thermo Fisher Scientific), 50 U ml−1 penicillin/streptomycin (Thermo Fisher Scientific), 2i (1 µM PD0325901 and 3 µM CHIR99021, Sigma) and LIF (1 2 ng ml−1, batch tested, Thermo Fisher Scientific). Once large outgrowth was observed (~7 days) the cells were passaged for the first time. mESCs were maintained on MEFs in medium containing ES-qualified FBS (Thermo Fisher Scientific)/LIF, with passaging every 3 days on average. mESCs were moved off MEFs 2 passages before generating organoids, and were plated on EmbryoMax 0.01% gelatin (Sigma) coated wells in medium containing FBS/LIF/2i63 for a maximum of 10 passages. mESCs were routinely tested for mycoplasma using the LookOut Mycoplasma PCR Detection Kit (Sigma). Standard cell culture conditions (37 °C with 5% CO2) were used throughout all procedures. Early passage (P3–P8) cells were frozen in liquid nitrogen cryovials in large stocks, using ES-qualified FBS with 20% DMSO as the freezing medium. Early passage stocks were used for all experiments (final passage of cells used to make organoids between P8 and P15).Methanol fixation for karyotyping of mESC linesMethanol fixation was performed according to instructions provided by Cell Guidance Systems’ karyotyping service. In short, cell cultures in 6-well plates were incubated with medium supplemented with 10 µg µl−1 KaryoMAX colcemid solution (Thermo Fisher Scientific) for 30 min at 37 °C. Medium was removed and colonies were dissociated with 400 µl of pre-warmed 0.05% Trypsin EDTA (Thermo Fisher Scientific) for 5 min at 37 °C. Trypsin was deactivated with 800 µl of warm medium and cells were transferred to a 15 ml conical tube and centrifuged for 5 min at 200g. The supernatant was discarded and the cell pellet was broken by flicking the tube 20 times. Cells were treated with 2 ml of warm 0.075 M KCl drop by drop, followed by a further 2 ml dispensed slowly down the wall of the tube. The suspension was mixed by inversion and incubated for 15 min at 37 °C. Next, 10 drops of cold freshly prepared fixative (3 parts methanol (VWR) to 1 part acetic acid (VWR) by volume) were added, using a 1 ml Pasteur pipette. The suspension was mixed by gentle inversion. Samples were centrifuged for 5 min at 150g, the supernatant was discarded and the pellet was broken by flicking the tube 20 times. Cells were washed with 4 ml of cold fixative, added very slowly, and centrifuged for 5 min at 150g. The supernatant was discarded, pellet broken, and cells were finally resuspended in 1.5 ml fixative. Samples were shipped off to Cell Guidance Systems’ karyotyping service. Chromosome 8 and 11 abnormalities have been previously reported in mESC lines64,65.Metaphase spread for chromosome countsCells for metaphase chromosome spreads were fixed as described above. In preparation, Superfrost glass slides (Thermo Fisher Scientific) were cooled at −20 °C for 5 min. 100 µl of the fixed cell suspension was dropped, as a single drop, from 10–15 cm above the slide. The slide was air dried, and a coverslip was placed with Mowiol 4-88 (Carl Roth) and 1,4-diazabicyclooctane (Carl Roth) with DAPI (4′,6-diamidino-2-phenylindole, Thermo Fisher Scientific, 1:5,000 dilution) to stain DNA. Slides were imaged with a Plan-Apochromat 40×/1.2 water immersion objective using an inverted LSM 800 series confocal microscope (Zeiss), and images were processed using Zeiss ZEN Blue 2.3 and 2.6 software (Zeiss). Chromosomes were counted manually in the Zeiss ZEN Blue 2.6 software (Zeiss) and plotted using Graphpad Prism 10.2.2 (Dotmatics) software.Generation of cortical organoidsmESCs were plated at high density so that colonies covered approximately half of the well area after 2 days of incubation. Medium was changed 1–2 h prior to dissociation with StemPro Accutase (Thermo Fisher Scientific) or CTS TrypLE (Thermo Fisher Scientific) for 5 min at 37 °C. Cells were counted with an automated cell counter, and were used only if >90% of cells were alive based on Trypan blue staining (Thermo Fisher Scientific). mESCs were centrifuged for 5 min at 200g, resuspended in Solution 1, and plated at a density of 3,500 cells per microwell in a 24w-Aggrewell plate (Stem Cell Technologies). Solution 1 contained G-MEM (Thermo Fisher Scientific), 10% knockout serum replacement (Thermo Fisher Scientific), 1 mM sodium pyruvate, 0.1 mM non-essential amino acids, 0.1 mM 2-mercaptoethanol, 2 mM GlutaMAX, 50 U ml−1 penicillin/streptomycin and Wnt inhibitor (3 µM, IWR1, Sigma). No SMAD inhibitors were used as they were not required to direct cortical differentiation in mouse66. Embryoid bodies were generated by D1, which were then transferred to 10 cm dishes with fresh Solution 1 and 2% growth factor-reduced Matrigel (Corning). On D5, organoids were gently pipetted to remove Matrigel and Solution 2 was added, containing DMEM/F12 (Thermo Fisher Scientific), 1% N2 supplement (Thermo Fisher Scientific), 0.1 mM non-essential amino acids, 2 mM GlutaMAX, 50 U ml−1 penicillin/streptomycin, 1% chemically defined lipid concentrate (Thermo Fisher Scientific), and heparin (1 μg ml−1; Sigma). On D7, organoids were transferred to 6-well plates and placed on an orbital shaker at low speed (50 rpm) to prevent organoid fusion. From D9, organoids were grown in medium containing a 50:50 mix of DMEM/F12 and Neurobasal (Thermo Fisher Scientific), 0.5% N2, 1% B27 (Thermo Fisher Scientific), 0.5 mM non-essential amino acids, 2 mM GlutaMAX, 50 U ml−1 penicilin/streptomycin, 1% chemically defined lipid concentrate, and 50 μM 2-mercaptoethanol. Throughout the protocol medium was replaced as necessary every 2–3 days, and orbital shaker speed was increased after D9 (80 rpm). Fused organoids and/or organoids that failed to grow were discarded throughout the procedure. Standard cell culture conditions (37 °C with 5% CO2) were applied throughout all procedures.Induction of MADM clones in cortical organoidsStock solutions of 4-hydroxytamoxifen (4-OHT, Sigma) were generated by dilution in 100% ethanol to a concentration 1,000-fold greater (20–80 µM) than the working solution. 4-OHT was titrated in order to generate ~1 clone per organoid on average, which varied per time point: a maximum of 80 nM for D8, 40 nM for D9–D12, 60 nM for D13, and 80 nM for D15. If 4-OHT treatment occurred on a day without medium change, medium was removed from wells containing organoids to be treated and placed in a tube, 4-OHT was added, and medium was added back to wells. After 24 h, medium was completely replaced and organoids were washed once with PBS. Organoids were collected at D20 for MADM clonal analysis, except for astrocyte analysis, which included collection at D25. For MADM clone analysis, each clone initiation time point included clones from 3 cell lines and 3 differentiations, except for D9, D11 and D12, which included clones from 2 cell lines and 4 differentiations. The numbers of clones per organoid per clone initiation time point were as follows: D8–D20 (109 clones/100 organoids = 1.09), D9–D20 (46 clones/49 organoids = 0.94), D10–D20 (93 clones/165 organoids = 0.56), D11–D20 (50 clones/67 organoids = 0.75), D12–D20 (61 clones/50 organoids = 1.22), D13–D20 (68 clones/133 organoids = 0.51), D15–D20 (40 clones/63 organoids = 0.63) and D8–D25 (39 clones/92 organoids = 0.42).Induction of MADM clones in vivoMADM clone induction in vivo was performed as described56,58. In brief, MADM-11GT/TG;Emx1-creER+/− experimental mice were generated by crossing MADM-11GT/GT;Emx1-creER+/− with MADM-11TG/TG mice. Timed pregnant females were administered 2 mg tamoxifen (Sigma) dissolved in corn oil (Sigma) by intraperitoneal injection at E10 to induce MADM clones. Live embryos were recovered via caesarean section at E18–E19 and fostered until P21. Both male and female specimens were used. In total, 30 MADM clones were obtained from 37 brains, averaging 0.81 clones per brain.Tissue collection and cryosectioningOrganoids were fixed for 4 h or overnight in 4% paraformaldehyde (Sigma). Tissue collection from mice was performed according to previously described protocols56. Mice were deeply anaesthetized with an intraperitoneal injection of ketamine/xylazine (65 mg kg−1 and 13 mg kg−1 body weight, respectively), and were confirmed to be unresponsive through pinching the paw. Perfusion was performed with ice-cold PBS followed by ice-cold 4% paraformaldehyde prepared in PBS using a peristatic pump (Carl Roth, 4–6 ml min−1). Mouse brains were further fixed overnight in 4% paraformaldehyde, then washed with PBS. Organoids and mouse brains were cryopreserved with 30% sucrose in PBS for 1 and 2–3 days, respectively. Tissues were embedded in Tissue-Tek O.C.T. (Sakura) and stored at −20 °C or −80 °C until further use. All samples were cryosectioned using a CryoStar NX70 cryostat (Thermo Fisher Scientific). Brains were sectioned coronally (45 µm thickness) and were collected in PBS, and mounted onto glass slides in sequential order. Organoids were sectioned (40 µm thickness) and directly mounted onto Superfrost glass slides (Thermo Fisher Scientific). Mounted sections were air dried while protected from light and processed immediately for analysis (mouse tissue) or were stored at −20 oC until use (organoid).ImmunostainingCryosections mounted on glass slides were first rehydrated with PBS for 15 min at room temperature. For antibodies requiring antigen retrieval (PAX6, TBR2, CTIP2, SATB2, OCT3/4, NANOG and GFAP), samples were incubated in citrate buffer (10 mM citric acid, 0.05% Tween-20; pH 6.0) for 25 min at 85 °C. After cooling to room temperature and washing 3× with PBS, samples were incubated for 2 h at room temperature in blocking solution (0.5% Triton X-100 (Thermo Fisher Scientific) with 10% Donkey Serum (Thermo Fisher Scientific) in PBS. Primary antibodies were diluted in blocking solution, and samples were incubated for 16–72 h at 4 °C. After washing (3× 15 min) with PBS, secondary antibodies were diluted in blocking solution, and samples were incubated for 2–24 h at room temperature. After washing (3× 15 min) with PBS, cell nuclei were stained with DAPI (Thermo Fisher Scientific, 1:5,000 dilution) for 15 min. All sections were mounted using Mowiol 4-88 (Carl Roth) and 1,4-diazabicyclooctane (Carl Roth) and stored at 4 °C until image acquisition.AntibodiesPrimary antibodies and dilution factors included chicken anti-GFP (Aves, GFP1020, 1:1,000), goat anti-tdTomato (SICgen, ab8181-200, 1:1,000), rabbit anti-PAX6 (Cell Signaling, 60433S, 1:500), rat anti-TBR2 (Thermo Fisher Scientific, 14-4875-82, 1:400), rat anti-CTIP2 (ab18465, 1:400), mouse anti-SATB2 (Abcam, ab51502, 1:200), rabbit anti-NANOG (Abcam, ab80892, 1:500), mouse anti-OCT3/4 (Santa Cruz, sc5279, 1:200), rabbit anti-GFAP (DAKO, Z0334 1:1,000), rabbit anti-NEUROD2 (ab109406, 1:200) and rabbit anti-CASPASE3 (Cell Signaling, 9661S, 1:400). Secondary antibodies and dilution factors included donkey anti-chicken-Alexa488 (Jackson Immuno, 703-545-155, 1:1,000), donkey anti-goat-Alexa568 (Invitrogen, A11057, 1:1,000), donkey anti-goat-CY3 (Jackson Immuno, 705-165-147, 1:1,000), donkey anti-rat-Alexa594 (Life Technologies, A21205, 1:1,000), donkey anti-mouse-Alexa647 (Life Technologies, A32787, 1:1,000) and donkey anti-rabbit-Alexa647 (Life Technologies, A31573, 1:1,000). For MADM clones that were immunostained with GFAP (using donkey anti-rabbit-Alexa647), we used donkey anti-chicken-Alexa488 and donkey anti-goat-Alexa568 for immunostaining of MADM-labelled cells. For MADM clones that were immunostained with SATB2 (donkey anti-mouse-Alexa647) and CTIP2 (donkey anti-rat-Alexa594), we used donkey anti-chicken-Alexa488 and donkey anti-goat-CY3 for immunostaining of MADM-labelled cells.Image acquisition and analysis of MADM clonesBefore image acquisition, immunostained samples were first screened for MADM clones using an axioscope (Zeiss Axio Imager, Zeiss) coupled to a CoolLED p300 SB light source (CoolLED) and equipped with Plan-Apochromat 10×/0.45 and 20×/0.8 objectives (Zeiss). Green and red fluorescence were observed using an HC-dualband GFP/DsRed filter (F56-420, AHF). The presence of MADM-labelled cells was documented for subsequent confocal image acquisition. Organoid and mouse brain MADM clones were imaged with a Plan-Apochromat 20×/0.8 objective using an inverted LSM 800 series confocal microscope (Zeiss), and images were processed using Zeiss ZEN Blue 2.3 and 2.6 software (Zeiss). Confocal images were acquired in z-stacks and tiles with excitation lasers 405, 488, 561, and 640 nm. Five-channel imaging (DAPI, GFP, tdT, CTIP2 and SATB2) was specifically performed with a Leica Stellaris 5 series confocal microscope (Leica) and an HC PL APO 20×/0.75 CS objective, using a white light laser optimized by the software for all fluorophores (A488, CY3, A594, A647) except DAPI (excitation laser 405). Images were processed using LAS X 2.5.7.23225 (Leica) software. Images were imported into ImageJ (Fiji) where MADM-labelled cells were manually counted based on marker expression. MADM clone architecture was reconstructed by using previously published protocols29. In short, proliferative clones are clones in which subclone sizes are ≥4 for both (red and green) subclones. Asymmetric neurogenic clones have one subclone with ≥4 cells and one subclone with <4 cells. Small neurogenic clones are those in which subclone sizes are ≤3 cells for both subclones.Laminar positioning in MADM clonesFigure 3l, in vivo data. Data are based on laminar position as determined by DAPI staining (2 out of 263 MADM clones induced at E10–E121 and 9/106 MADM clones induced at E12)9, and laminar-specific immunostaining (0 out of 17 MADM clones at E10–E12)1.Organoid clearing, imaging and analysisDelipidationOrganoids were fixed as described above; one modification to note was that the sucrose dehydration step was skipped. After fixation, organoids were embedded in 1.5% agarose, to provide structural support during the clearing process. The organoid clearing protocol was adapted from previously published tissue clearing methods67,68,69. In brief, embedded organoids were first washed in a 50% solution of 1:1 CUBIC-L (10% w/v N-butyldiethanolamine, 10% w/v Triton X-100 in dH2O):CUBIC-R1a (5% w/v N,N,N′,N′-tetrakis, 10% w/v urea, 10% w/v Triton X-100 1:200 5 M NaCl in dH2O) in ddH2O for up to 16 h at 37 °C, 300 rpm. Next, organoids were incubated in 100% 1:1 CUBIC-L:CUBIC-R1a twice for 2 h each time, at 37 °C, 300 rpm. Finally, organoids were washed with PBS twice for 2 h at 37 °C, 300 rpm, and once overnight at 37 °C, 300 rpm.Immunolabelling of cleared organoidsCleared organoids were incubated with chicken anti-GFP (Aves, GFP1020, 1:500) and goat anti-tdTomato (SICgen, ab8181-200, 1:500) in 0.2% PBST (note the higher antibody concentration for cleared organoids) overnight at 37 °C, 300 rpm. The primary incubation solution was removed and organoids were washed 3× for 1 h with PBS at 37 °C, 300 rpm. Next, organoids were incubated in donkey anti-chicken-Alexa488 (Jackson Immuno, 703-545-155, 1:1,000) and donkey anti-goat-Alexa568 (Invitrogen, A11057, 1:1,000) in 0.2% PBST overnight (note the higher antibody concentration for cleared organoids) at 37 °C, 300 rpm. The secondary incubation solution was removed and organoids were washed twice for 1 h with PBS at 37 °C, 300 rpm.Refractive index matchingOnce washed, organoids underwent a refractive index-matching step. Organoids were transferred through gradually increasing concentrations of CUBIC-R + (N) (30% nicotinamide and 45% antipyrine in dH2O): 1 h steps of 25%, 50%, 75% and 100% CUBIC-R + (N) in dH2O. After the last step, the 100% CUBIC-R + (N) solution was replaced and organoids were stored overnight before imaging.Imaging and analysis of cleared organoidsWhole cleared organoids embedded in agarose were imaged with an Andor Dragonfly 505 spinning disk system using a 20× Lambda/NA 0.75/WD 1.00 mm objective and 488 and 561 nm excitation lasers. During imaging, organoids were immersed in either fresh CUBIC-R + (N) or mineral oil with a refractive index of 1.52. Nikon ND2 files were converted and stitched using IMARIS File Converter and IMARIS Stitcher, respectively.3D Image analysisOnce files were converted and stitched, they were loaded into IMARIS v9.9.1. The surfaces of the organoid were reconstructed using the surface tool. Once reconstructed, IMARIS automatically calculated both sphericity and volume.scRNA-seqGeneration of mTmG;Emx1
Temporal uncoupling of radial glia lineage progression in cortical organoids - Nature
RGP lineage tracing in stem-cell-derived organoids shows highly plastic proliferation and reduced clonal neuronal diversity, indicating that missing non-cell-autonomous niche cues are essential for faithful temporal control of cortical lineage progression.
18,394 words~84 min read