Your MCP server returns data. The agent reads it back as a wall of numbers, or it tries to draw a chart in HTML and gets it wrong. The visual, the part the user actually wanted, gets left to the model to improvise.
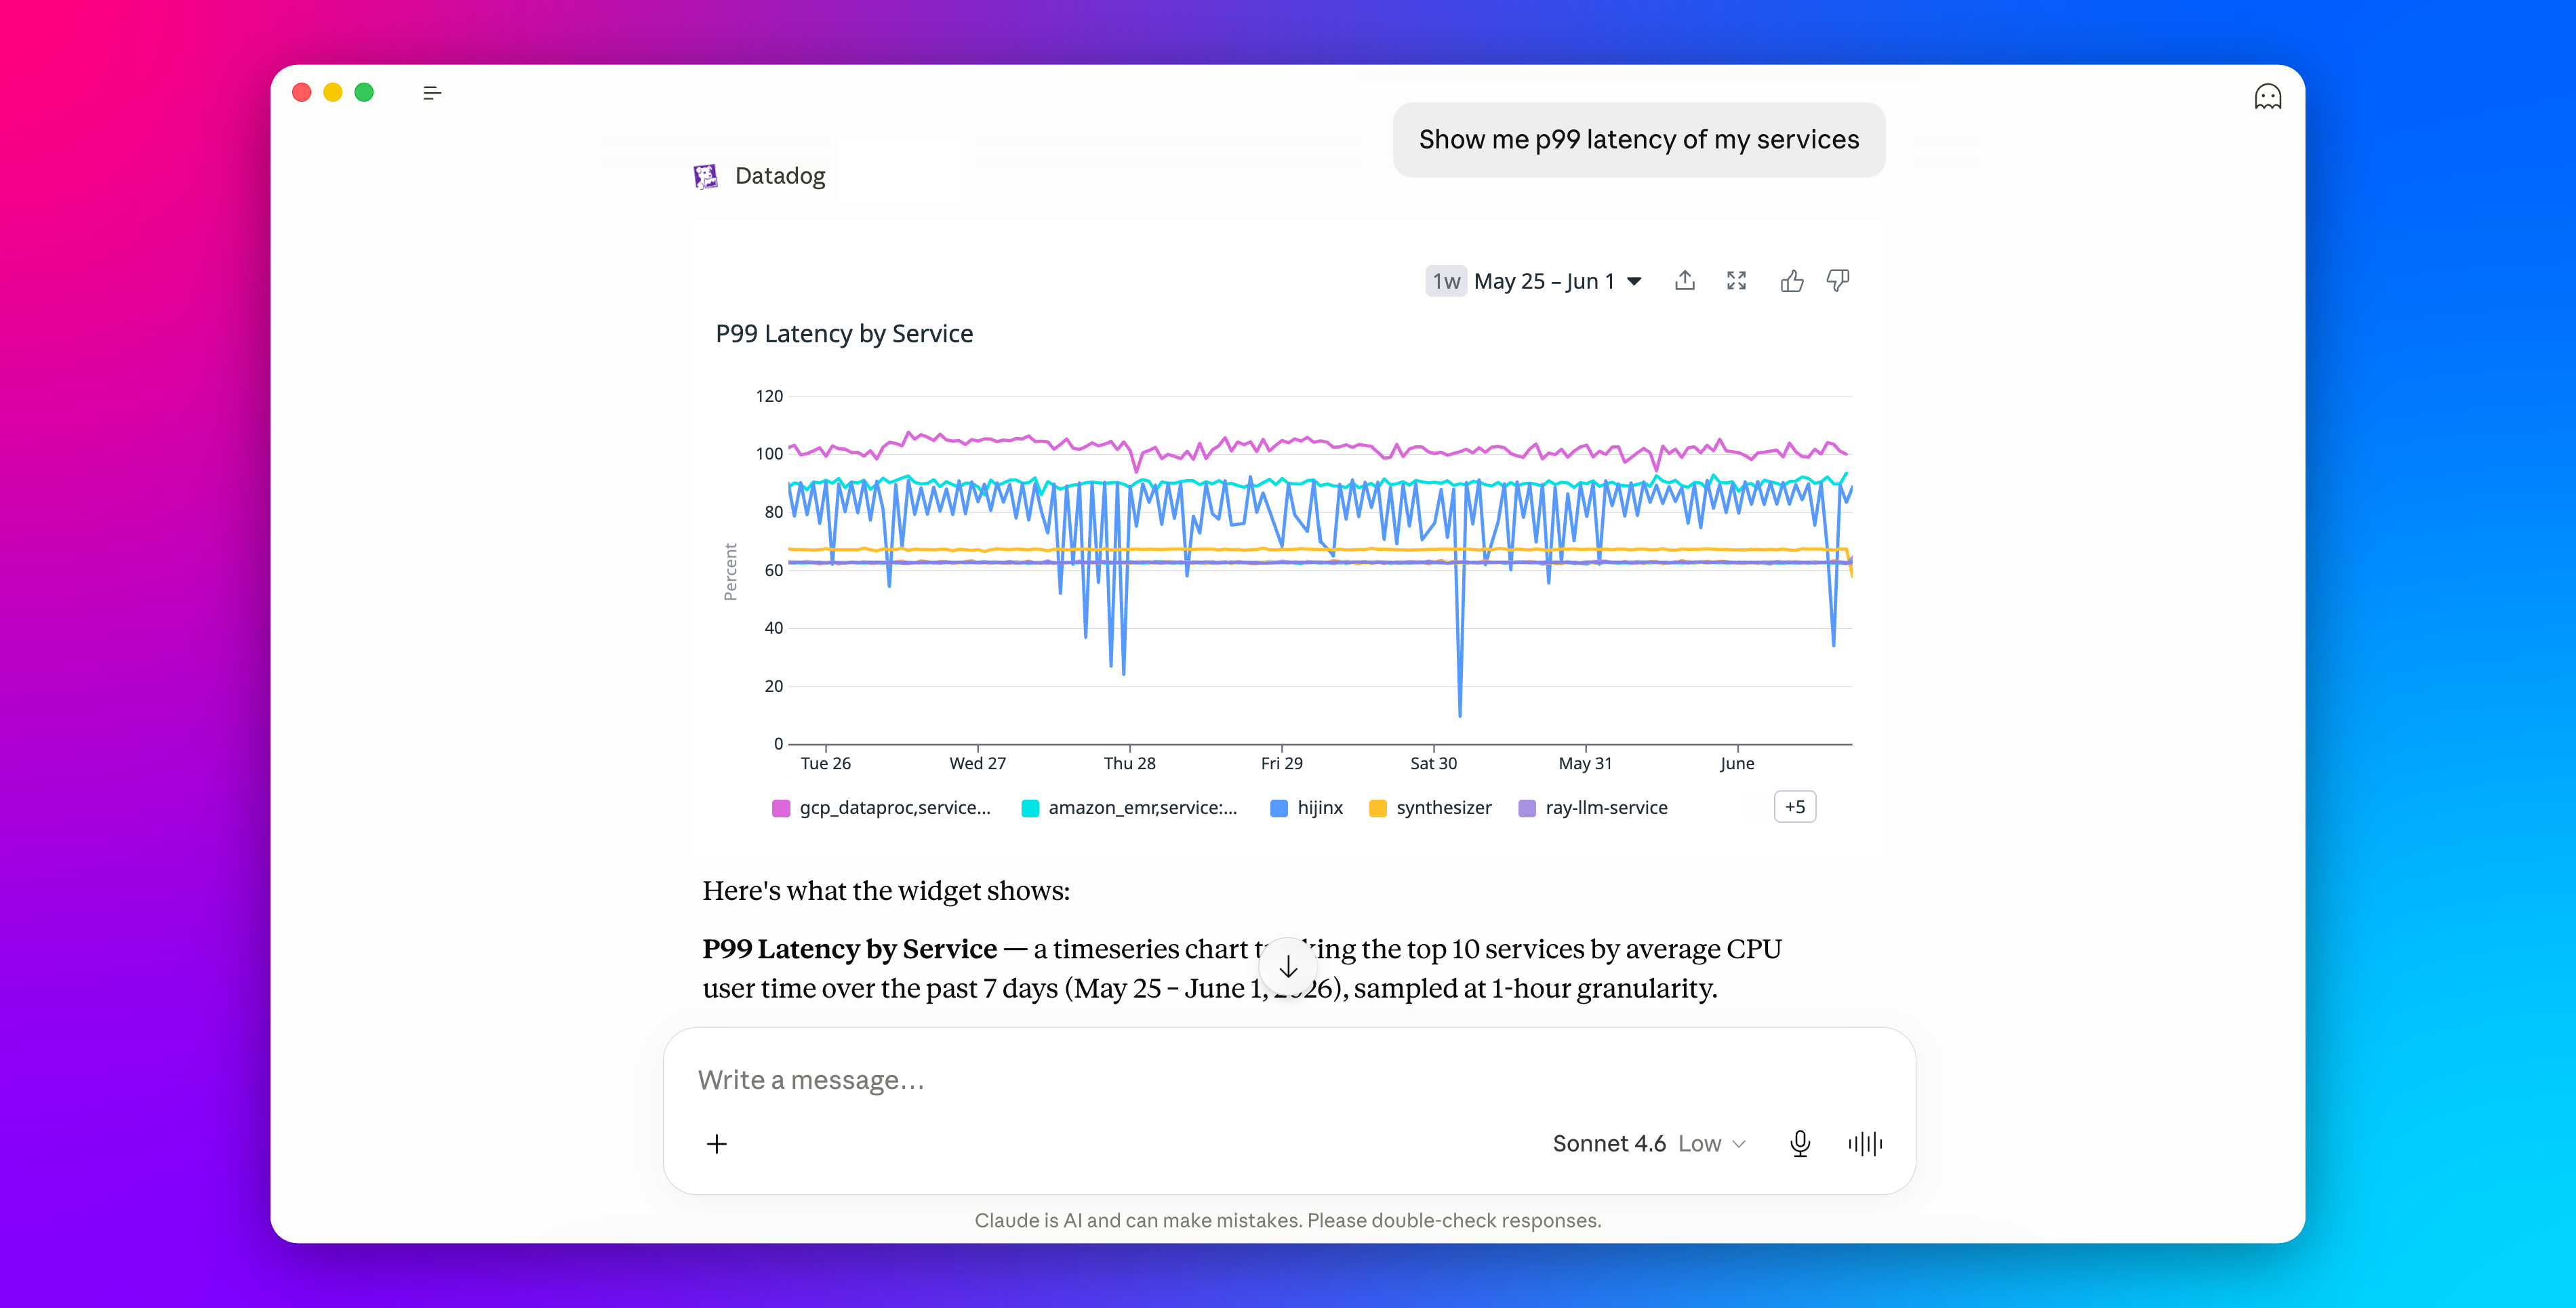
MCP charts fix that. You give your MCP server one visualize tool: the agent calls it with a query, your database returns the rows, and an interactive chart renders right in Claude or ChatGPT. You write no frontend code. That is what @bonnard/mcp-charts does, handling the tool, the chart, the cross-host widget, and the theming.
import { McpServer } from "@modelcontextprotocol/sdk/server/mcp.js";
import { addCharts } from "@bonnard/mcp-charts";
import { postgresRunSql } from "@bonnard/mcp-charts/postgres";