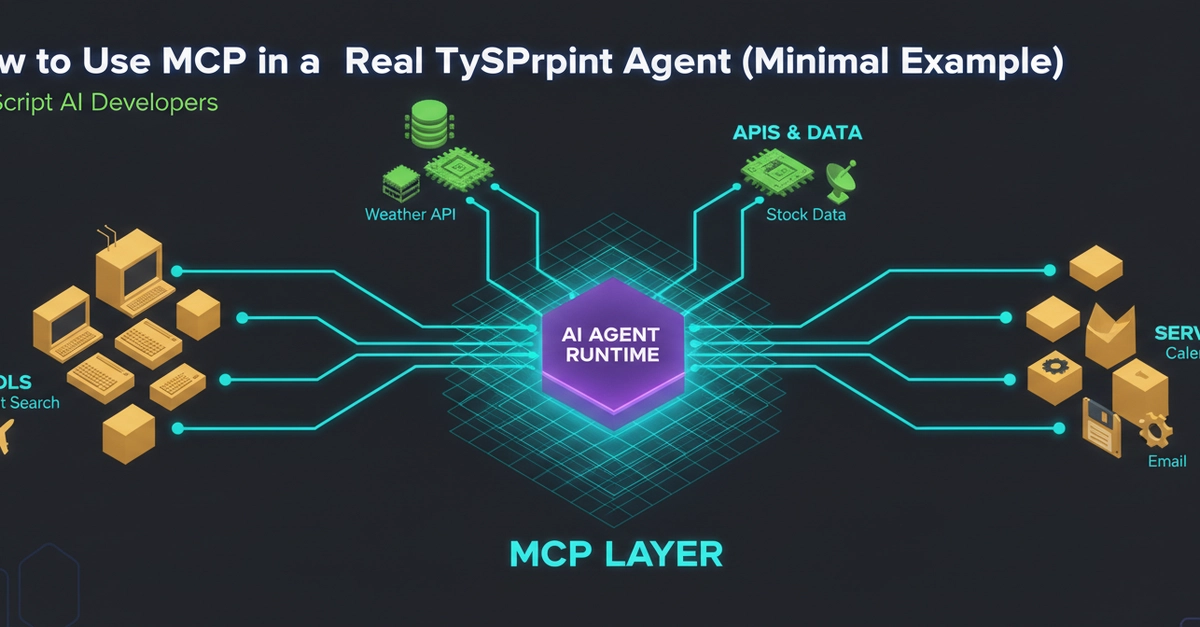
Exposing your data over MCP is the easy part. Designing a tool an agent uses well is the hard part. An agent can only use a tool it can read, so the work is shaping the tool for how the model calls it, not just for the human looking at the result. These are the techniques behind @bonnard/mcp-charts and the visualize tool.
Discovery-first, so the agent stops guessing
An agent that guesses your schema writes wrong queries. So the first tool the agent meets is a discovery tool. It calls visualize_read_me to load the chart options, the tool schema, and worked examples before it ever calls visualize, and an explore_schema tool to learn your tables and columns before it writes SQL. The agent reads, then acts.
A small set of purpose-built tools
The temptation is one tool per metric, or a single tool that takes arbitrary SQL and hopes. Both fail: too many tools blow the agent's attention budget; one firehose tool gives it no guardrails. Bonnard ships a small set, discover, query, visualize, each with a narrow, obvious job. The agent picks the right one because there are few of them and each does one thing.
 aws.amazon.com