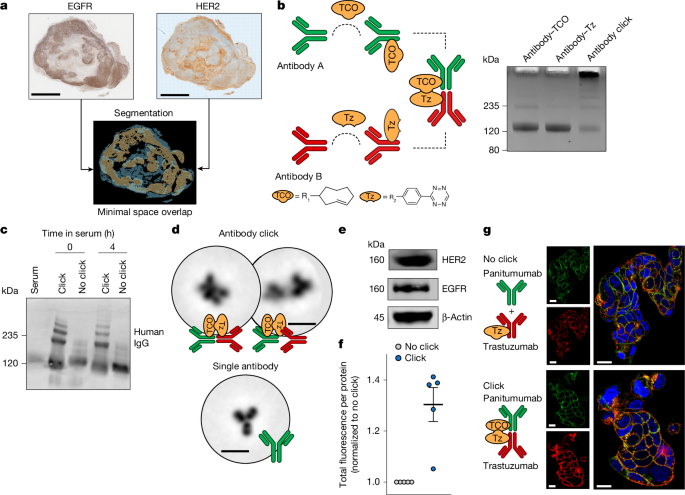
MainAround a dozen ADCs approved by the US Food and Drug Administration (FDA) have shown success in the clinic1,2. However, their dependency on high, uniform antigen expression on the cell surface and effective internalization limits their efficacy3,4,5,6. Moreover, tumour heterogeneity, compensatory signalling and antigen loss contribute to resistance, which leaves many patients ineligible or refractory to conventional ADCs7,8,9,10. Strategies that enhance ADC delivery to the tumour without requiring uniformly high antigen expression are needed to address heterogeneous and treatment-resistant tumours.To overcome the limitations of single-antigen targeting by ADCs, antibody combinations and bispecifics have been explored2,11,12. Antibody combinations that target distinct antigens can improve therapeutic efficacy13,14,15,16 and rely on the independent biodistribution of antibodies, which may be suboptimal in heterogeneous tumours1,17. In parallel with advances in antibody combinations and multispecific antibody formats, complementary modular strategies can be developed to promote flexible multitarget engagement in vivo.Bioorthogonal click chemistry enables rapid and selective ligation between two components in vivo18,19,20. The inverse electron demand Diels–Alder cycloaddition between trans-cyclooctene (TCO) and tetrazine has been explored in pretargeting approaches. In this method, an antibody–TCO is administered before systemic injection of a non-targeted small-molecule tetrazine19,21,22,23,24,25,26. Here we introduce a modular strategy named antibody–ADC click, which uses antibody–TCO and ADC–tetrazine as both targeting and reaction components. This approach facilitates the in vivo formation of functional antibody–ADC constructs directed against distinct domains of the same target or different tumour targets without requiring extensive antibody re-engineering.To demonstrate the potential of the antibody–ADC click approach, we selected human epidermal growth factor receptor 2 (HER2) and epidermal growth factor receptor 1 (EGFR) as antigens. HER2 and EGFR are clinically validated targets expressed and/or co-expressed across multiple tumour types27,28,29, and have been independently targeted by ADCs or antibodies. EGFR is a key driver of primary or acquired tumour resistance and is associated with poor prognosis28,29,30,31. Moreover, EGFR can divert HER2 into EGFR–HER2 heterodimers rather than HER2 homodimers, which reduces HER2-targeted ADC internalization and efficacy16. In tumours with low or spatially variable HER2 expression, a co-expressed target such as EGFR may serve as a co-target to enhance tumour uptake and internalization of HER2-directed ADCs through in vivo bioorthogonal assembly.In this study, we develop an antibody–ADC click strategy that leverages bioorthogonal chemistry to enable modular engagement of a single receptor or multiple co-expressed receptors. We functionalize clinically approved antibodies and ADCs with complementary click moieties18,19,20 to promote rapid in vivo ligation following sequential systemic distribution. We demonstrate the feasibility and therapeutic potential of antibody–ADC click using HER2 and EGFR as targets. This strategy enabled targeted delivery of HER2-directed ADCs—trastuzumab deruxtecan (T-DXd) and trastuzumab emtansine (T-DM1)—to EGFRhigh or EGFRlow cancer cells across the spectrum of HER2 expression. The bioorthogonal ligation reaction between the antibody and ADC is governed by click chemistry, whereas targeted binding and trafficking of the antibody–ADC influence uptake, internalization and efficacy. The modular nature of this approach may facilitate application to different receptors and antibody–ADC combinations, including tumours that do not sufficiently benefit from currently approved ADC therapies.Optimization of antibody–ADC clickThe efficacy of antibody-based therapeutics is influenced by the levels and spatial distribution of target antigens in the tumour32,33. We adapted a model for HER2 and EGFR intratumoural heterogeneity, with each receptor enriched in different regions of the tumour. To quantitatively evaluate this spatial relationship, we analysed HER2 and EGFR expression in biospecimens using automated image alignment and segmentation (Fig. 1a and Supplementary Fig. 2). The regions with high expression of each target showed minimal spatial overlap, as indicated by dice similarity coefficient34 (DSC) values, which were 0.12 and 0.26, respectively. DSC values range from 0 to 1, with 1 indicating complete overlap. Thus, the values that we observed confirm that HER2 and EGFR are spatially distinct in these tumour models.Fig. 1: Antibody click platform for in vivo ligation of antibody–ADC constructs via bioorthogonal chemistry.a, Co-registered EGFR and HER2 IHC images (top) from the same tumour section and corresponding segmentation masks (bottom) confirm the limited spatial overlap between regions of high protein expression. The DSC value was 0.12. DSC values range from 0 to 1 and quantify how much two regions overlap, with lower values indicating less similarity. Co-registration was repeated two times independently. b, Schematic of the antibody–ADC click strategy. Antibodies are conjugated to TCO or tetrazine (Tz) groups to enable antibody click. Details on the substituents R1 and R2 in the TCO and tetrazine chemical structures are provided in Supplementary Fig. 3. Right, SDS–PAGE confirms the increase in molecular mass after antibody click. This result was repeated for all the experiments involving antibody–ADC click. c, SDS–PAGE of non-clicked (no click; panitumumab plus trastuzumab–tetrazine) and clicked (click; panitumumab–TCO plus trastuzumab–tetrazine) antibody pairs after incubation in mouse serum (n = 2 mice per group and time). d, Cryo-TEM images of single or clicked antibodies. TEM images were obtained for n = 3 of the same conjugate. e, Western blot of EGFR and HER2 protein levels in NCIN87 cells was routinely repeated across experiments. A representative blot is shown. β-Actin was the loading control. f,g, Fluorescence quantification (f; via a plate reader) and confocal microscopy images (g) of NCIN87 cells 3 h after incubation with fluorescently labelled antibody pairs: either non-clicked (panitumumab plus trastuzumab–tetrazine) or clicked (panitumumab–TCO plus trastuzumab–tetrazine). Total fluorescence intensity was normalized to the protein amount and the no-click group (P = 0.01032, n = 5 coverslips per well per group, technical replicates). Data are the mean ± s.e.m.; significance was determined using the Welch two-sample t-test. Panitumumab or panitumumab–TCO were conjugated to Alexa Fluor 488 (green), whereas trastuzumab–tetrazine was conjugated to Alexa Fluor 594 (red). Scale bars, 2 mm (a), 28 nm (d) or 50 µm (g).Source dataFDA-approved antibodies and ADCs targeting HER2 and EGFR, which are receptor tyrosine kinases co-expressed in a panel of cancers35,36, were then conjugated with complementary bioorthogonal click moieties (Fig. 1b) and sequentially administered to enable dynamic in vivo ligation. The antibodies and ADCs that we chose bind different epitopes of the same receptor (HER2–HER2) or co-expressed receptors (HER2–EGFR; Supplementary Table 1). This approach can lead to antibody–ADC complexes that enhance lysosomal trafficking and intracellular payload delivery while leveraging tumour receptor biology to improve ADC distribution across heterogeneous tumour regions.The antibodies were conjugated with the TCO or tetrazine click moieties via N-hydroxysuccinimidyl ester reactions, which resulted in conjugates with 3–12 TCO or tetrazine click moieties per antibody and minimal presence of aggregates (Supplementary Figs. 3 and 4). The click reaction between equimolar panitumumab–TCO and trastuzumab–tetrazine resulted in the formation of higher molecular mass species from antibody click crosslinking, and was generalizable to other antibody pairs (Fig. 1b and Supplementary Fig. 5a). Using trastuzumab–TCO and trastuzumab–tetrazine, the higher molecular mass click species formed within 30 min, and formation depended on the molar ratio of click-handle antibodies in solution (Supplementary Fig. 5b). Antibody click formation could be blocked in the presence of an excess of unconjugated TCO or tetrazine (Supplementary Fig. 5c). Similar click reactivity was observed after incubation of the antibody in mouse serum (Fig. 1c and Supplementary Fig. 5d). Transmission electron microscopy (TEM) images confirmed the formation of antibody clusters after click reaction between trastuzumab–TCO and trastuzumab–tetrazine (Fig. 1d and Supplementary Fig. 5e,f). Antibody conjugation to TCO or tetrazine did not affect cell binding (Supplementary Fig. 6).To verify that the antibody click reaction occurs in vivo, we administered panitumumab–TCO or pertuzumab–TCO 24 h before trastuzumab–tetrazine. Following injection of trastuzumab–tetrazine, circulating antibody levels (both clicked and non-clicked) gradually decreased from 5 min to 24 h after injection of antibody–tetrazine (Extended Data Fig. 1a). This finding is consistent with known systemic clearance and tissue distribution patterns of antibody complexes.Overall, these results validate the bioorthogonal reactivity of TCO-modified and tetrazine-modified antibodies under physiologically relevant conditions and are consistent with the formation of covalently linked antibody complexes following sequential administration in vivo.Antibody click augments internalizationPrevious studies have shown that antibody combinations result in a large number of antibody–receptor complexes at the cell surface of cancer cells and enhance the rate of antibody–receptor internalization and degradation in lysosomes16. To investigate whether antibody–ADC click enhances antibody internalization, we performed studies in several cancer cell lines that express different levels of HER2 and EGFR (Supplementary Fig. 7). Immunofluorescence studies were performed using trastuzumab and pertuzumab (HER2-targeting antibodies that bind to distinct, non-overlapping domains of the HER2 receptor) and the EGFR-targeting antibody panitumumab (Supplementary Table 1). Combinations of antibody pairs not conjugated with click moieties (no click) were included as a control. Sequentially administered click-modified antibodies exhibited higher fluorescence intensity in HER2+EGFRlow NCIN87 cells (P = 0.01032) at 3 h (Fig. 1e–g and Supplementary Fig. 8) and in HER2–EGFRhigh MIAPaCa-2 cells (P = 0.00216; Fig. 2a–c) compared with the antibody in no-click conditions. Antibody internalization was observed at both 3 h and 24 h (Fig. 2d and Supplementary Fig. 9).Fig. 2: Antibody click enhances internalization in HER2– cancer cell lines.a, Schematic of immunofluorescence and live-cell imaging experiments. Cells were incubated with the first pair (panitumumab–TCO) for 30 min, followed by the second pair (trastuzumab–tetrazine) for the corresponding time of the analyses. b, Western blot of EGFR and HER2 protein levels in MIAPaCa-2 cancer cells was routinely repeated across experiments. A representative blot is shown. β-Actin was the loading control. c,d, Quantification of fluorescence (c; via a plate reader) and confocal images (d) of MIAPaCa-2 cells after incubation with fluorescently labelled antibodies: either non-clicked (panitumumab plus trastuzumab–tetrazine) or clicked (panitumumab–TCO plus trastuzumab–tetrazine) antibody pairs. Total fluorescence intensity was normalized to the protein amount and no-click group (P = 0.00216, n = 5 coverslips per well per group, technical replicates). Panitumumab and panitumumab–TCO was conjugated to Alexa Fluor 488 (green), whereas trastuzumab–tetrazine was conjugated to Alexa Fluor 594 (red). Data are the mean ± s.e.m.; significance was determined using the Welch two-sample t-test. e, Quantification of trastuzumab–tetrazine–pHrodo fluorescence in EGFRhighHER2– MIAPaCa-2 and MDA-MB-231 cells and in EGFR–HER2– CT26 cells for 24 h after incubation with either non-clicked (panitumumab plus trastuzumab–tetrazine–pHrodo) or clicked (panitumumab–TCO plus trastuzumab–tetrazine–pHrodo) antibody pairs. The results showed an increase in internalization in the click group over time (P < 1.0 × 10⁻⁶ for MIAPaCa-2 and MDA-MB-231, and P > 0.9999 for CT26, n = 3 wells per group, technical replicates). Data are the mean ± s.d.; significance between no click and click was determined using two-way analysis of variance (ANOVA). No comparison across cell lines was performed. ‘%’ represents the phase area confluence of the cells in the well. RCU, relative calibrated units. f, Confocal fluorescence microscopy images of MIAPaCa-2 cells treated with either non-clicked (panitumumab plus trastuzumab–tetrazine) or clicked (panitumumab–TCO plus trastuzumab–tetrazine) antibody pairs and stained for LAMP1, a lysosomal marker. Panitumumab and panitumumab–TCO were conjugated to Alexa Fluor 488 (green), whereas trastuzumab–tetrazine was conjugated to Alexa Fluor 594 (red). Immunofluorescence experiments were repeated three times independently. Scale bars, 40 µm (d,f).Source dataTo quantify HER2-targeting antibody internalization, we performed live-cell imaging using trastuzumab–tetrazine conjugated with pHrodo, a pH-sensitive dye that fluoresces after internalization into acidic lysosomes and late endosomes (Fig. 2a). Panitumumab–trastuzumab click resulted in significantly higher trastuzumab internalization than no-click antibody combinations in HER2+EGFRlow NCIN87 cells (P = 0.0193; Supplementary Fig. 10) and in HER2–EGFRhigh MIAPaCa-2 and MDA-MB-231 cells (P < 1 × 10⁻⁶; Fig. 2e). This finding indicates that antibody click improves internalization and trafficking to endolysosomes. The enhanced internalization observed under click conditions was not observed in control cell lines lacking EGFR or HER2, or in control panitumumab–TCO plus non-targeting IgG–tetrazine–pHrodo (Fig. 2e and Supplementary Fig. 10). Next, we used lysosome-associated membrane protein 1 (LAMP1) immunostaining to visualize lysosomes and late endosomes. Immunofluorescence analyses demonstrated colocalization of the fluorescently tagged click antibodies with LAMP1+ vesicles (Fig. 2f).Overall, these data show that antibody click using antibodies targeting two different receptors (panitumumab and trastuzumab) enhances HER2-targeting antibody internalization compared with no-click antibody combinations.Antibody click enhances tumour uptakeThe use of radiolabelled antibodies with positron emission tomography (PET) imaging enables visualization of antibody uptake in the tumour and distribution in the whole body37. In this study, antibodies were radiolabelled with the positron emitters zirconium-89 (89Zr) or copper-64 (64Cu) for PET imaging, followed by ex vivo tissue biodistribution analyses. Mice inoculated with HER2+EGFRlow NCIN87 tumours were administered panitumumab–TCO or pertuzumab–TCO on day 1, followed by injection of the radiolabelled anti-HER2 antibody [64Cu]Cu-NOTA–trastuzumab–tetrazine on day 2 or 3 (Extended Data Fig. 1b,c). No significant differences were observed when the antibodies were administered 24 or 48 h apart; therefore, subsequent studies used a 24-h interval between administrations. Immuno-PET and biodistribution studies (Fig. 3a,b) demonstrated biodistribution patterns of the antibody click species with tumour uptake (22.4 ± 6.4 percentage of injected dose per g (%ID g–1)) and liver clearance (8.4 ± 0.69%ID g–1). These profiles were consistent with PET and biodistribution findings of conventional radiolabelled trastuzumab in NCIN87 tumours3,38.Fig. 3: Antibody–ADC click enhances tumour uptake and therapeutic efficacy.a,b, PET–CT image (a) and biodistribution (b) of 64Cu-labelled trastuzumab–tetrazine in NCIN87 tumours at 24 h after injection. 64Cu-labelled trastuzumab–tetrazine was administered 24 h after injection of panitumumab–TCO (n = 3 mice, biological replicates). Data are the mean ± s.e.m. c, Left, IHC images of HER2 and EGFR in a bilateral tumour model (highlighted areas in the image to the left) inoculated with A431 (HER2ULEGFRhigh, HER2 IHC of 1+/0; green) and NCIN87 (HER2+EGFRlow, HER2 IHC of 3+; orange) xenografts. Middle, corresponding western blot analyses of HER2 and EGFR protein levels (P = 0.00765 and P = 0.00156, respectively, n = 4 tumour lysates per group, biological replicates). Data are the mean ± s.e.m.; significance was determined using the Welch two-sample t-test. Right, PET–CT analyses show uptake of 64Cu-labelled trastuzumab–tetrazine alone compared with after click with panitumumab–TCO (n = 3 mice per group, biological replicates). 64Cu-trastuzumab–tetrazine was administered 24 h after panitumumab–TCO. PET–CT images were collected 24 h after 64Cu-trastuzumab–tetrazine administration. Scale bars, 250 µm. d, 64Cu-labelled trastuzumab–tetrazine biodistribution at 24 h after injection in the bilateral A431 and NCIN87 tumour model shown in c, comparing 64Cu-trastuzumab–tetrazine single antibody versus panitumumab–TCO plus 64Cu-trastuzumab–tetrazine (click). Antibody–ADC click significantly increased tumour uptake in HER2UL A431 tumours (n = 3–4 mice per group, biological replicates). Data are the mean ±s.e.m.; significance was determined using an unpaired t-test. e, Tumour growth curves in the bilateral A431 and NCIN87 tumour model. T-DXd click (panitumumab–TCO plus T-DXd–tetrazine) improved efficacy compared with no click (panitumumab plus T-DXd) or saline. Group × day, P = 0.0138 (A431) and P = 0.00976 (NCIN87). T-DXd no click × click, P = 0.0501 (A431) and P = 0.1269 (NCIN87). T-DXd–tetrazine (5 mg kg–1, intravenously) was administered 24 h after panitumumab–TCO (5 mg kg–1, intravenously). Data are the mean ± s.e.m.; n = 4–5 mice per tumour type, biological replicates; significance was determined using type III analysis and the emmeans package (v.1.10.7) with Dunnett’s correction for multiple comparisons. f, Responses in individual NCIN87 tumours following treatment with T-DXd, no click (panitumumab plus T-DXd) or T-DXd click (panitumumab–TCO plus T-DXd–tetrazine). Bars represent the fold change in tumour volume at the study end point relative to baseline at the start of therapy (n = 9 mice per group, biological replicates). Illustrations in c adapted from Servier Medical Art (https://smart.servier.com/) under a Creative Commons licence CC BY 4.0.Source dataWe next used a bilateral tumour model to mimic intertumoural heterogeneity. HER2+EGFRlow NCIN87 cells and HER2-ultralow and EGFR-high (HER2ULEGFRhigh) A431 cells (Fig. 3c) were xenografted on the right and left shoulder of immunodeficient nude (nu/nu) mice, respectively. The ex vivo biodistribution of radiolabelled [64Cu]Cu-NOTA–trastuzumab–tetrazine was then evaluated with panitumumab–TCO or vehicle under antibody click. Panitumumab–TCO was administered on day 1, followed by an injection of [64Cu]Cu-NOTA–trastuzumab–tetrazine on day 2. PET and computed tomography (CT) demonstrated that single antibody [64Cu]Cu-NOTA–trastuzumab accumulated in the NCIN87 tumour (28.90 ± 3.84%ID g–1), whereas there was low uptake in the A431 tumour (3.75 ± 0.64%ID g–1; Fig. 3d). In the panitumumab–trastuzumab click group, we observed antibody uptake in both the HER2+ NCIN87 tumour (31.63 ± 3.29%ID g–1) and the HER2UL A431 tumour (11.90 ± 0.82%ID g–1; Fig. 3d). This result represents a 3.2-fold increase in the uptake of trastu.zumab under click conditions with panitumumab in HER2UL tumours.We next explored whether the observed increase in uptake in HER2UL tumours under click conditions was due to antibody interactions between EGFR and minimally expressed HER2 or whether it was driven by the click adduct alone. We performed additional studies using panitumumab–TCO or trastuzumab–TCO followed by antibody click with control [64Cu]Cu-NOTA–IgG–tetrazine (Supplementary Fig. 11). When clicked with trastuzumab–TCO, [64Cu]Cu-NOTA–IgG–tetrazine accumulation was higher in HER2+EGFRlow NCIN87 tumours than in HER2ULEGFRhigh A431 tumours. By contrast, when clicked with panitumumab–TCO, accumulation was higher in HER2ULEGFRhigh A431 tumours than in HER2+EGFRlow NCIN87 tumours. Across all methods of HER2 targeting, trastuzumab alone and panitumumab–TCO plus trastuzumab–tetrazine performed similarly in HER2+ NCIN87 tumours (around 30%ID g–1), whereas trastuzumab–TCO plus IgG–tetrazine showed about 20%ID ml–1 uptake. In HER2ULEGFRhigh A431 tumours, trastuzumab alone and trastuzumab–TCO plus IgG–tetrazine showed low accumulation (about 5%ID g–1), whereas panitumumab–TCO plus trastuzumab–tetrazine and panitumumab–TCO plus IgG–tetrazine showed increased accumulation. This result shows that antibody click can effectively retarget a non-targeted antibody to a specific tumour antigen. Moreover, simultaneous targeting of two antigens increases tumour uptake of the drug-bearing second click antibody at higher levels than a non-targeted drug carrier. PET–CT imaging with an EGFR–HER2 bispecific antibody in the same bilateral model showed tumour uptake of less than 5%ID g–1 and substantial accumulation in non-tumour organs (Supplementary Fig. 12).Overall, panitumumab–trastuzumab antibody click facilitates anti-HER2 antibody uptake in tumours with different levels of HER2 expression.Antibody–ADC click enhances efficacyGiven the enhanced tumour accumulation and internalization of sequentially administered antibody click compared with trastuzumab alone or antibody combinations (Figs. 1–3), we sought to perform therapeutic studies. T-DM1 and T-DXd are HER2-targeting ADCs approved for the treatment of HER2+ tumours. Although both ADCs consist of the monoclonal antibody trastuzumab conjugated to a cytotoxic chemotherapeutic, T-DXd demonstrates efficacy in a broader range of HER2-expressing cancers39,40,41,42,43,44. Moreover, T-DXd has demonstrated significant benefit in patients with HER2low expression (immunohistochemistry (IHC) score of 1+ or 2+ with negative results on in situ hybridization) and in HER2UL breast tumours (IHC score of 0 with incomplete or faint membrane staining in >0 but ≤10% of tumour cells)45.First, we determined the efficacy of the panitumumab–TCO plus T-DXd–tetrazine click pair using mice inoculated with HER2+EGFRlow NCIN87 tumours. Tumour weights at 20 days after initiating therapy were 3.7-fold higher for panitumumab plus T-DXd (no click) than for panitumumab–TCO plus T-DXd–tetrazine (click) at a dose of 10 mg kg–1 (Supplementary Fig. 13). In subsequent therapeutic studies, we reduced the T-DXd dose from 10 mg kg–1 to a single dose of 5 mg kg–1 to determine the feasibility of T-DXd dose reduction in click approaches. The safety of the antibody–ADC click strategy was supported by histopathological analyses and the absence of weight loss or other clinical signs of toxicity in the treated animals (Supplementary Table 2 and Supplementary Figs. 14 and 15).T-DXd has shown clinical benefit in patients with HER2low or with HER2UL tumours45,46. However, responses remain greater in HER2high tumours41,42,43. Targeting a complementary antigen in combination with T-DXd may enhance ADC delivery and tumour accumulation comparable to those observed in HER2-overexpressing tumours16,47. To determine the potential of antibody–ADC click to extend the benefit of a HER2-targeted ADC to HER2low-expressing or non-HER2-expressing tumours, we performed therapeutic studies in a bilateral model of HER2+ NCIN87 and HER2UL A431 tumours (Fig. 3e). Mice received a single intravenous injection of panitumumab or panitumumab–TCO (5 mg kg–1) 24 h before T-DXd (T-DXd no click) or T-DXd–tetrazine (T-DXd click). Tumour progression was slowed or halted in A431 and NCIN87 tumours in the T-DXd click group compared with the vehicle or T-DXd no-click group (P = 0.0138 for A431, P = 0.00976 for NCIN87). Furthermore, mice receiving T-DXd click showed complete remission of HER2+ NCIN87 tumours in 100% of treated mice (Fig. 3f). These results demonstrate that panitumumab–T-DXd click can enhance ADC efficacy in tumours with various levels of ADC target antigen expression.As T-DXd can be immunomodulatory48, we evaluated pertuzumab–T-DXd click therapy in immunocompetent mice with HER2low xenografts (Extended Data Fig. 2a–c). Previous research has shown that T-DXd plus pertuzumab exhibits enhanced efficacy compared with T-DXd alone in treating HER2-expressing tumours47,49. Similar to the results described above, internalization and uptake were observed by immunofluorescence in vitro and biodistribution studies (Extended Data Fig. 2d,e). A complete response was observed in 50% (7 out of 14) of mice receiving pertuzumab–TCO plus T-DXd–tetrazine click treatment. Complete responses were observed in about 14% (2 out of 14) in the no-click cohorts (Extended Data Fig. 2f and Supplementary Fig. 16).These results show that antibody–ADC click using the anti-HER2 T-DXd clicked with panitumumab or pertuzumab enhances efficacy in tumours with different HER2 levels.Antibody–ADC efficacy in refractory tumoursHaving shown that antibody–ADC click increases trastuzumab uptake and T-DXd responses, we next evaluated efficacy in cancer models unresponsive or resistant to ADC therapy. Initial studies were performed in HER2– models of pancreatic cancer and in a HER2low admixed breast cancer model (Fig. 4). HER2 levels in these models were confirmed by IHC and PET–CT imaging with radiolabelled trastuzumab, which showed approximately 9%ID g–1 tumour uptake. Admixed breast and pancreatic xenografts showed minimal responses to the ADCs T-DXd or T-DM1 given as monotherapies and to panitumumab plus ADC combination therapies (T-DM1 or T-DXd no click; Fig. 4 and Extended Data Fig. 3a,b). By contrast, panitumumab–TCO clicked with T-DM1–tetrazine or T-DXd–tetrazine (T-DM1 or T-DXd click, respectively) led to a significant reduction in tumour volume and prolonged survival in mice with breast or pancreatic tumours that express low to no HER2. Notably, the therapeutic benefit of panitumumab–T-DXd click was reduced by the administration of an excess of tetrazine 15 min before T-DXd–tetrazine administration (Supplementary Fig. 17).Fig. 4: Antibody–ADC click overcomes tumour resistance to T-DXd.a, IHC images (right) of the highlighted area in the PET–CT image (left) of an admixed breast cancer model demonstrating low HER2 expression (IHC 2+) and high EGFR expression. PET–CT images were obtained 24 h after injection of 64Cu-labelled trastuzumab (9.90 ± 0.65%ID ml–1 mean tumour uptake, n = 4 mice, biological replicates). b, Tumour growth curves for the admixed breast cancer model following a single intravenous dose (5 mg kg–1) of saline, panitumumab, T-DXd, T-DXd no click (panitumumab plus T-DXd) or T-DXd click (panitumumab–TCO plus T-DXd–tetrazine). T-DXd click significantly decreased tumour growth compared with monotherapies and no-click controls. Group × day, P = 7.98 × 10⁻⁷; T-DXd no click × click, P = 0.0018 (n = 10−14 mice per group, biological replicates). Data are the mean ± s.e.m. c, Kaplan–Meier survival curves of groups in b show that T-DXd click significantly prolongs survival compared with all other groups. log-rank, P = 1.87 × 10⁻⁷; T-DXd no click × click, P = 1.20 × 10⁻⁴ (n = 10−14 mice per group, biological replicates). Ribbons represent 95% confidence intervals. d, HER2 and EGFR IHC imaging (right) was performed routinely across experiments. Images are of the highlighted area in the left image. MIAPaCa-2 pancreatic cancer xenografts are characterized by negative HER2 expression (IHC of 0) and high EGFR levels. PET–CT imaging (left) was performed routinely across experiments 24 h after administration of 89Zr-labelled trastuzumab (9.27 ± 2.42%ID ml–1 mean tumour uptake, n = 4 mice per experiment, biological replicates). e,f, Tumour volume (e) and survival (f) in xenograft-bearing mice following a single intravenous administration (5 mg kg–1) of saline, panitumumab, T-DXd, T-DXd no click (panitumumab plus T-DXd) or T-DXd click (panitumumab–TCO plus T-DXd–tetrazine). e, T-DXd click improved tumour control relative to monotherapies and no-click therapy. Group × day, P = 3.15 × 10⁻¹³; T-DXd no click × click, P < 1.10 × 10−323 (n = 8–10 mice per group, biological replicates). Data are the mean ± s.e.m. f, Kaplan–Meier survival analysis of the treatment groups in e. Mice receiving T-DXd click showed significantly extended survival compared with all other groups. log-rank, P = 2.28 × 10⁻⁸; T-DXd no click × click, P = 5.26 × 10⁻⁵ (n = 8–10 mice per group, biological replicates). Significance was determined using type III analysis and the emmeans package (v.1.10.7) with Dunnett’s correction for multiple comparisons. For survival, the log-rank test and Bonferroni correction for multiple testing were performed. Ribbons represent 95% confidence intervals. Scale bars, 125 µm (a,d).Source dataTo evaluate whether the observed enhanced HER2-targeted ADC efficacy depends on the targeting ability of the drug-bearing antibody, we generated an IgG–DM1–tetrazine non-targeted control (Supplementary Fig. 18). Studies of panitumumab–TCO plus non-targeting IgG–DM1–tetrazine (IgG–DM1 click) did not improve treatment efficacy compared with saline, T-DM1 or IgG-DM1 no click (Extended Data Fig. 3c,d). This result suggests that click ligation between panitumumab and control IgG–DM1 is insufficient to drive therapeutic benefit and that antigen-directed tumour engagement is required for effective payload delivery of the antibody–ADC click approach.Next, mice with HER2+EGFRlow NCIN87 xenografts were administered T-DXd monotherapy. At 30 days after T-DXd administration, mice were divided into T-DXd responders (fold change in tumour volume equal to or lower than 1) and non-responders (fold change in tumour volume higher than 1), as shown in Extended Data Fig. 4a,b. PET imaging showed a decrease in trastuzumab uptake among non-responders after T-DXd therapy (Supplementary Fig. 19). Previous clinical data have demonstrated that EGFR upregulation is a resistance mechanism to HER2-targeted therapies36. Therefore, we measured EGFR protein levels in tumours that exhibited non-responsiveness to T-DXd. Western blotting of T-DXd-treated non-responding tumours showed a 2.1-fold increase compared with responders in EGFR total protein levels (Extended Data Fig. 4b). After stratification into T-DXd responders versus non-responders, the non-responder mice were switched to a combination of panitumumab–TCO plus T-DXd–tetrazine click therapy. Antibody–ADC click therapy reduced tumour growth in 5 out of 9 of the non-responder mice (Extended Data Fig. 4b).To explore other antibody–ADC click therapy combinations to treat resistant tumours, we evaluated click efficacy in BT474 trastuzumab-resistant tumours (Extended Data Fig. 4c). Mice inoculated with trastuzumab-resistant BT474 tumours were treated with T-DXd alone and stratified as responders or non-responders on the basis of their tumour volume (Extended Data Fig. 4d). Six out of 10 mice with BT474 trastuzumab-resistant tumours were confirmed to be non-responders to T-DXd. Non-responder mice were then dosed with pertuzumab–TCO plus T-DXd–tetrazine, which demonstrated effective tumour suppression in 5 out of 6 of the non-responder mice (Extended Data Fig. 4d).These results demonstrate that antibody–ADC click represents a modular approach to enhance ADC efficacy in tumours with low or heterogeneous target expression, with potential relevance for refractory tumours.Site-specific improvements in antibody–ADC clickOur results demonstrated the effectiveness of antibody click pairing to improve internalization, tumour uptake and therapeutic efficacy (Figs. 1–4). Therefore, we next sought to address a key limitation of conventional lysine-based antibody conjugation: variability in conjugation efficiency and biodistribution between batches. Our goal was to develop site-specific antibody conjugates that could produce more uniform click reactions in vivo and with improved pharmacokinetic properties to minimize off-target accumulation, which will in turn improve reproducibility across studies.To achieve site-specific modification of antibodies with TCO (ss-TCO) or tetrazine (ss-tetrazine), we used an enzymatic conjugation approach to specifically attach an azido moiety to the heavy chains of the antibody50 (Fig. 5a). This enzymatic approach consistently resulted in the conjugation of 2–4 TCO or tetrazine click moieties (Supplementary Figs. 20 and 21) without affecting the formation of higher molecular mass products from the antibody click crosslinking process (Fig. 5a and Supplementary Fig. 22a). Antibody ligation of site-specifically modified antibodies was observed by TEM (Fig. 5b and Supplementary Fig. 22b,c), which confirmed covalent linkage through the Fc regions of the antibodies. This site-specific approach demonstrated high conjugation consistency and click efficiency across a panel of five antibodies targeting diverse antigens: HER2, EGFR, programmed death ligand 1 (PD-L1), prostate-specific membrane antigen (PSMA) and vascular endothelial growth factor (VEGF) (Fig. 5c and Supplementary Fig. 23).Fig. 5: Site-specifically modified antibodies reduce batch variability and liver accumulation and improve biodistribution without compromising efficacy.a, Left, schematic of site-specific antibody click to obtain trastuzumab–ss-tetrazine and panitumumab–ss-TCO. Antibodies were enzymatically modified to add azide groups on Fc glycans, followed by conjugation to either Tz or TCO via azide (N3)-dibenzocyclooctyne (DBCO) reaction. Right, SDS–PAGE to confirm antibody click was repeated for all the experiments. b, Cryo-TEM images of site-specific antibody click (n = 3 of the same conjugate). Scale bars, 28 nm. c, Blot of multiple antibody–TCO conjugate (targeting EGFR, HER2, PD-L1, PSMA and VEGF) click reactions to trastuzumab–tetrazine. Results were repeated for each click conjugate. d, Left, PET–CT image of 64Cu-trastuzumab–ss-tetrazine at 24 h after injection in the bilateral A431 and NCIN87 tumour model. 64Cu-trastuzumab–ss-tetrazine was administered 24 h after panitumumab–ss-TCO. Right, liver uptake of antibody click prepared using site-specific methods was lower than for conjugates obtained through random conjugation (P = 0.0064, n = 4 mice per group). Data are the mean ± s.e.m.; significance was determined using the Welch two-sample t-test. e, Serum chemistry of aspartate aminotransferase (AST), alanine aminotransferase (ALT) and alkaline phosphatase (ALP) in mice treated with saline (n = 7 mice), no click (panitumumab plus T-DXd, n = 4 mice), random click (panitumumab–TCO plus T-DXd–tetrazine, n = 3 mice) or site-specific click (panitumumab–ss-TCO plus T-DXd–ss-tetrazine, n = 4 mice). Antibodies were administered at 20 mg kg–1. Data are the mean ± s.e.m.; significance was determined using two-way ANOVA. f,g, PET–CT (f) and biodistribution (g) at 120 h after 89Zr-trastuzumab–ss-tetrazine administration in HER2–EGFRhigh MiaPaCa-2 pancreatic xenografts in click (panitumumab–ss-TCO plus trastuzumab–ss-tetrazine), pre-click (panitumumab–ss-TCO reacted with trastuzumab–ss-tetrazine before injection) or control IgG (IgG–ss-TCO plus trastuzumab–ss-tetrazine) groups. Data are the mean ± s.d. (n = 4 mice per group). Significance was determined using an unpaired t-test. h, Tumour growth curves for the MIAPaCa-2 (pancreatic cancer) and admixed breast cancer models following a single intravenous dose (5 mg kg–1) of saline (n = 10 mice per group) or site-specific T-DXd click (panitumumab–ss-TCO plus T-DXd–ss-tetrazine). Group × day, P = 4.53 × 10⁻¹⁴ (MIAPaCa-2) and P = 1.0 × 10−323 (admixed breast cancer) (n = 10 mice per group). Data are the mean ± s.e.m.; significance was determined using type III analysis and the emmeans package (v.1.10.7) with Dunnett’s correction for multiple comparisons.Source dataTo evaluate the effect of site-specific conjugation (ss-TCO or ss-tetrazine) on click-driven antibody accumulation in an intertumour heterogeneous model, we used the same bilateral model of HER2+ NCIN87 and HER2UL A431 tumours as in Fig. 3c. Mice received an intravenous injection of panitumumab–ss-TCO on day 1, followed by an injection of [64Cu]Cu-NOTA–trastuzumab–ss-tetrazine on day 2. Antibody accumulated at 22.75 ± 2.11%ID ml–1 in NCIN87 tumours and at 7.70 ± 0.91%ID ml–1 in A431 tumours (Fig. 5d). Site-specific antibody click led to a twofold decrease in liver accumulation compared with a control antibody click (P = 0.0064; Fig. 5d and Supplementary Fig. 24). Furthermore, site-specific antibody click improved antibody conjugate stability (Supplementary Fig. 25) and exhibited a favourable safety profile (Fig. 5e and Supplementary Table 2).Next, we evaluated whether site-specific antibody click (panitumumab–ss-TCO plus trastuzumab–ss-tetrazine) enhances antibody accumulation in HER2– pancreatic cancer cells. Immunofluorescence studies were performed using MIAPaCa-2 cancer cells. Control studies included combinations of IgG–trastuzumab click pairs and panitumumab–trastuzumab pre-click before incubation. Increased fluorescence intensity was observed when the antibody click or pre-click combination was used compared with the IgG click combination (Supplementary Fig. 26). Moreover, internalization was higher for site-specific antibody click than for no-click antibody combinations (P = 2.23 × 10⁻⁴ for panitumumab–trastuzumab click, P = 3.89 × 10⁻⁶ for pertuzumab–trastuzumab click; Supplementary Fig. 27). To validate these in vitro findings, we performed a longitudinal PET–CT imaging study (Fig. 5f and Extended Data Fig. 5a). Mice were administered an intravenous injection of panitumumab–ss-TCO or IgG–ss-TCO on day 1, followed by an injection of [89Zr]Zr-DFO–trastuzumab–ss-tetrazine on day 2. In the pre-click group, panitumumab–ss-TCO and [89Zr]Zr-DFO–trastuzumab–ss-tetrazine were incubated for 90 min before intravenous injection. PET–CT images showed increased tumour accumulation over time for the site-specific antibody click group compared with the control groups. PET–CT image quantification revealed significantly higher antibody tumour accumulation at 120 h in the click group (24.93 ± 2.75 maximum %ID ml–1) compared with both the control IgG click (18.46 ± 2.72 maximum %ID ml–1, P = 0.00116) and pre-click (12.67 ± 1.72 maximum %ID ml–1, P = 1.51 × 10⁻⁴) groups (Extended Data Fig. 5b). Conversely, liver accumulation showed an opposite trend, with the pre-click group showing significantly higher uptake at 120 h (19.21 ± 3.48 maximum %ID ml–1, P = 0.0043) compared with the click group (Extended Data Fig. 5c). Biodistribution studies performed at 120 h corroborated the PET–CT imaging results (Fig. 5g). Moreover, site-specific panitumumab–TCO plus T-DXd–tetrazine click demonstrated antitumour activity in both models of HER2– pancreatic cancer and admixed HER2low breast cancer (Fig. 5h).Overall, our results demonstrate that site-specific antibody click maintains effective target engagement while reducing off-target accumulation, particularly in the liver. This optimization through site-specific modification enables the generation of more homogeneous conjugates with a more controlled number of click moieties towards future optimization and clinical translation of antibody–ADC click.DiscussionConventional ADCs have shown significant promise in cancer treatment but are inherently limited to targeting a single antigen2,51, which may limit therapeutic efficacy in heterogeneous tumours with variable target expression. Here we introduced an antibody–ADC click approach for in vivo ligation of FDA-approved antibodies to HER2-targeting ADCs. Our results showed that modification of the antibodies with click moieties preserves targeting binding while improving tumour accumulation, especially in tumour models with heterogeneous or ultralow to negative HER2 protein levels, without observable increases in off-target accumulation. We used bioorthogonal click chemistry to perform in vivo ligation between the antibody and the ADC52,53, which is a highly selective and biocompatible approach for functionalizing biomolecules in living systems.In this work, FDA-approved antibodies and ADCs are administered sequentially and are selectively ligated in vivo via inverse electron demand Diels–Alder chemistry, a bioorthogonal click reaction with exceptional reaction kinetics (k2 > 100,000 M−1 s−1)52,53. In vivo Diels–Alder chemistry has been successfully applied to radiochemistry and drug delivery22,24,25,26,54,55, including studies in large animal models23,56, which most commonly make use of pretargeted antibodies and untargeted small-molecule drugs. The antibody–ADC click approach uses tumour-targeting antibodies and ADCs that ligate together in vivo. Given the circulation time of antibodies, a fraction of ligation between the antibody and the ADC occurs in the bloodstream before tumour accumulation. Antibody–ADC click complexes formed in the circulation can subsequently accumulate at the tumour via antigen-mediated targeting. Moreover, the antibody–TCO can click with antibody–tetrazine already accumulated in the tumour. The observed therapeutic effects of the antibody–ADC click species are a result of a combination of systemic and tumour bioorthogonal ligation and tumour-specific biological targeting, which ultimately leads to enhanced ADC internalization.The antibody–ADC click approach minimizes the need for extensive modifications of the antibody backbone while enabling multispecific targeting. Following sequential systemic administration and ligation in vivo, the antibody–ADC click species maintains target engagement and shows improved tumour accumulation and efficacy in EGFRhigh or EGFRlow tumours across the HER2 expression spectrum. A strength of this approach, which may be generalized to other targets, is that the uptake of a click ADC is not wholly dependent on the expression levels or other properties of its target. Therefore, co-targeting a poorly internalizing antigen with a rapidly internalizing one16,57 might enable payload delivery even when a single target is highly tumour-specific but, owing to dynamic expression and degradation, unsuitable for targeting by a long-lived antibody construct. In this context, internalization assays demonstrated increased internalization of HER2-targeting antibodies in EGFRhigh and EGFRlow tumour models when using the antibody–ADC click approach, which suggests that there is a role for receptor biology in modulating uptake. Notably, this effect is not achievable with a conventional antibody combination. Although higher internalization was observed under antibody click conditions, we cannot definitively distinguish between enhanced receptor-mediated uptake, antibody clustering or altered pharmacokinetics resulting from in vivo ligation between the two antibodies. Therefore, the therapeutic benefit probably reflects a combination of bioorthogonal chemistry-driven ligation and tumour receptor biology rather than exclusively receptor colocalized assembly. Furthermore, the modular nature of this approach enables flexible conjugation while maintaining the functional properties of the parental antibodies and has potential as a translatable strategy for generating antibody-based conjugates.The antibody–ADC click approach developed here uses HER2-targeting ADCs (T-DXd27,45,46 and T-DM1 (ref. 40)) as a proof of concept to improve ADC uptake in heterogeneous tumours and to expand the therapeutic potential of HER2-targeted ADCs for tumours that lack HER2 expression or are resistant to HER2-directed therapies. T-DXd and T-DM1 have well-established safety profiles40, and our click-based conjugates displayed similar biodistribution and safety properties, which indicates their potential for clinical translation. Moreover, site-specific non-stochastic antibody modifications reduced liver accumulation compared with stochastic tertiary-amino directed conjugates. These results are particularly relevant for clinical translation, as hepatic uptake is a key determinant of off-target toxicity and tolerability for ADCs. Nevertheless, the known risks associated with certain payloads (for example, DXd-induced lung toxicity) will require additional evaluation in humanized models and optimization of dosing strategies.Although our study focused on HER2-targeted ADCs, this approach is inherently flexible and can be adapted to other targets of interest. Therefore, it has the potential to be applicable to a wide range of tumour types, particularly those characterized by heterogeneous or low antigen expression. The modularity of this approach also enables the integration of antibodies with different Fc domains or effector functions, which will further create new opportunities for both cytotoxic and immunomodulating therapeutic strategies.Further development and optimization of the click-enabled ADC platform are required for future clinical translation. For example, optimizing the chemical linker or spacer between the antibody and the clickable handle (TCO or tetrazine)21 may further improve pharmacokinetic properties. Moreover, further optimization of the antibody–ADC click system may enhance effectiveness and enable more precise control of in vivo ligation between the two antibodies across diverse biological contexts and heterogeneous tumour microenvironments. Moreover, site-specific conjugation strategies50 will further improve consistency, pharmacokinetics and efficacy. Optimizing the size and valency of the antibody constructs (for example, using fragments or engineered scaffolds) may enhance tumour penetration, reduce off-target effects and better exploit receptor clustering effects, particularly in solid tumours with dense stroma or poor vascularization.Taken together, this antibody–ADC click strategy enables a flexible, efficient and cost-effective platform for next-generation targeted therapies. This approach is compatible with clinically validated antibodies and enables in vivo assembly without extensive antibody re-engineering, and has the potential to address tumour heterogeneity with minimal additional cost. Beyond direct cytotoxic delivery, the modular customization of this approach offers potential for immune modulation, diagnostic imaging and combinatorial payload strategies. As such, this approach provides a flexible foundation for the optimization of antibody-based therapeutics in oncology and other diseases.MethodsEthical complianceAnimal studies were performed at the Washington University School of Medicine in compliance with institutional guidelines and protocols approved by the Institutional Animal Care and Use Committee (animal protocol 21-0087, 24-0274; IBC protocol 13652, principal investigator: P.M.R.P.). Radiolabelling and PET–CT imaging experiments were performed using appropriately shielded equipment within a licensed radiation-safety facility by trained personnel under an active licence.Preparation of antibody–TCO and antibody–tetrazine conjugates (random and site-specific)Random conjugationAntibodies were conjugated at a molar ratio of 15 TCO-PEG4-NHS-ester (TCO; BroadPharm, BP-22418) or tetrazine-PEG5-NHS-ester (tetrazine: BroadPharm, BP-22681) per antibody. Conjugations were performed in PBS (pH 8.8–9) at 37 °C, 500 rpm for 1 h. Conjugates were purified using a desalting column (PD-10, GE Healthcare) and concentrated using Amicon filters with a 50 kDa molecular weight cutoff (Millipore, UFC8050) in 1× PBS (pH 7.4).For indocyanine green-Sulfo-Osu (ICG) conjugation, trastuzumab–tetrazine was conjugated with ICG (Fisher Scientific, 501952790) at a molar ratio of 3 ICG per antibody in PBS (pH 8.8) at 37 °C, 500 rpm for 1 h. The fluorescently labelled antibody conjugate was purified using a desalting column (PD-10) and concentrated using 50 kDa molecular weight cutoff Amicon filters in 1× PBS (pH 7.4).Site-specific conjugationAntibodies were modified with azide groups through the glycosylation sites in the Fc region (SiteClick Antibody Azido Modification kit, ThermoFisher, S10901). In brief, antibodies (5 mg) were incubated with 100 µl β-galactosidase at 37 °C, 450 rpm for 6 h, followed by overnight incubation at 30 °C with UDP-GalNAz containing GalT enzyme. Azide-modified antibody was purified and concentrated using Amicon filters with a 50 kDa molecular weight cutoff in 1× Tris buffer (pH 7.0). Then, DBCO-PEG12-TCO (TCO; BroadPharm, BP-22423) or DBCO-methyl-tetrazine (tetrazine; Vector Laboratories, CCT-1022) at a molar ratio of 15 was conjugated with the azide-modified antibody overnight at room temperature. Site-specific conjugates were purified using a desalting column (PD-10) and concentrated with Amicon filters with a 50 kDa molecular weight cutoff in 1× PBS (pH 7.4).The concentration of the antibody conjugates was determined using a UV-visible spectrophotometer or a Pierce 660 assay (Thermo Fisher Scientific, 22660).Cell cultureThe human cancer cell lines NCIN87, A431, BT474, CT26, MDAMB231, MIAPaCa-2 and JIMT1 were purchased from the American Type Culture Collection (ATCC). All cell lines used were tested for bacterial contamination with a PlasmoTest mycoplasma detection kit (InvivoGen, rep-pt1) and authenticated by STR DNA profiling before cell or animal studies. Cells were cultured at 37 °C in a humidified atmosphere at 5% CO2. All cell culture media were supplemented with 100 units ml−1 penicillin and streptomycin. Details of cell culture media for respective cell lines are detailed in Supplementary Table 3. Different cancer cell lines were used for PET and therapeutic studies, as summarized in Supplementary Table 4.Generation of CT26-hHER2 and BT474 trastuzumab-resistant cell linesWe used our previously reported methods to develop the CT26-hHER2 cell line3. In brief, we transduced the mouse cancer cell line CT26 using 8 g ml–1 hexadimethrine bromide (Sigma), and the medium was changed 24 h later. Puromycin selection (5 μg ml–1) was initiated 3 days after transduction and was continued for a minimum of 4 days afterwards. Western blot analysis confirmed human HER2 (hHER2) expression in the CT26 cells (Supplementary Fig. 7). HER2 expression in CT26-hHER2 tumours was also confirmed by IHC (Extended Data Fig. 2c). PET–CT imaging and ex vivo biodistribution analyses using radiolabelled anti-HER2 trastuzumab confirmed trastuzumab uptake in CT26-hHER2 cells implanted in the mouse (Extended Data Fig. 2a,e).BT474 human breast cancer cells were made resistant to trastuzumab by continually incubating the parental BT474 cancer cells with increasing concentrations (up to 15 μg ml–1) of the trastuzumab antibody over a period of 9 months. Cell viability studies indicated >90% viability at 48 h after incubation of cells with 20 nM trastuzumab, thereby confirming resistance.SDS–PAGE, MALDI, SEC–HPLC and TEMFor antibody click validation, antibody–TCO and antibody–tetrazine were incubated at a 1:1 reaction ratio at 37 °C, 450 rpm for 90 min. The antibodies (10 µg) were then mixed with loading buffer (Laemmli buffer), loaded in SDS–PAGE gels (NuPage 4–12% Bis-Tris protein gels, Invitrogen) and subjected to standard gel electrophoresis. For reducing conditions, samples were mixed with loading buffer containing reducing agent and boiled at 95 °C for 10 min. After SDS–PAGE, the gels were rinsed with deionized water, stained using a Pierce Mini Gel Power Staining kit (ThermoFisher, 2284) and scanned on an Odyssey CLx imaging system (LI-COR). No-click reactions (antibody plus antibody–tetrazine), single antibodies and modified antibodies were used as controls.For ICG studies, trastuzumab–TCO and trastuzumab–tetrazine–ICG were incubated at different ratios (1:1, 1:0.8, 1:0.6, 1:0.4 and 1:0.2) at 37 °C, 450 rpm for 90 min. Additional experiments were conducted in 1:1 reaction ratios at 37 °C, 450 rpm, at different incubation times (1, 10, 30 and 90 min). To block the click reactions, 15 µg trastuzumab–TCO or trastuzumab–tetrazine was pre-incubated with 0.5 µg unconjugated tetrazine or TCO, respectively. Pre-incubation was performed at 37 °C, 450 rpm for 90 min. After pre-incubation, the antibody click pairs were reacted in a 1:1 molar ratio for 90 min. Samples were analysed by SDS–PAGE as described above.Matrix-assisted laser desorption/ionization-time of flight (MALDI-TOF) mass spectrometry of the antibody conjugates was performed to determine the number of conjugates per antibody at the Alberta Proteomics and Mass Spectrometry Facility at the University of Alberta in Canada.Size-exclusion chromatography–high performance liquid chromatography (SEC–HPLC) was performed using an Agilent 1260 Infinity II and a Biozen 3 µm dSEC-2 column (200 Å, 300 × 7.8 mm, Phenomenex). A flow rate of 1 ml min–1 was used with a mobile phase of PBS buffer for 15 min. Samples were detected at 280 nm. Data collection and analyses were performed using Laura software (LabLogic).TEM of the antibodies was performed at the Washington University Center for Cellular Imaging. In brief, 20 µl trastuzumab (single antibody) or click trastuzumab–TCO plus trastuzumab–tetrazine samples (10 µg ml–1 in mQ water; random and site-specific) were adsorbed for 60 s onto carbon-coated 200 mesh copper grids (01840-F, Ted Pella), which had been glow-discharged for 30 s in a Solarus 950 plasma cleaner (Gatan). After sample adsorption, the grids were washed 5 times with ultrapure water and stained for 2 min with freshly prepared 0.75% uranyl formate. Excess stain was blotted off using filter paper (Whatman no. 2, Fisher Scientific) before air drying. Grids were imaged using a JEOL JEM-1400Plus microscope (JEOL) at an operating voltage of 120 kV with a NanoSprint15-MkII 16-megapixel sCMOS camera (Advanced Microscopy Techniques). For 2D classification analysis, images were collected at a nominal magnification of ×30,000, which corresponded to a pixel size of a 3.54 Å. Data processing was done with Relion 3.1 (PMID: 30412051). In brief, particles were picked using Laplacian-of-Gaussian blob detection and then extracted with box sizes of 128 or 250 pixels for the single antibody and click samples, respectively. Particles underwent multiple rounds of 2D classification, and the clearest classes were selected for display.Western blot analysesWestern blot of tumour and cell lysates was performed using our previously reported methods3. Primary antibodies included rabbit anti-HER2 (1:800; ab131490, Abcam), rabbit anti-EGFR (1:1,000; ab52894, Abcam), mouse anti-β-actin (1:10,000; A1978, Sigma), DM1 monoclonal antibody (1:1,000; Invitrogen, MA5-42528) and anti-trastuzumab antibody (2.5 µg ml–1; Biotechne, MAB95471-SP). After overnight incubation with the primary antibodies at 4 °C, membranes were washed 3 times with Tris-buffered saline containing Tween-20 buffer (TBS-T) with gentle agitation and then incubated with the following secondary antibodies for 1 h at room temperature: anti-rabbit goat IgG conjugated with Alexa Fluor 680 (1:10,000; Invitrogen, A-21076), anti-mouse goat IgG conjugated with Alexa Fluor 800 (1:10,000; Invitrogen, A32730) and anti-human goat IgG conjugated with Alexa Fluor 680 (1:1,000, ThermoFisher, SA000069). Membranes were washed three times and scanned using an Odyssey CLx imaging system (LI-COR). Western blot source data are provided in Supplementary Fig. 1.IgG–DM1 preparationHuman IgG isotype control (Invitrogen, 31154) was conjugated to SMCC-DM1 (MedChemExpress, HY-101070) at a 1:5 molar ratio in PBS (pH 8.7) at 37 °C, 500 rpm for 1 h. The resulting IgG–DM1 conjugate was purified using a desalting column (PD-10) and concentrated using an Amicon filter with a 50 kDa molecular weight cutoff in 1× PBS (pH 7.4).To validate the conjugation of IgG to DM1, IgG and IgG–DM1 were run on a SDS–PAGE gel (Invitrogen) and then transferred to a polyvinylidene difluoride membrane (iBlot, Invitrogen) using an iBlot 2 Gel transfer system (Invitrogen). The membrane was washed and stained with an anti-DM1 monoclonal antibody. Before analysis, the gel was stained using a Pierce Mini Gel Power Staining kit. Protein bands were imaged using an Odyssey CLx imaging system (LI-COR). Western blot source data are provided in Supplementary Fig. 1.For the generation of IgG–DM1–tetrazine, IgG–DM1 was conjugated to tetrazine–PEG5-NHS-ester as described for the antibody–tetrazine random conjugation procedure.In-cell western assayNCIN87 cancer cells (24,000 cells per well) were plated in a 96-well plate and incubated at 37 °C in 5% CO2. After 24 h, the cells were fixed with 4% (v/v) paraformaldehyde (PFA) at room temperature for 20 min, washed with PBS and permeabilized with 0.25% Triton X-100 prepared in PBS containing 0.02% BSA and 0.02% NaN3. The NCIN87 cells were blocked with 1% BSA prepared in PBS containing 0.02% BSA and 0.02% NaN3 at room temperature for 30 min and incubated at 4 °C overnight with trastuzumab, trastuzumab–tetrazine, trastuzumab–ss-tetrazine, panitumumab, panitumumab–TCO or panitumumab–ss-TCO. All antibodies were prepared at 100 nM in 1% BSA in PBS. Cells were washed with PBS, followed by incubation with anti-human goat IgG conjugated with AlexaFluor 680 (1:1,000; ThermoFisher, SA000069) at room temperature for 1 h. The plates were scanned using an Odyssey CLx imaging system (LI-COR), and quantifications were performed using Empiria Studio software (v.3.2).In vitro serum reactivity of antibody click pairsPanitumumab–TCO or trastuzumab–tetrazine was incubated in mouse serum (Sigma-Aldrich, M5905) at a final concentration of 5 mg ml–1 in a 1:1 mixture (PBS to mouse serum) at 37 °C, 500 rpm for 0, 4 or 24 h. At each time point, 5 µg of the corresponding antibody was collected and reacted with its complementary click pair in PBS (20 µl) at 37 °C, 500 rpm for 90 min. For the no-click group, unmodified panitumumab was used.To evaluate antibody click reactivity following incubation in mouse serum, click and no-click reaction samples were analysed by SDS–PAGE and transferred onto polyvinylidene difluoride membranes as described above (see the section ‘IgG–DM1 preparation’). Membranes were washed in TBS-T and stained with revert 700 total protein (LI-COR, 92611016) according to the manufacturer’s instructions. Membranes were then incubated with anti-human goat IgG conjugated with Alexa Fluor 680 (1:5,000) in 5% BSA in TBS-T at room temperature for 1 h. Following washing, images were acquired using an Odyssey CLx imaging system (LI-COR). Western blot source data are provided in Supplementary Fig. 1.ImmunofluorescenceFor immunofluorescence assays, TCO-conjugated or tetrazine-conjugated antibodies were labelled with Alexa Fluor 488 NHS ester (Thermo Fisher Scientific, A20000) or Alexa Fluor 594 NHS ester (Thermo Fisher Scientific, A20004) at a molar ratio of 4 fluorophores per antibody at 37 °C, 450 rpm for 1 h in PBS (pH 8.8). The fluorescently labelled antibody conjugates were purified via desalting chromatography (PD-10) and concentrated using 50 kDa molecular weight cutoff Amicon filters in 1× PBS (pH 7.4). For control studies, unconjugated antibodies were labelled with Alexa Fluor 488 NHS ester.Confocal microscopyNCIN87 and MIAPaCa-2 cancer cells (1 million cells) were grown on coverslips of 1.5 mm thickness (ThermoFisher Scientific, 12-542B) pretreated with poly-l-lysine (Sigma-Aldrich) for 24 h. Cells were then first incubated with 100 nM panitumumab (no click) or panitumumab–TCO (click) conjugated with Alexa Fluor 488 in cell culture medium at 4 °C for 30 min. Next, the cells were washed to remove unbound antibodies with PBS (containing Ca2+ and Mg2+, DPBS) and incubated with 100 nM trastuzumab–tetrazine conjugated with Alexa Fluor 594 in cell culture medium at 37 °C in 5% CO2 for 3 or 24 h. Cells were then washed with PBS and fixed with 4% PFA for 20 min at room temperature before incubation with 4′,6-diamidino-2-phenylindole (DAPI; 1:5,000, Santa Cruz Biotechnology) for 5 min. Fluorescence images were acquired using a ×63 oil-immersion objective using a Zeiss 980 microscope (excitation at 488, 561 and 405 nm, and emission at 499–570, 577–642 and 420–478 nm) at the Washington University Center for Cellular Imaging.For studies in which pertuzumab was used as the first pair of antibody click, the experimental procedure was performed in NCIN87 cancer cells as described above, but replacing panitumumab or panitumumab–TCO with pertuzumab or pertuzumab–TCO conjugated with Alexa Fluor 488, respectively.Experiments of LAMP1 staining were performed after 3 h of incubation with trastuzumab–tetrazine conjugated with Alexa Fluor 594, as described above. Then, cells were fixed with 4% PFA for 20 min at room temperature, permeabilized for 5 min with 0.2% Triton X-100 prepared in PBS containing 0.02% BSA and 0.02% NaN3 and blocked with 1% BSA in TBS-T for 30 min at room temperature. Cells were incubated with CoraLite Plus 647 anti-human CD107a/LAMP1 (1:400; Proteintech, CL647-65051) for 1 h at room temperature. Fluorescence images were acquired using a ×63 oil-immersion objective using a Zeiss 980 microscope (excitation 639 nm, and emission 660–750 nm) at the Washington University Center for Cellular Imaging.Immunofluorescence with site-specific conjugations was performed in MIAPaCa-2 cancer cells as described above, but incubating trastuzumab–ss-tetrazine for 1 h at 37 °C in 5% CO2. For the pre-click condition, panitumumab–ss-TCO conjugated with Alexa Fluor 488 and trastuzumab–ss-tetrazine conjugated with Alexa Fluor 594 were reacted for 90 min at 37 °C at a 1:1 molar ratio before incubation with cells. Fluorescence images were acquired using a ×60 oil-immersion objective using an EVOS M5000 imaging system (excitation at 482 and 585 nm, and emission at 524 and 628 nm).Fluorescence quantificationNCIN87 (20,000 cells) and MIAPaCa-2 (15,000 cells) cancer cells were plated in a 96-well plate and incubated at 37 °C in 5% CO2. After 24 h, the cells were first incubated with 100 nM panitumumab (no click) or panitumumab–TCO (click) conjugated with Alexa Fluor 488 in culture medium at 4 °C for 30 min. Next, the cells were washed with PBS (containing Ca2+ and Mg2+, DPBS) and incubated with 100 nM trastuzumab–tetrazine conjugated with Alexa Fluor 594 in culture medium at 37 °C in 5% CO2 for 3 h. Cells were then washed with PBS, and fluorescence intensity (excitation at 488 and585 nm, emission at 530 and 626 nm) was measured using a BioTek Synergy H1 microplate reader (Agilent). Protein quantification was performed by lysing the cells in PBS containing 1% (m/v) SDS and measured by BCA assay.pHrodo internalization assayTrastuzumab–tetrazine was labelled with the amine-reactive pHrodo Red (ThermoFisher, P36600) according to the manufacturer’s instructions at a molar ratio of 19:1 (dye to antibody). In brief, trastuzumab–tetrazine in 0.1 M NaHCO3 (pH 8.3) was incubated with pHrodo red succinimidyl ester at room temperature for 1 h. The resulting conjugate was purified using Zeba spin desalting column (7 K MWCO, 0.5 ml, ThermoFisher, 89882) in 1× PBS pH 7.4. For control, IgG–tetrazine was conjugated to pHrodo Red succinimidyl ester.NCIN87 (24,000 cells), MIAPaCa-2 (15,000 cells), MDA-MB-231 (15,000 cells), CT26 (15,000 cells) and CT26-hHER2 (15,000 cells) cancer cells were plated in a 96-well plate and incubated at 37 °C in 5% CO2. After 24 h, the cells were first incubated with 5 µg ml–1 panitumumab (no click) or panitumumab–TCO (click) in cell culture medium at 4 °C for 30 min. Next, the cells were washed with PBS (containing Ca2+ and Mg2+, DPBS) and incubated with 5 µg ml–1 trastuzumab–tetrazine conjugated with pHrodo. Live-cell imaging was performed on an IncuCyte S3 (excitation at 565–605 nm, emission at 625–705 nm) under a ×10 objective at an interval of 1 h at 37 °C at the Siteman Flow Cytometry Core. For pHrodo assays with site-specific conjugates, the procedure was performed as described above, using 10 µg ml–1 of the corresponding antibodies. Data were collected at an interval of 2 h at 37 °C.IHC and co-registrationIHC staining of HER2 and EGFR was performed on formalin-fixed, paraffin-embedded sections (4 µm) of NCIN87, A431, MIAPaCa-2, admix model and CT26-hHER2 subcutaneous tumours. For paraffin-embedding and sectioning, tumours were submitted to the Pulmonary Morphology Core at Washington University School of Medicine. For NCIN87, A431 and MIAPaCa-2 tumours, sections were submitted to HistoWiz for HER2 and EGFR staining. For the admixed tumours, EGFR IHC was performed by HistoWiz, and HER2 by the Anatomic and Molecular Pathology core laboratory. For CT26-hHER2, sections were submitted to the Laboratory of Comparative Pathology at Memorial Sloan Kettering Cancer Center for HER2 staining.To assess how EGFR and HER2 proteins are distributed across the same tumour tissue, we used automated image analysis58. First, we digitally aligned (co-registered) the stained tissue images by enhancing contrast, reducing background noise and matching key tissue structures between the two. This process ensured that the same regions of tissue could be directly compared. Next, we segmented each image to isolate the areas with the highest levels of protein staining. This step involved identifying and highlighting distinct regions corresponding to high EGFR or HER2 signals. Together, these steps enabled us to quantify and visualize the extent to which the two proteins overlapped in each tumour via DSC. Additional details involving the co-registration methods are provided in Supplementary Information.Antibody radiolabellingAntibodies used in this work were radiolabelled with 89Zr or 64Cu according to published methods38,59. 89Zr and 64Cu were purchased from the WUSTL Cyclotron and Nuclear Pharmacy. In brief, antibodies were first conjugated with the chelators p-isothiocyanatobenzyl-desferrioxamine (DFO-Bz-NCS; Macrocyclics) or 2-S-(4-isothiocyanatobenzyl)-1,4,7-triazacyclononane-1,4,7-triacetic acid (p-SCN-Bn-NOTA, Macrocyclics) and then radiolabelled with 89Zr or 64Cu, respectively. Antibodies were purified after conjugation and radiolabelling using desalting columns (PD-10) and concentrated using Amicon filters with a 50 kDa molecular weight cutoff. Radiolabelled antibodies used in the study had a radiochemical yield and purity above around 95%.For bispecific antibody radiolabelling, BSCFV-155 (Creative Biolabs; anti-EGFR based on clone C225 and anti-HER2 based on clone 4D5) was conjugated with p-SCN-Bn-NOTA and radiolabelled with 64Cu as previously described59. Serum stability was performed following a previously described method59. In brief, 10 µCi (0.37 MBq) of the purified radiolabelled antibody was incubated with human serum at 37 °C for 48 or 72 h.PET–CT imaging and biodistribution studiesFemale nu/nu mice (6–8 weeks old) or female BALB/c mice (4–6 weeks old), purchased from Charles River Laboratories, were used for imaging studies. Tumour implantation and tumour models used are summarized in Supplementary Table 4. The tumour volume was estimated by external vernier caliper measurements of the longest axis, α (in mm), and the axis perpendicular to the longest axis, b (in mm). The tumours were assumed to be spheroidal, and the volume was calculated in accordance with the equation V = (4π/3) × (α/2)2 × (b/2). PET–CT imaging was performed when tumour volumes reached approximately 150–200 mm3.For random conjugates, mice were first injected with TCO-conjugated antibodies (50 µg). At 24 or 48 h after injection, mice were injected with [89Zr]Zr-DFO-trastuzumab–tetrazine or [64Cu]Cu-NOTA-trastuzumab–tetrazine (7.4 MBq, 50 µg) and used for both biodistribution and PET–CT imaging studies. Control groups included 64Cu/89Zr-labelled trastuzumab (single antibody) or panitumumab–TCO plus [64Cu]Cu-NOTA-IgG–tetrazine (control IgG click). Acute biodistribution and PET–CT imaging studies were performed at 48 h or 24 h after tail vein injection of the tetrazine-conjugated radiolabelled antibodies.For site-specific conjugations, mice were first injected with panitumumab–ss-TCO (50 µg). At 24 h after injection, mice were injected with [89Zr]Zr-DFO-trastuzumab–ss-tetrazine or [64Cu]Cu-NOTA-trastuzumab–ss-tetrazine (7.4 MBq, 50 µg). PET–CT images were acquired at 24 h for [64Cu]Cu-NOTA-trastuzumab–ss-tetrazine or at 24, 48, 72, 96 and 120 h for [89Zr]Zr-DFO-trastuzumab–ss-tetrazine. Acute biodistribution studies were performed at the last point of the PET–CT imaging study. Control groups included IgG–ss-TCO plus [89Zr]Zr-DFO–trastuzumab–ss-tetrazine (control IgG click) or antibodies pre-clicked (panitumumab–ss-TCO pre-clicked with [89Zr]Zr-DFO-trastuzumab–ss-tetrazine) before being injected.Mice used for biodistribution studies were euthanized by controlled carbon dioxide overdose followed by cervical dislocation, and organs were collected and weighed. Radioactivity associated with each organ was assessed using a gamma counter (2480 Wizard, PerkinElmer) and quantified as a percentage of the injected dose per gram of the organ (%ID g–1).PET–CT imaging was conducted in a Mediso nanoScan PET–CT scanner at 24–120 h after injection of the radiolabelled antibodies modified with or without tetrazine. The mice were anaesthetized by inhalation of 2% isoflurane (Baxter Healthcare) in an oxygen gas mixture 5 min before the PET–CT experiments. CT scanning was recorded for 5 min to obtain anatomical information, followed by a static PET scan for 20 min. PET–CT images were analysed using Imalytics Preclinical software (v.3.1, Gremse-IT). PET–CT images were calibrated as a percentage of injected dose per millilitre (%ID ml–1). Regions of interest were delineated in the tumour, and activity values were obtained as mean %ID ml–1.In vivo pharmacokinetic studiesFemale and male nu/nu mice (4–5 weeks old; n = 12) or female BALB/c mice (4–5 weeks old; n = 7) were obtained from Charles River Laboratories. Mice were intravenously injected with 5 mg kg–1 panitumumab–TCO (nu/nu mice) or pertuzumab–TCO (BALB/c mice). At 24 h after injection, the mice received a second intravenous injection of 5 mg kg–1 trastuzumab–tetrazine. Blood samples were collected by cardiac puncture at 5 min, 30 min, 4 h, 16 h and 24 h after administration of trastuzumab–tetrazine, after euthanizing the mice. Blood was coagulated at room temperature for 30 min, and serum was obtained after centrifugation at 2,000g at 4 °C for 15 min. Then, 1 µl serum was diluted with 14 µl PBS and 5 µl loading buffer (Laemmli buffer), subjected to SDS–PAGE electrophoresis and western blot analyses. Membranes were stained with revert 700 total protein, anti-human goat IgG conjugated with AlexaFluor 680 (1:5,000) and anti-trastuzumab antibody (2.5 µg ml–1, Biotechne, MAB95471-SP) in 5% BSA in TBS-T. Protein bands were visualized using an Odyssey CLx imaging system. Western blot source data are provided in Supplementary Fig. 1.Antibody–ADC click therapeutic efficacy studies (random and site-specific)Female and male nu/nu mice (6–8 weeks old) or female BALB/c mice (4–6 weeks old) were obtained from Charles River Laboratories. Information regarding tumour models is provided in Supplementary Table 4. Tumour volumes were measured twice a week by external caliper measurements of the longest axis, α (in mm), and the axis perpendicular to the longest axis, b (in mm). The tumours were assumed to be spheroidal, and the volume was calculated in accordance with the equation V = (4π/3) × (α/2)2 × (b/2). Once tumour volumes reached 100–250 mm3, ADC treatments were initiated, and doses were selected on the basis of commonly used preclinical dosing ranges for ADC studies, including those reported for T-DXd in mouse tumour models4,5,60,61. Humane end points were defined as tumour volumes >1,500 mm3, body-weight loss of >20%, tumour ulceration and other clinical symptoms of acute toxicity. At the terminal stage, selected tumours were collected for western blot analyses. Stratified random sampling was used to assign the mice randomly to experimental or control groups to ensure comparable tumour size at baseline. The personnel involved in tumour measurements and mouse weight were blinded to the treatment groups.Gastric cancer model (NCIN87)Female or male nu/nu mice inoculated with NCIN87 xenografts were stratified into the following two groups: no click (panitumumab plus T-DXd; n = 6) or click (panitumumab–TCO plus T-DXd–tetrazine; n = 6). Panitumumab or panitumumab–TCO was administered at 10 mg kg–1 via the tail vein. At 24 h after injection, the mice received an intravenous injection of T-DXd or T-DXd–tetrazine (10 mg kg–1).Bilateral tumour modelFemale and male nu/nu mice were subcutaneously injected with NCIN87 and A431 cancer cells inoculated in the right and left flanks, respectively. Mice were randomized into three groups: saline (n = 5), no click (panitumumab plus T-DXd, n = 9) or click (panitumumab–TCO plus T-DXd–tetrazine, n = 9). Panitumumab or panitumumab–TCO was administered at 5 mg kg−1 via the tail vein. At 24 h after injection, mice received an intravenous injection of T-DXd or T-DXd–tetrazine (5 mg kg–1).NCIN87 gastric cancer model of acquired resistance to T-DXdMale and female nu/nu mice inoculated with NCIN87 xenografts (n = 16) were treated with T-DXd monotherapy intravenously (5 mg kg–1). Nearly 1 month after therapy initiation, mice were stratified into responders versus non-responders on the basis of tumour volume measurements. Tumours from responder and non-responder tumours were subjected to western blot analyses and HER2-targeting PET imaging. Responder tumours were defined as having a fold change in tumour volume lower than or equal to 0 and a decrease in HER2 by PET. A fold change in tumour volume for non-responders was close to 1, and demonstrated an increase in EGFR protein levels as detected by western blotting. HER2-targeting immuno-PET was performed at 24 h after intravenous injection of [64Cu]Cu-NOTA-trastuzumab (50 µg, 7.4 MBq). The mice that initially did not respond to T-DXd therapy (non-responder) were treated intravenously with panitumumab–TCO (5 mg kg–1) on day 1 and with T-DXd–tetrazine on day 2 (5 mg kg–1).BT474 trastuzumab-resistant modelFemale nu/nu mice were subcutaneously implanted with oestrogen-receptor-positive BT474 trastuzumab-resistant cells (n = 10). Drinking water of mice was supplemented with 0.67 μg ml–1 β-oestradiol (Sigma) from 1 week in advance of tumour inoculation and continued until mice were killed. Fresh oestradiol-supplemented water was provided twice a week. T-DXd monotherapy (5 mg kg–1) was initiated when the tumour volume reached 200–500 mm3. Nearly 1 month after therapy initiation, mice were stratified into responders versus non-responders on the basis of tumour volume measurements. Non-responder mice were treated with pertuzumab–TCO (5 mg kg–1) on day 1. Mice were then injected with T-DXd–tetrazine (5 mg kg–1) on day 2, and tumour volumes were measured twice a week.Immunocompetent CT26-hHER2 modelFemale BALB/c mice were subcutaneously injected with CT26-hHER2 cancer cells. Mice were randomized into five cohorts: saline (n = 7), pertuzumab (n = 9), T-DXd (n = 9), no click (pertuzumab plus T-DXd, n = 14) or click (pertuzumab–TCO plus T-DXd–tetrazine, n = 14). Pertuzumab or pertuzumab–TCO was administered at 5 mg kg–1 via the tail vein. At 24 h after injection, mice received an intravenous injection of T-DXd or T-DXd–tetrazine (5 mg kg–1). For individual antibodies (pertuzumab or T-DXd), animals received a single dose at 5 mg kg–1.Admixed breast tumour model (random and site-specific)Female mice (nu/nu) inoculated with admixed breast tumour (MDA-MB-231 plus JIMT1) xenografts were divided into nine groups: saline (n = 10), panitumumab (n = 10), T-DXd (n = 10), T-DM1 (n = 10), T-DXd no click (panitumumab plus T-DXd, n = 10), T-DM1 no click (panitumumab plus T-DM1, n = 10), T-DXd click random (panitumumab–TCO plus T-DXd–tetrazine, n = 14), T-DXd click site-specific (panitumumab–ss-TCO plus T-DXd–ss-tetrazine, n = 10) or T-DM1 click random (panitumumab–TCO plus T-DM1–tetrazine, n = 6). The admixed breast tumour model was developed by co-injecting HER2+ JIMT1 and HER2– MDA-MB-231 breast cancer cells at a 4:1 ratio at the time of implantation. Panitumumab or panitumumab–TCO (random or site-specific) was administered at 5 mg kg–1 via the tail vein. At 24 h after injection, mice received an intravenous injection of 5 mg kg–1 T-DXd, T-DM1, T-DM1–tetrazine or T-DXd–tetrazine (random or site-specific). For individual antibodies (panitumumab, T-DM1 or T-DXd), animals received a single dose at 5 mg kg–1.Pancreatic tumour model (random and site-specific)Female or male mice (nu/nu) inoculated with MiaPaCa-2 pancreatic xenografts were divided into 13 groups: saline (n = 8), panitumumab (n = 10), T-DXd (n = 10), T-DM1 (n = 10), T-DXd no click (panitumumab plus T-DXd, n = 10), T-DM1 no click (panitumumab plus T-DM1, n = 10), T-DXd click random (panitumumab–TCO plus T-DXd–tetrazine, n = 10), T-DM1 click random (panitumumab–TCO plus T-DM1–tetrazine, n = 10), IgG–DM1 (n = 8), IgG–DM1 no click (panitumumab plus IgG–DM1, n = 6), IgG–DM1 click random (panitumumab–TCO plus IgG–DM1–tetrazine, n = 6), T-DXd click site-specific (panitumumab–ss-TCO plus T-DXd–ss-tetrazine, n = 10) or T-DXd click random in the presence of excess tetrazine (panitumumab–TCO plus T-DXd–tetrazine in the presence of 5 mg kg–1 NHS-PEG5-tetrazine). Panitumumab or panitumumab–TCO (random or site-specific) was administered at 5 mg kg–1 via the tail vein. At 24 h after injection, mice received an intravenous injection of 5 mg kg–1 T-DXd, T-DM1, T-DM1–tetrazine or T-DXd–tetrazine (random or site-specific). For individual antibodies (panitumumab, T-DM1, IgG–DM1 or T-DXd), animals received a single dose at 5 mg kg–1.Toxicology studiesTo assess the potential for antigen-independent toxicity, female BALB/c mice (n = 24) were purchased from Charles River Laboratories. For serum chemistry analyses, mice were randomized into four groups: saline (n = 7), no click (panitumumab plus T-DXd, n = 4), random click (panitumumab–TCO plus T-DXd–tetrazine, n = 3) or site-specific click (panitumumab–ss-TCO plus T-DXd–ss-tetrazine, n = 4). Panitumumab, panitumumab–TCO or panitumumab–ss-TCO was intravenously injected at 20 mg kg–1. At 24 h after injection, mice received an intravenous administration of T-DXd, T-DXd–tetrazine or T-DXd–ss-tetrazine (20 mg kg–1). Blood samples were analysed 15 days after administration of antibodies to measure the levels of enzymes associated with liver function, specifically AST, ALT and ALP.For random and site-specific click groups (n = 3 per group), selected organs (lungs and liver) were collected and formaldehyde-fixed for histopathology 7 days after administration of antibodies. Liver and lung tissue slices were stained with haematoxylin and eosin. Damage was evaluated by microscopy by a board-certified pathologist at the Division of Comparative Medicine at Washington University as summarized in Supplementary Table 2.Statistical analysesFluorescence quantification and biodistribution data were analysed using ANOVA followed by Student’s t-tests. These analyses were conducted using GraphPad Prism (v.9; www.graphpad.com) and R statistical (v.4.4.0) software.Longitudinal PET image quantification data were analysed using a linear regression model with group, time and their interaction term. For tumour uptake (Extended Data Fig. 5b), for which the groups showed diverging accumulation rates over time, we used the emtrends function from the emmeans package to estimate the slope for each group and to perform pairwise contrasts of slopes with Tukey’s correction for multiple comparisons. This tests whether the temporal rate of antibody accumulation differs between groups. For liver uptake (Extended Data Fig. 5c), for which accumulation trajectories were roughly parallel across groups, we first confirmed that the group × time interaction term was not significant (F-test, P = 0.46) and then fit a no-interaction model. Group mean differences were estimated and compared using Tukey-adjusted pairwise contrasts from this model. For point comparisons at the 120 h end point cited in the main text, we fit a one-way linear model restricted to 120 h observations and obtained pairwise contrasts with Tukey’s correction (tumour) or a two-sample equal-variance t-test (liver, click versus pre-click).For tumour volume comparison, the longitudinal data were analysed using a linear mixed-effects model with a first-order autoregressive (AR(1)) correlation structure to account for correlations among repeated measures from the same mouse. We included all time points at which every treatment group had data to perform balanced comparisons across groups. The mixed model included the treatment group, time points and the interaction term between group and time points. The P value of the interaction term from the type III (marginal) analysis was used to assess whether tumour volume fold change trajectories differed between treatment groups across time points. To quantify effect sizes, pairwise contrasts between each treatment group and the click group were estimated at the final common time point using the emmeans package (v.1.10.7), with Dunnett’s correction for multiple comparisons. Dunnett’s test was chosen over Bonferroni because it accounts for the positive correlation among contrasts that share a common reference group. As a pre-specified primary comparison, we also fit a separate model restricted to the click and no-click groups. This model used all time points at which both groups have data, extending the observation window beyond the final time point available in the full five-group model (which is constrained by the earlier dropout of control groups). Differences are reported on the fold change scale (relative to day 0 tumour volume) with 95% confidence intervals. Models were fit using restricted maximum likelihood via the nlme package (v.3.1-166) in R (v.4.4.0).Survival was compared across treatment groups using the log-rank test. Pairwise comparisons between all group pairs were performed with Bonferroni correction for multiple testing. Hazard ratios with 95% confidence intervals were estimated using Cox proportional hazards regression. Kaplan–Meier survival curves were generated for visualization. All survival analyses were conducted using the survival package (v.3.5-8) at the two-sided 5% significance level.Reporting summaryFurther information on research design is available in the Nature Portfolio Reporting Summary linked to this article.
Modular in vivo antibody–ADC click to reverse drug resistance in tumours - Nature
In vivo ligation of clinically used therapeutic antibodies via bioorthogonal click chemistry to antibody–drug conjugates leads to enhanced antitumour activity in heterogeneous and treatment-resistant tumours.
15,524 words~71 min read