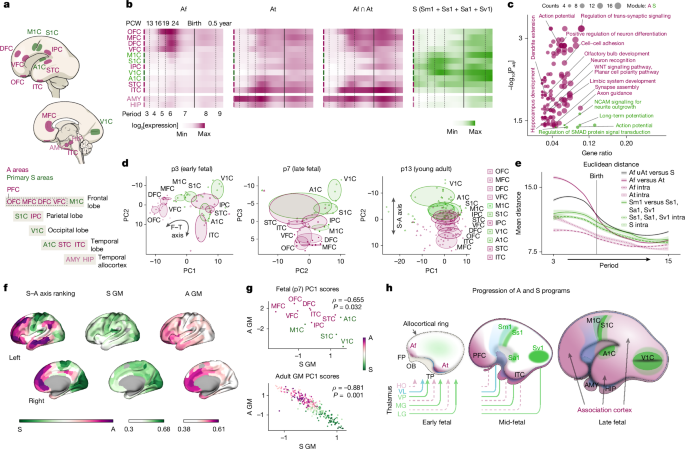
MainA central challenge in neuroscience concerns understanding how large-scale networks of the cerebral cortex develop into a modular yet hierarchically organized structure underlying complex cognitive functions1. Multiple aspects of cortical structure and function are organized along a dominant S–A axis1,2,3. At one end of this axis, modality-specific (unimodal) primary sensory and motor (sensorimotor) areas form dense local networks that process sensory inputs or mediate motor output4,5,11. At the other end, transmodal association hubs in the prefrontal, posterior parietal and temporal cortices are interconnected by distributed networks of long-range axons, enabling information integration across modalities to support complex and abstract cognition5,6,7,8,9,11.Topographically, sensorimotor areas appear as focal islands within a vast ocean of association cortex, resulting in the distinct spatial organization of the S–A axis12. While this topographical organization is conserved across mammals, the relative proportion of primary versus association cortex varies considerably between species, partly reflecting adaptive specializations12. In humans, transmodal association cortices have undergone the greatest evolutionary expansion relative to non-human primates and exhibit neoteny during postnatal development, which is thought to be linked to both our enhanced cognitive abilities and increased susceptibility to certain neuropsychiatric and neurodegenerative conditions3.Foundational understanding of cortical arealization and circuit development comes largely from studies of primary sensorimotor regions focused on the interplay between intrinsic molecular gradients within progenitor cells and the extrinsic influences of peripheral sensory signals conveyed through first-order (FO) thalamocortical afferents (TCAs)13,14,15,16,17,18,19,20,21. FO TCAs drive the patterning of primary sensorimotor areas through a combination of spontaneous patterned activity (for example, spontaneous retinal waves), stimulus-evoked activity (for example, eye opening) and thalamus-derived molecules14,15,18,19,22. These signals interact with immature neocortical neurons to induce key primary area-specific properties, including gene expression, cytoarchitecture and corticocortical connectivity. Their spatially constrained and inductive properties serve as patterning anchors for activity-dependent mechanisms that, in a sensoritopic manner, also shape surrounding prospective association networks across multiple levels of the S–A hierarchy7,14,15,23,24.By contrast, the development and evolution of unimodal and transmodal association cortices remain poorly understood1,3,7,8,9,10,11,12. Several key questions remain regarding whether transmodal cortices are patterned by the same mechanisms that shape primary and unimodal sensorimotor association cortices; how transmodal neurons establish long-range connections across vast distances while avoiding primary areas; why distributed networks feature frontoparietotemporal transmodal hubs and frequently engage the prefrontal cortex (PFC) and allocortex; why association areas exhibit graded transitions, in contrast to the sharply defined boundaries delimiting primary areas; and whether the evolutionary expansion of transmodal cortex in primates has necessitated distinct developmental mechanisms11.To address these questions, we present converging lines of evidence supporting a new conceptual framework of S–A axis development: the MIND model. This model posits that competing transcriptomically defined identity programs, emerging around the neocortical centre and the frontotemporal (F–T) poles, differentiate primary sensorimotor areas from surrounding association networks through complementary processes of induction and exclusion. Together, these dual processes provide a generalizable mechanism for establishing the hierarchical organization of the cortex.Emerging signatures along developing S–A axisTranscriptomic differences between developing neocortical areas are temporally regulated, with a transient peak in interareal gene expression variability occurring during early- to mid-fetal development25,26,27,28,29. This phase is marked by prominent opposing transcriptomic gradients in the prospective association cortices of the frontal and temporal lobes, alongside more localized patterns in the prospective primary sensorimotor areas25,26,27,28,29. We hypothesized that these transcriptomic patterns reflect distinct developmental programs that shape prospective primary sensorimotor and association cortices through separate mechanisms that interact to give rise to the hierarchically organized S–A axis.To investigate this hypothesis, we generated gene modules (GMs) based on co-expression enrichment in prospective primary sensorimotor or association cortices during fetal periods (p) 3–7 (for period definitions, see Supplementary Table 1) using data from human26,28 and macaque brains29. We analysed four putative primary areas (primary motor cortex (M1C), primary somatosensory cortex (S1C), primary visual cortex (V1C) and primary auditory cortex (A1C)) and seven association areas (orbital prefrontal cortex (OFC), medial prefrontal cortex (MFC), dorsal/dorsolateral prefrontal cortex (DFC/dlPFC), ventrolateral prefrontal cortex (VFC), inferior–posterior parietal cortex (IPC), and superior and inferior temporal cortex (STC and ITC)); we also included the temporal allocortical amygdala (AMY) and hippocampus (HIP) (Fig. 1a and Methods). Two association (A) sub-GMs were defined: frontal (Af), corresponding to prospective PFC regions, and temporal (At), corresponding to prospective temporal association cortices (STC and ITC); four sensorimotor (S) sub-GMs were defined, corresponding to prospective primary areas: motor (Sm1), somatosensory (Ss1), visual (Sv1) and auditory (Sa1). We used three independent datasets to generate GMs (human microarray26, human RNA-sequencing (RNA-seq)28 and macaque RNA-seq29; Supplementary Tables 2–4), and curated stringent GMs containing genes that were present in all three datasets, which we refer to as shared GMs. We then examined their spatiotemporal expression patterns (Fig. 1b, Extended Data Figs. 1 and 2a and Supplementary Table 5).Fig. 1: Anti-correlated sensorimotor and association modules define the S–A axis.a, The regions analysed in the mid-fetal human brain. b, Shared GM heat maps showing log2-transformed median value of the mean gene expression across all samples from a given region and period. Af ∩ At, the intersection of Af and At genes; S, genes present in any sensorimotor (S) module (union). c, GSEA bubble plot for the association (union of Af and At genes) and sensorimotor (Sm1, Ss1, Sa1 and Sv1 union) GMs. Two-sided hypergeometric test with Benjamini–Hochberg FDR correction. d, PCA of shared sensorimotor and association (A) GM genes plotted against the indicated PCs. Ellipses are centred on the mean of points from each indicated region; axis lengths correspond to the s.d. of each component. In period 7 (p7), PC1 reflected sample quality and was therefore omitted. e, Euclidean distance between the indicated regional groups (shared modules). Intra refers to the Euclidean distance between areas within the indicated module. IPC was included in the At module for this analysis. Confidence interval, 0.95. f, Cortical surface renderings showing parcel rankings along the archetypal S–A axis3 and the mean adult gene expression across genes in the shared sensorimotor or association GMs, respectively31. g, The relationship between sensorimotor GM PC1 and association GM PC1 scores based on normalized gene expression for period 7 (top Spearman’s ρ = −0.655, pshuffled = 0.032, two-tailed) and adult (bottom, Spearman’s ρ = −0.881, pspin = 0.0001, two-tailed). For period 7 (top), regions are coloured according to a; for adult (bottom), regions are coloured by position along the archetypal S–A axis. h, Schematic of the MIND model. FP, frontal pole; OB, olfactory bulb; TP, temporal pole. Thalamic nuclei: HO, higher-order (dashed purple lines); VL, ventral lateral; VP, ventral posterior; MG, medial geniculate; LG, lateral geniculate. Panel a adapted from ref. 41, Springer Nature Ltd.Gene set enrichment analysis (GSEA) identified axon guidance, cell–cell adhesion, limbic system development, trans-synaptic signalling, retinoic acid (RA) signalling and WNT signalling in the association GM (combined Af and At), and action potential generation, long-term potentiation, SMAD signalling and NCAM-mediated neurite outgrowth processes among others in the sensorimotor GM (combined Sm1, Ss1, Sa1 and Sv1) (Fig. 1c, Extended Data Fig. 3 and Supplementary Tables 6–9). We observed autism spectrum disorder risk genes enriched across GMs and datasets (Extended Data Fig. 4 and Supplementary Tables 10–13). Analysis of single-cell RNA-seq (scRNA-seq) data from prospective primary and association areas of the mid-fetal human neocortex30 revealed that sensorimotor and association GM genes were expressed across diverse cell types, including both excitatory projection neurons (ExNs) and inhibitory neurons, and exhibited distinct laminar and regional patterns (Extended Data Fig. 5).Pericentral and central programsWe observed the emergence of the Af and At GMs in prospective association areas and allocortex surrounding the F–T poles, followed by their apparent progression towards geometrically central cortical regions while largely avoiding prospective primary sensorimotor areas (Fig. 1b and Extended Data Figs. 1b,c,g, 2a,b and 3). Specifically, Af expression peaked first in frontal regions and then in IPC and temporal regions, whereas At expression peaked first in temporal regions and then in IPC and frontal regions, indicating that each program emerges at its respective pole and progresses inward along F–T trajectories (Extended Data Fig. 6). Later in fetal development, sensorimotor GM expression becomes enriched in the prospective primary sensorimotor cortices (Fig. 1b and Extended Data Figs. 1b,c,g, 2a and 3). Notably, the Af and At GMs share transcriptomic features with the HIP and AMY, suggesting the presence of related molecular and developmental processes that may partially explain the high degree of interconnectivity between association neocortex and allocortex1,5,8 (Fig. 1b and Extended Data Figs. 1b,c,g, 2a,b and 3).Building on these findings, we hypothesize that sensorimotor and association GMs represent opposing and distinct developmental programs that promote primary sensorimotor and association identities, which we term central and pericentral programs, respectively. Central refers to the central position of primary areas along the F–T axis, whereas pericentral refers to the surrounding frontal and temporal, mainly transmodal and paralimbic and limbic (paralimbic/limbic), association areas. Although the V1C is located at the posterior or occipital pole with respect to an F–T axis, it forms in a centromedial region of the developing neocortex, between the parietal and temporal association regions. The distinct spatiotemporal trajectories and gene sets related to central and pericentral programs suggest that transmodal and paralimbic/limbic cortices are shaped by mechanisms distinct from those governing primary areas, with the two programs gradually converging across prospective unimodal association cortices along a graded continuum.Late-fetal F–T-to-S–A axis molecular shiftTo investigate how sensorimotor and association GM genes distinguish different topographic and functional axes across cortical development, we performed principal component analysis (PCA) of gene expression using the shared sensorimotor and association GMs. During early fetal development (period 3), PCA revealed a polarized organization of gene expression variability that aligned with an F–T axis of cortical topography (Fig. 1d,e and Extended Data Fig. 1d,h).By the late-fetal period (period 7), overall cortical gene expression decreases27, and polarization of gene expression along the F–T axis is less apparent, instead resembling an emerging S–A axis (Fig. 1d,e and Extended Data Fig. 1d,e,h,i). From period 7 onward, gene expression becomes increasingly aligned with the S–A axis (Fig. 1d and Extended Data Fig. 1d,h), indicating that, after mid-fetal development, spatial gene expression patterns correspond more closely to the functional organization along the S–A axis (hierarchy) than areal topography (geometry). Notably, in early adulthood, we observed an inward gradient extending from prospective transmodal frontal (MFC/OFC) and temporal areas adjacent to the allocortex towards more centrally located association (IPC) and primary areas. Among primary areas, V1C exhibited the highest absolute PC2 loading score, indicating that it contributes most strongly to the S–A gradient captured by this component (Fig. 1h), which probably reflects the role of vision as the dominant sensory modality in primates.To assess the patterns of association and sensorimotor profiles, we performed separate PCAs for the shared sensorimotor and association GMs across fetal timepoints and in an adult whole-brain dataset31 and statistically compared the relationship of their first principal component (PC) scores. We found a significant negative correlation between the PC1 scores for sensorimotor GM and PC1 scores for association GM for most developing periods (period 3: r = −0.77, ρ = 0.006; period 4: r = −0.37, ρ = 0.257; period 5: r = −0.89, ρ = 0.001; period 6: r = −0.78, ρ = 0.004; period 7: r = −0.66, ρ = 0.032), and in the adult dataset31 (r = −0.88, ρ = 0.001) (Fig. 1f,g), indicating that the sensorimotor and association GMs define two dominant opposing anti-correlated transcriptomic gradients (Fig. 1f–h).Taken together, these data support the finding that gene expression gradually becomes polarized along the emerging functional S–A axis during the mid-to-late fetal transition, ultimately coming to resemble the S–A axis observed in mature brains (Fig. 1h). These findings suggest that genes in sensorimotor and association GMs are the drivers of the archetypal S–A axis development1,2,3.The multinodal induction–exclusion principleOur analytical approach identified spatiotemporally regulated transcriptomic modules emerging either from the F–T poles (A GMs) or from distinct centrally located foci (S GMs), suggesting two pericentral programs emerging from F–T nodes and four central programs emerging from central nodes (Fig. 1h). We hypothesize that, as pericentral programs advance towards the neocortical centre, transcriptional signatures of prospective primary areas emerge predominantly within prospective layer 4, the principal thalamorecipient layer, through interactions between FO thalamic axons and the nascent subplate and neocortical plate. These central programs distinguish prospective primary and adjacent unimodal sensorimotor association cortices from the surrounding higher-order association cortex by excluding pericentral programs (Fig. 1h).The opposing expression patterns of the sensorimotor and association GMs suggest antagonistic interactions between prospective primary sensorimotor and association areas. We hypothesized that these opposing spatiotemporal patterns, particularly among axon guidance and cell–cell adhesion genes, guide the formation of the modular organization of cortical networks and avoidance of primary areas by early-generated distributed transmodal and allocortical projections (Fig. 1 and Extended Data Figs. 1–3). Consistent with this, key pericentral GM axon-guidance and cell–cell adhesion genes, including Pcdh10, Pcdh17 and Plxnc1, are enriched across all layers of the neonatal mouse allocortex and transmodal association cortices, but are depleted in thalamorecipient layer 4 and restricted to layer 5 within the primary and adjacent unimodal sensorimotor cortices (Extended Data Fig. 7). Previous primate studies showed that the laminar origin of frontotemporally aligned long-range corticocortical projections to the PFC shifts from deep to superficial layers when moving from paralimbic/limbic and transmodal areas toward primary sensorimotor areas5,6,8. Accordingly, we examined corticocortical axon fibres in the early to mid-fetal human cortex using diffusion-weighted imaging (DWI) on ex vivo post-mortem human fetal brains. By post-conception week 13 (PCW13), we identified streamlines oriented along the F–T axis in prospective transmodal and paralimbic/limbic association areas alongside more localized streamlines in prospective primary unimodal areas (Extended Data Fig. 8), suggesting that the earliest transmodal streamlines are polarized along the F–T axis and avoid putative primary regions. These findings complement the spatiotemporal progression of pericentral transcriptional programs along the F–T axis.Given the spatiotemporal progression of central and pericentral programs, and the emergence of primary sensorimotor areas as densely intraconnected regions surrounded by interconnected association areas5,6,8, we propose that induction of central programs results in exclusion of pericentral programs from prospective primary sensorimotor territories. Specifically, exclusion of pericentral programs from prospective primary sensorimotor areas, induced by FO thalamic inputs and activity-dependent mechanisms, gives rise to the archetypal neocortical motif of isolated unimodal islands surrounded by an ocean of association cortex. We propose that the induction–exclusion principle represents a general mechanism underlying the assembly of distributed, predominantly frontotemporally aligned, association networks. The following sections provide experimental support for this model.SEMA7A and PLXNC1 delineate the S–A axisTo identify genes driving the principal axis of variation within the sensorimotor and association GMs, we separately analysed PCA loadings. SEMA7A showed progressively increasing PC1 loading scores relative to other sensorimotor genes with age, ultimately reaching the highest value in the adult sensorimotor GM (Extended Data Fig. 9a,b). SEMA7A encodes a membrane-bound ligand for the receptor encoded by PLXNC1, which is enriched in the Af and At GMs and similarly showed progressively increasing PC1 loading scores over time. Like PLXNC1, we observed other axon guidance genes increasing with age, as well as THRB, which encodes a thyroid hormone receptor that is known to interact with retinoid receptors32, suggesting a potential link between thyroid hormone and RA signalling in transmodal area development (Extended Data Fig. 9a–d). Functionally, SEMA7A and PLXNC1 are known to mediate axonal repulsion through bidirectional signalling and activity-dependent synaptogenesis and dendritogenesis33,34,35,36,37. These findings led us to hypothesize that SEMA7A and PLXNC1 are manifestations of the central and pericentral programs, delineating the S–A axis.We next examined the pattern of SEMA7A and PLXNC1 expression from early fetal development to adulthood (Fig. 2a–h and Extended Data Figs. 9a,c and 10a). PCA at various developmental periods based on SEMA7A and PLXNC1 expression revealed that, by period 7, PC1 corresponded to the S–A axis (Fig. 2a and Extended Data Fig. 9b,c). Quantification across areas of the S–A axis in fetal and adult human brains showed high SEMA7A and low PLXNC1 expression in primary sensorimotor areas, and low SEMA7A and high PLXNC1 expression in association areas (Fig. 2c–e and Extended Data Fig. 10a). We also identified a complementary pattern between FO sensorimotor and higher-order (HO) association thalamic nuclei, consistent with recent findings that thalamic gene expression patterns mirror cortical organization38 (Extended Data Fig. 11a–c).Fig. 2: Phylogenetic analysis of the S–A axis reveals conserved and divergent features.a, PCA using combined SEMA7A and PLXNC1 expression at period 7. b, Normalized SEMA7A and PLXNC1 expression at period 7 (Spearman’s ρ = −0.993, pshuffled < 0.001, two-tailed). c, Magnetic resonance imaging (MRI)-based cortical surface renderings of a PCW17 fetal brain showing gene expression of SEMA7A and PLXNC1 in sampled neocortical regions. d, Normalized SEMA7A and PLXNC1 expression in adult cortex (Spearman’s ρ = −0.793, pspin = 0.0001, two-tailed). Regions are coloured according to their position along the archetypal S–A axis of brain organization3. e, Cortical surface renderings showing normalized gene expression of SEMA7A and PLXNC1 in adult. f, The log2-transformed median value of the mean SEMA7A or PLXNC1 expression values across all samples from a given region and period. g, Human PCW17 and PCW22 occipital sections stained for SEMA7A, PLXNC1 and SLC17A6. The SLC17A6 channel is also shown in greyscale. MT, middle temporal area; V5, visual area 5. h, Whole-mount in situ hybridization for Sema7a, Plxnc1 and Cyp26b1 in mouse brains at PCD13.5 and PCD16.5, and P3 and P7. Lateral and dorsal views are shown for P3 and P7 brains. i, Cortical area maps in mouse and short-tailed opossum. j, RNA-scope analysis of Sema7a and Plxnc1 in mouse and opossum at P0 and P22, respectively (opossum P22 is approximately equivalent to mouse P0). MOs, secondary motor cortex. k, Diagram of brain areas and labels in a coronal chicken brain slice inspired by a previous study44 alongside an adult chicken brain section analysed using RNA-scope for Sema7a and Plxnc1. HA, hyperpallium apicale; IHA, interstitial nucleus of the hyperpallium apicale; Md, dorsal mesopallium; Mv, ventral mesopallium; N, nidopallium; E, enteropallium; VT, ventral telencephalon. l, Opossum brain 2 weeks after injection of AAVrg-TdT and AAVrg-GFP. The dotted lines indicate the approximate anterior–posterior levels corresponding to the coronal sections shown. The boxed regions in the low-magnification images indicate the areas shown at higher magnification. Scale bars, 4 mm (l (column 1)), 2 mm (g and k), 1 mm (l (columns 3, 5 and 6)), 500 μm (j) and 100 μm (l (columns 4, 7 and 9)).We next examined the spatiotemporal expression patterns of SEMA7A and PLXNC1 (Fig. 2f). As expected, SEMA7A and PLXNC1 were significantly negatively correlated in the adult dataset31 (r = −0.79, ρ = 0.001, Fig. 2d) and across most developmental periods (period 3: r = −0.63, ρ = 0.073; period 4: r = −0.80, ρ = 0.011; period 5: r = −0.90, ρ = 0.001; period 6: r = −0.93, ρ < 0.001; period 7: r = −0.93, ρ < 0.001) (Fig. 2b). Notably, SEMA7A expression becomes refined and enriched in V1C between the early mid-fetal and late mid-fetal periods (period 5 and 6) (Fig. 2f), which we confirmed with staining for SEMA7A, PLXNC1 and the TCA-enriched SLC17A6 in human occipital cortex (Fig. 2g) and in situ hybridization of SEMA7A and PLXNC1 in the macaque cortex (Extended Data Fig. 10b).High SEMA7A expression was also observed in the lateral occipital cortex in human and macaque (Fig. 2g and Extended Data Fig. 10b), anatomically aligning with the primate-specific middle temporal area (also known as visual area 5), an associative visual area that uniquely receives direct input from the lateral geniculate nucleus (an FO nucleus)39.We further characterized the developmental progression of central and pericentral programs in mice using Sema7a and Plxnc1 expression. We also analysed Cyp26b1, which is enriched in the anterolateral motor cortex and exhibits a ring-like expression pattern in surrounding allocortical and periallocortical structures, as well as in the hippocampus and amygdala25,26,40,41,42,43. CYP26B1 restricts RA signalling to the fetal PFC, suggesting a potential link between RA signalling and pericentral programs41. From post-conception day 13.5 (PCD13.5) to postnatal day 7 (P7), Plxnc1 expression expands from the F–T poles into the mPFC, insula, temporal association area and regions surrounding the emerging primary areas (Fig. 2h, Extended Data Fig. 11d and Supplementary Videos 1–8). By contrast, Sema7a expression is initially low but broadly distributed across the neocortex by PCD16.5, before becoming progressively restricted and upregulated in the primary sensorimotor cortex, which represents the dominant sensory modality in rodents, and, to a lesser extent, in the primary auditory and visual areas (Fig. 2h and Extended Data Fig. 11d). These findings illustrate the progressive refinement of central programs along with the inward spread of pericentral programs from the F–T poles and their exclusion from the central regions.Evolutionary conservation of the S–A axisTo examine whether the organizational principles of the S–A axis are conserved across species, we used SEMA7A and PLXNC1 as representative markers of primary sensorimotor and association areas in placental mammals (human, monkey and mouse), marsupial (short-tailed opossum) and avian (chicken) brains (Fig. 2i–k and Extended Data Fig. 10c–e). Across species, we observed a consistent modular pattern of Sema7a expression nested within broadly distributed Plxnc1 expression (Fig. 2i–k and Extended Data Fig. 10c–e). Although the avian dorsal pallium lacks the archetypal six-layered neocortex, it contains neuronal populations homologous to mammalian intratelencephalic ExNs44,45. We observed Sema7a expression in primary sensory input regions, including the interstitial apical hyperpallium, the main sensory input region of the hyperpallium44, which contains neuronal types that are transcriptomically homologous to mammalian neocortical thalamo-recipient layer 4 and 5 ExNs46 surrounded by Plxnc1-expressing association and output regions (Fig. 2k and Extended Data Fig. 10e). These findings suggest that the core architectural motifs of the S–A axis are evolutionarily ancient and conserved.Opossums lack a true M1C rostral to the S1C. Instead, the motor and somatosensory regions form an overlapping amalgam within the parietal cortex12,47,48 (Fig. 2i). Without the induction of the motor cortex in the rostral adjacent region to the somatosensory cortex, we predicted that this region would exhibit association-like characteristics. RNA-scope analysis of Plxnc1 and Sema7a showed that this region expresses Plxnc1, whereas the topographically equivalent region in mouse expresses Sema7a (Fig. 2j and Extended Data Fig. 10d). We performed retrograde tracing with tdTomato (TdT)-expressing AAV (AAVrg-TdT) and observed TdT+ cells located across distant cortical areas, whereas, when we injected AAVrg-GFP into the somatosensory cortex, identified by BHLHE22 expression, we observed GFP+ neurons localized to the somatosensory cortex (Fig. 2l). Thus, the adjacent rostral region to the somatosensory cortex in opossums exhibits association-like characteristics.The nested expression of primary sensorimotor-enriched SEMA7A within a complementary PLXNC1 association domain was consistent across the species that we analysed, suggesting that archetypal S–A motifs are evolutionarily conserved from birds to primates.Evolutionary divergence of thalamic neurogenesisAlthough the anticorrelated expression of central and pericentral programs appears conserved across mammals, and possibly birds, there is considerable diversity between species in the relative size of primary sensorimotor and association cortices12. We therefore sought to identify potential mechanisms that regulate the balance between primary sensorimotor and association areas (that is, S–A equilibrium) across mammals to identify how certain species, such as primates, have neocortices dominated by association areas.FO TCAs exert instructive, activity-dependent influences that drive primary area formation14,15,18,19,22. Another potential driver of S–A axis development is spatiotemporal gradients of neurogenesis. For example, large-brained mammals exhibit exaggerated temporal patterns of neurogenesis compared to rodents49. We therefore examined spatiotemporal trends of neurogenesis in the cortex and thalamus in mice (neocortex dominated by primary sensorimotor areas) and in macaques (neocortex dominated by association areas).We analysed the neurogenic trends of several FO and HO thalamic nuclei and primary sensorimotor and association cortical areas. For mice, we used the Neurobirth resource50. For macaques, we compiled results from previously published tritiated-thymidine birth-dating studies and imaged and quantified tritiated-thymidine-positive brain sections using archival tissue sections obtained from the MacBrain Resource Center13,51 (Methods, Extended Data Fig. 12 and Supplementary Table 15).Our analysis revealed that the relative birth order of thalamic nuclei is not well conserved. In mice, FO nuclei were generally born before HO nuclei, whereas the opposite pattern occurs in macaques (Extended Data Fig. 12). Thus, in addition to prolonged neurogenesis in the thalamus and cortex, FO nuclei emerge relatively later in development in macaques than in mice. This naturalistic observation led us to hypothesize that the delayed generation of FO nuclei in macaques delays induction of central programs, shifting the S–A equilibrium toward association areas. Future studies are needed to determine how species-specific neurogenic patterns in the thalamus regulate S–A axis development more broadly.RA signalling regulates PLXNC1 expressionRA is enriched in the mid-fetal human frontal and temporal association cortices and regulates PFC development40,41,42,43. Moreover, certain genes within the shared pericentral GMs, including CBLN2 and MEIS2, are enriched in the fetal PFC and regulated by RA25,26,41,42, and RA-related Gene Ontology (GO) terms are enriched in the Af GM in ref. 28 (Supplementary Table 8). We observed PLXNC1 and the RA-synthesizing enzyme ALDH1A3 in the lateral ganglionic eminence (LGE) and septum, adjacent to the ventrally located allocortical plate, where PLXNC1 expression first emerges in the dorsal pallial cortical plate (Fig. 3a). Using RARE-lacZ mice, which express lacZ under an RA response element40,41, we observed lacZ activity in gradients from high in the inferomedial frontal cortex and posterolateral temporal amygdalohippocampal region to low in the central neocortical territories (Fig. 3b), aligning with the emergence of pericentral programs. However, the overlap between PLXNC1 and the RA signalling markers ALDH1A3 and RARE-lacZ signal was incomplete (Fig. 3a,b), strongly suggesting that other factors, including WNT signalling (Fig. 1c), contribute to pericentral program induction. Together, these findings led us to hypothesize that ventral pallial structures provide diffusible RA that promotes PLXNC1 expression and the broader induction of pericentral programs.Fig. 3: RA signalling regulates PLXNC1 expression.a, PCD13.5 brain sections stained for PLXNC1 and ALDH1A3 revealed co-expression in the rostral ventral pallium, adjacent to the ventrally located allocortical plate, lateral regions of the dorsal pallium and the septum (Spt). High expression of ALDH1A3 was also observed in the internal capsule (IC). Cortical PLXNC1 expression first emerged in the lateral cortical plate of the dorsal pallium. CP, cortical plate; Pir, piriform cortex (allocortex); LOT, lateral olfactory tract; AMY, amygdala (allocortex). b, The RARE-lacZ reporter signal in whole-mount PCD13.5 and PCD16.5 brains revealed gradients from high inferomedial frontal (F) and posterolateral temporal amygdalohippocampal (T) regions to low levels in the central neocortical regions, aligning with the emergence of pericentral programs. c, RNA-seq analysis of Rarb/Rxrg-dKO and WT mouse mPFC, OFC and MOs regions at P0 (ref. 41). n = 3 control (ctrl) and Rarb/Rxrg-dKO mice. One-sided hypergeometric tests with Benjamini–Hochberg FDR correction were used to assess GM enrichment in upregulated or downregulated DEGs. Af genes were enriched among downregulated DEGs in the mPFC. Statistical details are provided in Supplementary Table 14. d, In situ hybridization for Plxnc1 in P0 mouse brain sections. ACA, anterior cingulate area. e, Immunostaining for SEMA7A, PLXNC1 and MEIS2 in human telencephalic organoids cultured for 150 days and treated for 48 h with either RA or a pan-RA receptor inhibitor (RARi). The percentage of MEIS2high cells and the total volume of PLXNC1- and SEMA7A-positive regions were quantified across six organoids per condition. Statistical significance was assessed using ordinary one-way analysis of variance followed by Tukey’s multiple comparisons test. MEIS2: ctrl versus RA, P = 0.0161; RA versus RARi, P = 0.0010. PLXNC1: ctrl versus RA, P = 0.0009; RA versus RARi, P < 0.0001. Data are mean ± s.e.m. NS, not significant; *P < 0.05, ***P ≤ 0.001. Scale bars, 500 μm (a (column 6) and d (left and right)), 250 μm (a (columns 1 and 4)), 200 μm (d (middle)) and 50 μm (a (columns 3, 5 and 7) and e).Source dataRarb/Rxrg-double-knockout (Rarb/Rxrg-dKO) mice display reduced RA signalling in the mPFC and anterior cingulate cortex41. Using our previously published RNA-seq dataset41, we identified differentially expressed genes (DEGs) between Rarb/Rxrg-dKO and wild-type (WT) mice in frontal areas at P0 (Fig. 3c). The set of downregulated genes in the mPFC from Rarb/Rxrg-dKO mice was enriched for shared Af genes, including Plxnc1 and Thrb (Fig. 3c and Supplementary Table 14). In situ hybridization confirmed that Plxnc1 expression was reduced in Rarb/Rxrg-dKO mPFC and anterior cingulate cortex (Fig. 3d).To test whether RA induces PLXNC1 expression in human cortical neurons, we used induced-pluripotent-stem-cell-derived cerebral organoids that model early cortical development52. We first assessed the expression of PLXNC1, SEMA7A and both sensorimotor and association GM genes in a publicly available scRNA-seq dataset from human organoids53 to determine their cortical identity. SEMA7A and select shared sensorimotor GM genes were expressed by immature ExNs at 6 months in vitro, whereas PLXNC1 and a subset of shared Af and At GM genes were mainly expressed by cortical progenitors, but not ExNs. These findings mirror our observations of the undifferentiated, or naive, neocortex, suggesting that ExNs in organoids retain a naive cortical identity (Extended Data Fig. 13). We hypothesized that this reflects the absence of relevant neural systems, including RA sources and thalamocortical input. Organoids therefore provide an effective system to test regulators of central and pericentral gene expression. We exposed 5-month-old in vitro (correlated with mid-fetal stages)54 organoids to either RA or a pan-RA receptor inhibitor (RARi) for 48 h. RA treatment increased MEIS2 (an RA-responsive marker)41 and PLXNC1 expression, while exposure to RARi reduced their expression (Fig. 3e). These findings indicate that RA regulates PLXNC1 and select Af GM genes.Primary contraction leads to association expansionTo test the induction–exclusion principle, we searched for mouse models with altered primary sensorimotor topography. We systematically knocked out Fezf2, Satb2 and Zbtb18, genes that regulate cortical ExN development55,56,57,58,59,60,61, and used SEMA7A and PLXNC1 as markers of primary sensorimotor and association cortices, respectively (Fig. 4a,b and Extended Data Fig. 14a,b). In Fezf2flox/floxNeurod6-cre (Fezf2-cKO) mice, S–A topography appeared largely intact, whereas Satb2flox/floxEmx1-cre (Satb2-cKO) and Zbtb18flox/floxNeurod6-cre (Zbtb18-cKO) cortices showed a marked loss of SEMA7A and expansion of PLXNC1 (Fig. 4a,b and Extended Data Fig. 14a,b). To determine whether allocortex expanded in these mutants, we performed RNAscope analysis of Tfap2d (paleocortex)25,62 and Zbtb20 (archicortex)25,63, and did not observe increased signal by RNA-scope or neocortical RNA-seq at P0 (refs. 64,65,66), indicating that neocortical identity was maintained (Fig. 4c, Extended Data Fig. 14c and Supplementary Table 17).Fig. 4: Primary sensorimotor cortex contraction leads to expansion of the transmodal association cortex.a, P7 control (Satb2flox/flox), Fezf2-cKO, Satb2-cKO and Zbtb18-cKO brains were stained for SEMA7A and PLXNC1. b, Schematic of the quantified regions (top). The relative fluorescence intensity was normalized to the mean intensity in the controls. Quantified regions were divided into ten bins, and each bin was analysed independently (bottom). c, RNA-scope analysis of Zbtb20 and Tfap2d in the indicated genotypes (control genotype, Satb2flox/+) at P7. d, The GFP signal in sections from P37 control, Fezf2-cKO, Satb2-cKO and Zbtb18-cKO mice injected with AAVrg-GFP into the mPFC at P30. e, Average GFP+ cells per section and the percentage distribution across 15 equal-sized lateral-to-medial bins. f, The overlapping and unique DEGs from published P0 Fezf2-, Satb2- and Zbtb18-cKO neocortical bulk RNA-seq experiments64,65,66. The bar plots show shared DEGs between Satb2- and Zbtb18-cKO cortices. Axon guidance, signalling pathway, area-enriched and other selected cortical development genes are labelled. A list of all DEGs is provided in Supplementary Table 17. g, P7 control (Gbx2flox/flox) and Gbx2-cKO (Gbx2flox/floxOlig3-cre) sections were stained for SEMA7A and PLXNC1. The left-column sections are tangential sections from flattened cortices. h, P7 control and Gbx2-cKO brains were stained for 5-HT and NTNG1. The relative signal intensity was quantified as in b, and the normalized intensity for each sample was determined by dividing the intensity values by the mean intensity within that sample. i, The GFP signal in sections from P37 Gbx2 control and Gbx2-cKO brains injected with AAVrg-GFP into the mPFC at P30. Quantification of average GFP+ cells per section and the percentage distribution is shown. For all quantifications, data are mean ± s.e.m. Two-sided unpaired Welch’s t-tests were performed for each bin or cell number comparison; *P < 0.05, **P < 0.01, ***P < 0.001. Detailed statistical information including exact P values and biological replicates (animals, n) is provided in Supplementary Table 18. Scale bars, 1 mm (a, c, d, g, h (left), i (left)), 500 μm (h (middle)), 250 μm (i (right)) and 100 μm (h (right)).Source dataIn addition to SEMA7A staining, sensorimotor areas appeared intact in Fezf2-cKO mice on the basis of the presence of SLC17A6-expressing (also known as VGLUT2) cortical barrels, a distinct granular layer 4 and no obvious expansion of the pericentral genes Lmo4, Pcdh10, Pcdh17 and Rorb into the somatosensory barrel field (Extended Data Fig. 15a–c). By contrast, Satb2- and Zbtb18-cKO mice showed loss of distinctive whisker barrels, absence of thalamocortical projections and altered Cyp26b1 expression (Extended Data Fig. 15d–f). Satb2-cKO mice retained corticothalamic neurons, consistent with a previous report64 (Extended Data Fig. 15g,h). Satb2 and Zbtb18 mutants also exhibited loss of 5-HT and cytochrome oxidase activity in sensorimotor areas (Extended Data Fig. 15i). We also examined Plxnd1 and Sema3e, axon guidance genes that are required for proper TCA innervation67, and observed altered laminar patterns without major changes in overall expression, except for Sema3e in Zbtb18-cKO mice (Extended Data Fig. 15j). Together, these findings indicate a substantial reduction in or complete loss of primary sensorimotor areas in Satb2- and Zbtb18-mutant cortices.The preservation of sensorimotor-like features in Fezf2-cKO mice and their loss in Satb2- and Zbtb18-cKO cortices led us to hypothesize that transmodal connectivity patterns would remain largely intact in Fezf2-cKO mice, but expand in Satb2- and Zbtb18-cKO cortices owing to a lack of exclusion normally imposed by the primary sensorimotor areas. We tested this through retrograde viral tracing from the mPFC (rgAAV-GFP) (Fig. 4d,e and Extended Data Fig. 14d,e). In Fezf2-cKO cortices, we observed subtle shifts in the distribution of GFP+ cells, with no overall change in GFP+ cell number despite previously described net increases in corticocortical projection neurons58 (Fig. 4d,e and Extended Data Fig. 14d,e). By contrast, Satb2- and Zbtb18-cKO mice showed increased numbers of GFP+ cells across multiple anterior–posterior positions and increased numbers of GFP+ cells medially in the (central) regions typically occupied by primary sensorimotor areas (Fig. 4d,e and Extended Data Fig. 14d,e). These findings suggest that the loss of primary sensorimotor areas leads to expansion of association connectivity patterns.To further characterize the molecular mechanisms underlying S–A axis patterning, we analysed DEGs in Fezf2-cKO (ref. 65), Satb2-cKO (ref. 64) and Zbtb18-cKO (ref. 66) cortices at P0 (Fig. 4f and Supplementary Table 17). We identified several shared DEGs between Satb2- and Zbtb18-cKO cortices associated with axon guidance and cell adhesion, including Cadm2, Cdh4, Cdh7, Cdh12, Dscam, Epha3, Fat3, Pcdh20, Plxnc1, Robo2, Sema5b and Sema7a, some of which were validated by immunostaining or in situ hybridization (Fig. 4f and Extended Data Fig. 16a).To further characterize areal changes, we stained for BCL11A, a marker that is typically enriched in primary areas, and MEIS2, an RA-regulated protein that is normally enriched in association areas. In Satb2- and Zbtb18-cKO neocortices, these proteins lack distinct regional patterns (Extended Data Fig. 16b). We also examined NRP2, a protein enriched in the ref. 26 Af and At modules that mediates semaphorin–plexin interactions, and found that NRP2 expanded medially into the neocortex (marked by TLE4 expression) (Extended Data Fig. 16c). Moreover, we found that Satb2 and Zbtb18 were mutually downregulated, suggesting reciprocal regulatory interactions and coordinated control of molecular programs underlying TCA ingrowth and, directly and indirectly, S–A axis patterning.To further test the principles of induction and exclusion, we used Pax6flox/floxEmx1-cre (Pax6-cKO) mice in which Pax6 is deleted from the radial glial cell stage, resulting in moderately smaller primary sensorimotor areas68. SEMA7A was reduced in the barrel field, but no change was observed in GFP+ cells (Extended Data Fig. 14f). The lack of upper-layer neurons in Pax6-cKO mice complicates the interpretation of this result, and additional studies aimed at manipulating arealization at the progenitor level will be useful to further test these principles.We next examined the induction of primary areas by FO TCAs12,13,14,15,16,17,18,19,20,21,22,68,69,70 using two previously reported models with TCA defects. In Celsr3flox/floxDlx5/6-cre (Celsr3-cKO) mice71, the atypical protocadherin CELSR3 is absent in the ventral forebrain, resulting in a portion of TCAs failing to cross the pallial–subpallial boundary. In our analysis, at P7, we observed NTNG1-expressing axons projecting through the internal capsule, and SEMA7A expression without distinct barrel organization. This was accompanied by reduced Rorb and a lack of obvious somatosensory barrels marked by Bhlhe22 and Bcl11a (Extended Data Fig. 17a–d). The lateral-to-medial distribution of SEMA7A and PLXNC1 immunostaining was unchanged, but Sema7a transcripts were reduced in the L4 primary somatosensory barrel field (Extended Data Fig. 17b,c). Tracing from the mPFC revealed no major changes, and the robust signal in the thalamus further indicated the maintenance of TCAs in this experimental model (Extended Data Fig. 17e).Gbx2flox/floxOlig3-cre (Gbx2-cKO)72 mice have reduced TCA innervation of the cortex (Fig. 4g) accompanied by reduced SEMA7A and modestly increased PLXNC1 expression relative to controls (Fig. 4g). Staining for SEMA7A and PLXNC1 in flattened cortices as well as quantification of the medial-to-lateral distribution of SEMA7A and PLXNC1 indicated that there was a contraction of the SEMA7A-expressing domain and a subtle expansion in the PLXNC1-expressing domain towards the neocortical centre (Fig. 4g). Although NTNG1 and 5-HT signals were reduced, NTNG1+ axons in the internal capsule and NTNG1 and 5-HT signal within presumptive cortical layer 4 indicated reduced, rather than absent, TCAs (Fig. 4h). We performed retrograde tracing and found an increase in the number of retrogradely labelled GFP+ cells and a medial expansion of GFP+ cells in Gbx2-cKO mice (Fig. 4i). We consistently observed GFP+ signal in the thalamus in our tracing experiments (Fig. 4i). These findings suggest that reduced TCA innervation in Gbx2-cKO cortices results in reduced sensorimotor area size and expansion of association connectivity. Although neither the Celsr3- nor Gbx2-cKO strategies completely eliminated TCAs, the Gbx2-cKO exhibited a consistent reduction in TCAs and was accompanied by a contraction of the central SEMA7A-expressing domain.Multiple genetic manipulations targeting the cortex and thalamus resulting in absent or altered primary sensorimotor areas led to the expansion of association features into territories typically occupied by primary areas, supporting the principle of induction and exclusion.SEMA7A and PLXNC1 repulsion facilitates S–A network patterningThe shared genes underlying the pericentral and central programs include axon guidance and cell adhesion genes such as CADM2, PCDH7, SEMA7A and UNC5C in sensorimotor GMs and PCDH8, PCDH10, PCDH17, PLXNA1, PLXNC1 and ROBO1 in association GMs (Supplementary Table 5). In mice, SEMA7A and PLXNC1 exhibit complementary gradients and laminar-specific expression patterns, extending from primary sensorimotor cortex to association and paralimbic/limbic cortex and allocortical structures such as the basolateral amygdala (Fig. 5a). Their roles in axonal repulsion suggest that they regulate connectivity along the S–A axis. We used a Sema7a-null (Sema7a−) allele and engineered a Plxnc1 conditional allele (Plxnc1flox) (Methods and Supplementary Fig. 1) to generate Sema7a−/−Plxnc1flox/floxNeurod6-cre (Sema7a/Plxnc1-dKO) mice. These mice were injected with retrograde AAV expressing TdT (AAVrg-TdT) into the primary somatosensory cortex (SSp, S1C) and AAVrg-GFP into the mPFC (Extended Data Fig. 18a,b). We also engineered a conditional Sema7a allele (Methods) and generated Sema7aflox/floxPlxnc1flox/floxNeurod6-cre (Sema7a/Plxnc1-dcKO) mice and performed the same experiment (Extended Data Fig. 18c,d). In both KO strategies, we observed altered connectivity along the S–A axis. As SEMA7A is regionally enriched in FO thalamic nuclei (Extended Data Fig. 11a,b), differences in the Sema7a whole-body KO compared with cKO may relate to organizing principles acting at the level of the thalamus. These results support the idea that SEMA7A and PLXNC1 regulate macroscale network connectivity along the S–A axis.Fig. 5: Mutual axon repulsion between primary and association cortices is mediated partly by SEMA7A and PLXNC1.a, P7 brain sections were analysed using RNA-scope for Sema7a and Plxnc1 (left) or stained for SEMA7A and PLXNC1 protein (right). b, Images of P2 sections from brains electroporated with pCAG-GFP plasmids at E14.5 (left) and WT P2 brain sections stained for SEMA7A and PLXNC1 (right). The white outlines indicate dissected regions for co-culture experiments. c, Day in vitro 0 (DIV0) co-culture preparation showing an electroporated mPFC section aligned with an mPFC section from a non-electroporated brain. d, Left, GFP-stained co-cultures generated from P2 dissected regions cultured until DIV2. Right, quantification of the GFP+ signal in the innervated region normalized to the GFP+ signal in the electroporated region at DIV2. e, Co-cultures generated as described in d, but with either Sema7a-KO SSp or Plxnc1-cKO mPFC regions in the indicated combinations. Staining was performed for SEMA7A. We were unable to obtain successful PLXNC1 staining in our culturing experiments. For all plots, data are mean ± s.e.m. Statistical analysis was performed using two-sided unpaired Welch’s t-tests. *P < 0.05, **P < 0.01. Detailed statistical information including exact P values and biological replicates (animals, n) is provided in Supplementary Table 19. Scale bars, 1 mm (a (lower magnification) and b), 500 μm (c), 200 μm (d–f) and 100 μm (a (higher magnification)).Source dataWe hypothesize that effectors of the central and pericentral programs function in part through mutual repulsion between primary and association areas. To directly test this, we designed and used an ex vivo culturing strategy in which we challenged the ability of neurons in primary sensorimotor or association areas to innervate different cortical areas (Fig. 5b–e). We labelled either mPFC or SSp ExNs through in utero electroporation at PCD14.5 with pCAG-GFP plasmids, and co-cultured GFP+ explants at P2 using combinations of association (that is, mPFC or agranular insula (AI)) and primary areas (that is, primary motor cortex (MOp) or SSp). When GFP+ mPFC explants were cultured with mPFC or AI explants, GFP+ axons were readily able to innervate the unlabelled explant, but when mPFC electroporated explants were cultured with MOp or SSp explants, there was a reduction in the GFP+ signal in the unlabelled cortical explants (Fig. 5d). Conversely, when electroporated SSp explants were cultured with mPFC or AI, there was a reduction in the GFP+ signal compared with when GFP+ SSp was cultured with SSp or MOp explants (Fig. 5d). These findings suggest that MOp and SSp express molecular signals that repel axons from the mPFC, and that the mPFC and AI express molecules that repel axons from the SSp. When GFP+ mPFC regions were cultured with Sema7a-KO SSp explants, we observed an increased GFP+ signal in Sema7a-KO SSp compared with the control (Fig. 5e). When GFP+ Plxnc1flox/floxNeurod6-cre (Plxnc1-cKO) mPFC explants were cultured with WT SSp explants, we observed an increased GFP+ signal in WT SSp explants compared with those co-cultured with GFP+ Plxnc1flox/flox (Plxnc1 control) mPFC (Fig. 5e). These findings suggest that primary and association areas express molecules that mutually repel axons from one another and that SEMA7A and PLXNC1, in part, mediate this repulsion.DiscussionWe present experimental findings that integrate with existing knowledge into the unifying MIND model of S–A development. This model posits that transmodal and paralimbic/limbic association cortices possess molecular and connectional features driven by mechanisms different from those of primary sensorimotor areas. Rather than a sharp anatomical divide, these two developmental programs interact progressively across future unimodal association cortices, establishing a graded transition along the cortical hierarchy. We term these pericentral identity programs, as they emerge at the neocortical periphery around the septal (frontal) and amygdalar (temporal) poles and propagate inwards. As these programs expand towards the centre of the naive neocortex, they interact with focally emerging sensorimotor identity programs. This competitive interaction defines distinct territories and a graded continuum through dual processes of induction and exclusion, driving early F–T polarization and the spatial compartmentalization of genes that are critical to neural development, circuit assembly and autism. We demonstrate that the complementary expression of PLXNC1 and SEMA7A—a mutually repulsive axon-guidance pair that was previously implicated in neural circuit and synapse development—across the S–A axis contributes to the antagonistic shaping of corticocortical connectivity. The induction–exclusion principle is consistent with certain previous findings25,26,27,73,74,75,76,77,78,79, including postnatal organization of the S–A axis38.As previously shown, developing primary sensorimotor areas exert activity-dependent influences, anchored in their primary sensoritopic and topological protoarchitecture7,14,15,23,24, on the surrounding prospective unimodal association cortices, before those regions are further shaped by incoming pericentral programs. This dynamic interplay of antagonistic mechanisms gives rise to a cortical topography in which primary sensorimotor areas emerge as focal ‘islands’ within a broader ‘ocean’ of interconnected association cortex, patterned hierarchically from nearby unimodal to more distant transmodal distributed association networks. This model accounts for the development of transmodal and other higher-order association features regardless of the spatial layout, or even presence, of primary areas. We hypothesize that these developmental processes contribute to specific adult features of areal and laminar connectivity, F–T-polarized transmodal connectivity, molecular gradients and gyrification, as well as specific evolutionary specializations. Together, our results and model provide a unifying framework for understanding experimental, evolutionary and clinical phenomena, revealing induction and exclusion as fundamental competitive principles that shape the S–A axis and cortical processing hierarchies. The limitations and implications of our findings are discussed in the Supplementary Discussion.MethodsAssociation and sensorimotor gene module curationIndependently generated spatiotemporal human brain exon microarray data and RNA-seq datasets were obtained from ref. 26 (accessed through https://hbatlas.org/) and ref. 28 (accessed through http://development.psychencode.org/#) and the developing macaque brain RNA-seq data across brain regions were obtained from ref. 29 (accessed through http://www.evolution.psychencode.org/#). The estimated correspondence between macaque developmental timepoints and equivalent human developmental periods has been reported previously29. We split association areas representative of pericentral programs into two groups: Af, which included the OFC, MFC, DFC/dlPFC and VFC; and At, which included the posterior STC and ITC. Sensorimotor groups representative of central programs contained M1C, S1C, A1C and V1C. Areas dissected during fetal development are depicted in Fig. 1a. When defining our GMs, we used human samples from period 3 to period 7 and macaque samples from predicted period 5 to predicted period 7 with at least two biological replicates for each predicted period (the earliest macaque sample corresponded to approximately human period 4 and there were no biological replicates). For each of the three sequencing datasets (human microarray26, human RNA-seq 28 and macaque RNA-seq 29), we conducted differential expression analysis using all samples across ten regions for each period. For RNA-seq differential expression analysis, we retained genes with sufficiently large counts using the filterByExpr function from the edgeR80 package and conducted trimmed mean of M values normalization using the normalizeCounts function from the tweeDEseq81 package. We then applied RNentropy82 to identify genes differentially expressed among the above ten neocortical regions in each developmental period. The resulting DEGs from RNentropy were further selected using criteria adapted from a previous study41 in each period. In brief, a gene to be considered as an upregulated DEG in a certain A/S subgroup, (1) there is at least one region in that subgroup where the gene is significantly upregulated; (2) the gene is not upregulated in any region of the opposing (S/A) groups; (3) the gene is underexpressed in at least 30% of the areas in the opposing (S/A) group; and (4) the gene is not in a module gene list of any of the opposing (S/A) subgroups. For exon microarray data in each period, to conduct an equivalent analysis to the RNA-seq data, we used limma83 to compare each cortical region within a subgroup independently as treatment to all other cortical regions of the opposing group as replicates of control for each period. DEGs were selected with FDR < 0.05 and absolute foldchange (FC) > 1 (the same FC threshold used in RNentropy)84. We then defined the overexpressed DEGs in a certain S/A subgroup in a certain period following the same criteria as we described for the RNA-seq data. Lastly, we merged the genes across all prenatal periods of each gene module within each dataset independently as the final module gene list respectively. To identify shared genes, we found the overlap of each concatenated module gene lists among three datasets.To show the module gene expression in heat maps, we averaged the gene expression across genes in each module for each sample and took the median of the averaged expression values among samples from a given region and period. To generate continuous expression trajectories for each cortical region across developmental periods (log2[time (days)]), we applied locally weighted scatterplot smoothing (LOESS). For each region, the median of the sample-level mean log2-transformed expression values were modelled as a function of developmental period using the loess() function in R (stats package). The fitted LOESS models were then used to predict smoothed expression values at 1,000 equally spaced points spanning the observed developmental time range for each region.
Competing programs shape cortical sensorimotor–association axis development - Nature
Multispecies evidence supports the multinodal induction–exclusion in network development model, in which sensorimotor-to-association patterning is governed by competing processes of induction and exclusion driven by two opposing transcriptomically defined programs.
26,159 words~119 min read