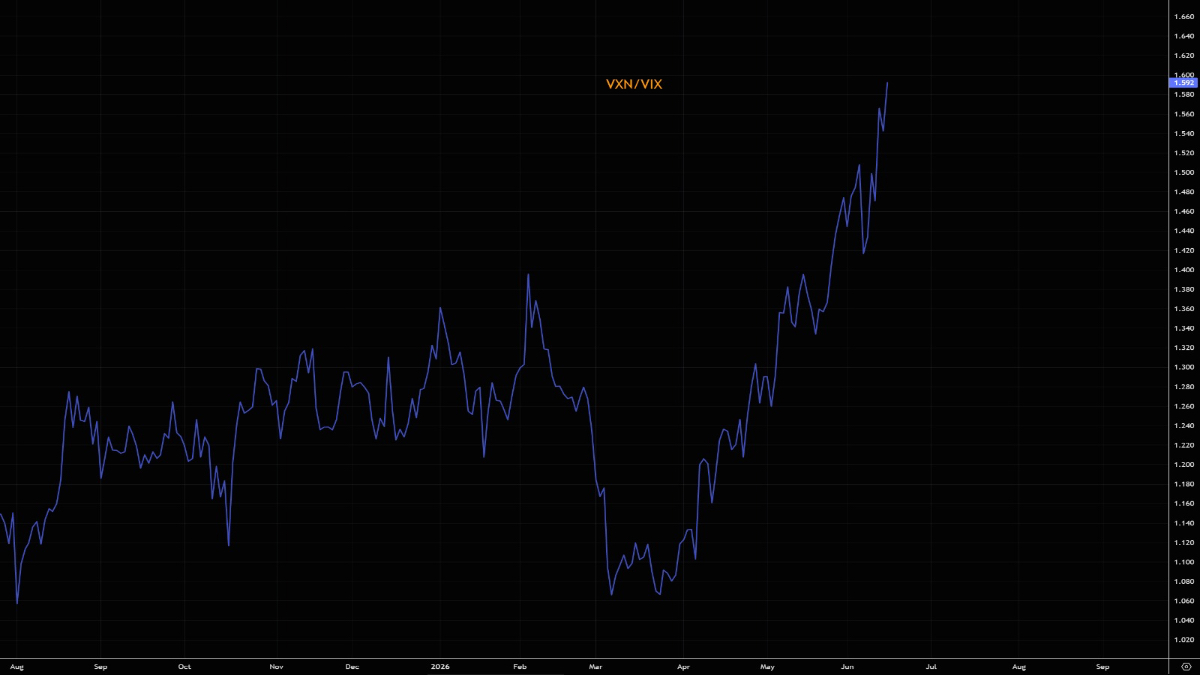
The Cboe NASDAQ-100 Volatility Index, known as VXN, climbed to a ratio of 1.64 against the VIX on June 16, 2026. That’s the widest spread between tech-specific and broad-market implied volatility since July 3, 2017, and it approaches territory last meaningfully explored during the mid-2000s.
What the numbers actually say
As of late June 2026, VXN closed near 30.91, while the VIX hovered around 18.41. In English: options traders are pricing in roughly 68% more expected turbulence in Nasdaq-100 stocks than in the S&P 500 over the next 30 days.
Both indices measure 30-day implied volatility derived from options pricing, just on different underlying indices. VXN tracks the Nasdaq-100, which is dominated by the largest technology and growth companies. The VIX does the same for the S&P 500, a broader basket that includes financials, healthcare, energy, and other sectors that tend to be less volatile.
A ratio above 1.0 means the market expects more volatility in tech than in equities overall. But a ratio of 1.64 is not normal. For context, the last time this ratio got truly extreme was during the dot-com implosion. Between 2000 and 2001, the VXN/VIX ratio exceeded 3.0, meaning tech volatility expectations were triple those of the broader market. Current levels are well below that historic extreme.