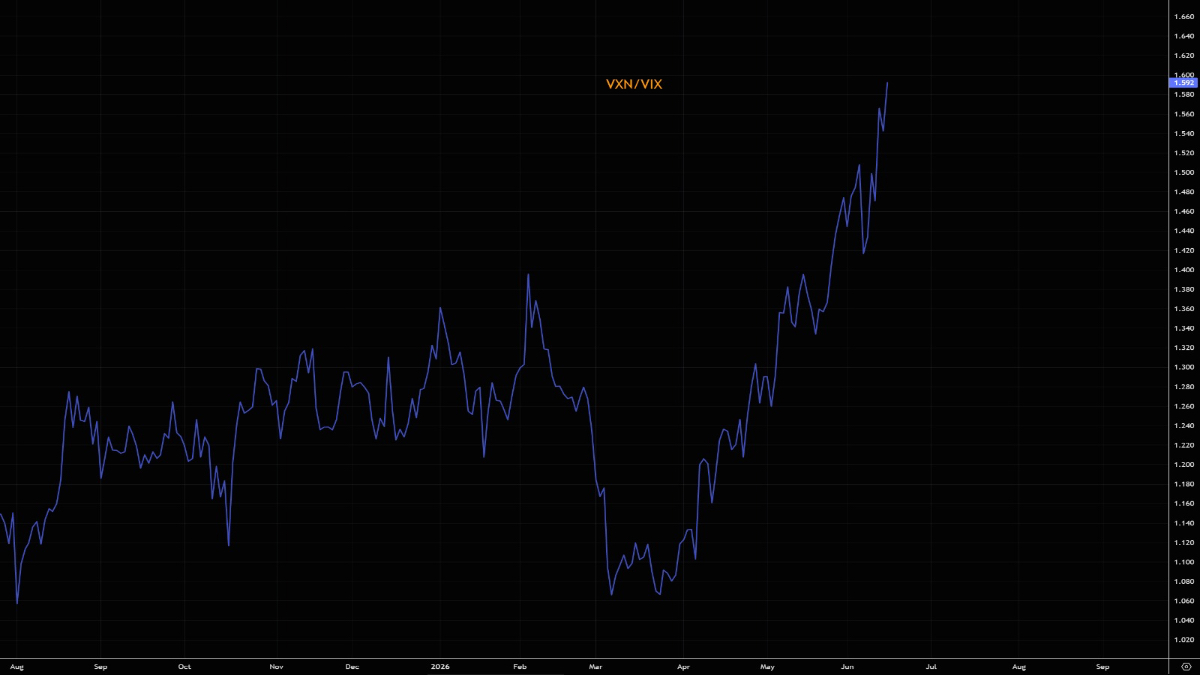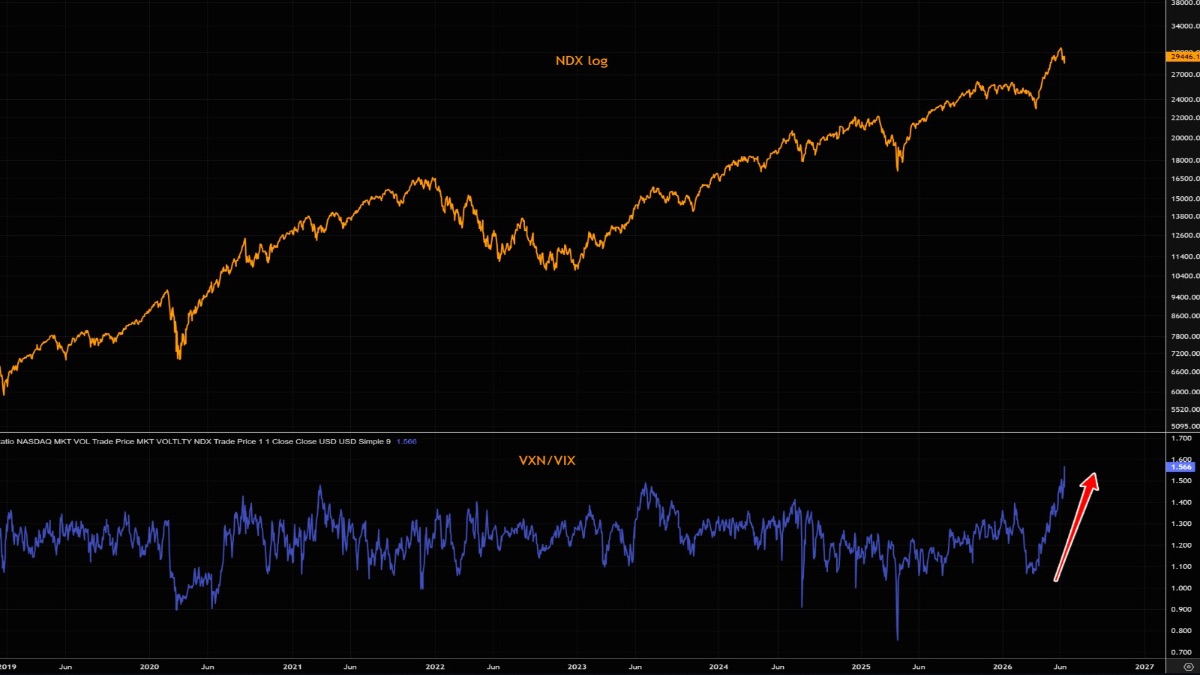
The Nasdaq 100 just strung together its longest streak of daily 1%+ moves since August 2024, and the market’s favorite tech fear gauge is flashing red. The Cboe NASDAQ-100 Volatility Index, better known as the VXN, surged 49% and touched an intraday peak of 52.2 points, its highest reading since April 2025.
What the numbers actually say
The VXN closed at 29.78 on June 9, climbing from the low-to-mid 20s earlier that same week. At one point during the streak, the VXN jumped 8.1 points in a single session, its largest one-day increase since November. The VXN measures expected 30-day volatility for the Nasdaq 100. When it spikes like this, it means options traders are collectively bracing for turbulence, and paying a premium to protect themselves from it.
The catalyst was hard to miss. On June 5, the Nasdaq Composite dropped 4.18%, marking its worst single-day performance since April 2025. Five straight trading days of 1%+ moves, in either direction, is the kind of pattern that tends to show up at inflection points. The last time the Nasdaq 100 pulled this off was August 2024.
Why volatility streaks matter more than single-day drops