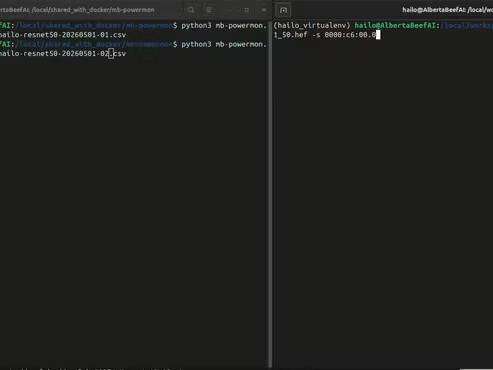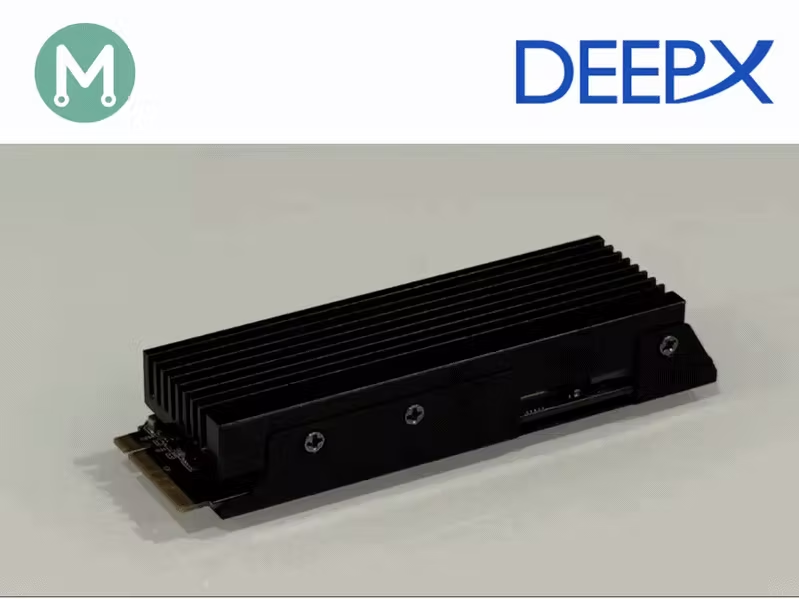
Story In Parts 1–3, we established a methodology for independent power measurement on edge AI accelerators. In Part 4, we applied it to the Axelera Metis.Series: Edge AI Power BenchmarkingNow we apply the same methodology to the DeepX M1 M.2 acceleration module.Installing the DeepX SDKDeepX provides excellent instructions on installing their DX-ALL suite.This will provide three virtual environments that can be used for:DX model zoo - for accessing pre-compiled modelsDX compiler - to compile to own modelsDX runtime - when performing inferenceReproducing the DeepX benchmarksBefore measuring power, I wanted to reproduce DeepX’s published benchmark. In line with the previous articles, I chose ResNet50, knowing it has the lightest post-processing stage, being a classification model.DeepX Model ZooResNet-50 on DeepX : 1, 067 FPS, 515.02 FPS/WContrary to the other manufacturer’s, DeepX publishes a FPS/W metric, which we will attempt to reproduce.Our initial target is to reproduce the benchmark of 1067 FPS.First throughput resultsIn order to measure the FPS metric for the ResNet50 model, I downloaded the following files from the DeepX model zoo:I copied these files in a bench/ResNet50 directory.Then I launched the dx-runtime virtual environment:$ cd dx-all-suite$ dx-runtime/venv-dx-runtime/bin/activate$ dxbenchmark --dir bench/ResNet50 --warmup 10 --time 30Runtime Framework Version: v3.2.0Device Driver Version: v2.1.0PCIe Driver Version: v2.0.1Device specification: 'all' (default)=== Model File: ../bench/ResNet50/ResNet50-1.dxnn ===Model Input Tensors: - input.1Model Output Tensors: - 495Tasks: [ ] -> npu_0 -> [] Task[0] npu_0, NPU, NPU memory usage 36,478,720 bytes (input 150,528 bytes, output 4,000 bytes) Inputs - input.1, UINT8, [1, 224, 224, 3 ] Outputs - 495, FLOAT, [1, 1000 ]Profiler data has been written to profiler.json ------------------------------------------------------------------------------- | Name | min (us) | max (us) | average (us) | ------------------------------------------------------------------------------- | Framework Response Handling | 2 | 236 | 6.40411 | 91, 5, 7, 5, 6, 6, 7, 8, 4, 5, 5, 5, 7, 5, 8, 6, 6, 7, 4, 6, 6, 5, 5, 5, 6, 5, 6, 6, 8, 5, ... | NPU Core | 2027 | 3272 | 2937.08 | 2031, 2992, 2973, 2966, 2961, 2929, 2990, 2943, 2958, 2924, 2993, 2965, 2943, 2935, 2900, 2986, 2981, 2855, 2940, 2926, 2974, 2907, 2959, 2926, 2943, 2935, 2964, 2911, 2915, 2970, ... | NPU Input Format Handler | 3 | 93 | 4.32167 | 47, 4, 4, 5, 5, 4, 5, 5, 5, 5, 5, 5, 4, 4, 5, 5, 5, 4, 4, 5, 5, 5, 5, 4, 4, 4, 4, 4, 4, 4, ... | NPU Output Format Handler | 1 | 72 | 1.05271 | 5, 1, 1, 1, 1, 1, 1, 1, 1, 1, 1, 1, 1, 1, 1, 1, 1, 1, 1, 1, 1, 1, 1, 1, 1, 1, 1, 1, 1, 1, ... | NPU Task | 2738 | 12490 | 5931.01 | 11921, 5975, 5938, 5908, 5929, 5867, 5995, 5905, 5958, 5901, 5933, 5965, 5896, 5880, 5900, 6012, 6019, 5800, 5908, 5843, 5926, 5871, 5961, 5905, 5899, 5874, 5917, 5839, 5855, 5908, ... | PCIe Read | 17 | 776 | 75.5699 | 181, 74, 75, 74, 75, 74, 78, 75, 75, 74, 75, 74, 75, 74, 76, 104, 74, 75, 74, 74, 75, 70, 74, 70, 75, 86, 69, 74, 86, 78, ... | PCIe Write | 77 | 923 | 133.779 | 242, 135, 135, 128, 130, 133, 131, 130, 139, 134, 135, 132, 131, 131, 131, 138, 137, 130, 129, 132, 135, 139, 142, 136, 138, 138, 136, 132, 132, 138, ... | Service Process Wait | 2150 | 176496455 | 20435.1 | 176465205, 3006, 2986, 2979, 2975, 2943, 3006, 2954, 2976, 2939, 3004, 2982, 2955, 2948, 2911, 3005, 2995, 2867, 2951, 2946, 2984, 2921, 2971, 2941, 2957, 2951, 2981, 2927, 2928, 2987, ... | dxbenchmark_ResNet50-1.dxnn | 30116404 | 30116404 | 3.01164e+07 | 30116404, -------------------------------------------------------------------------------The dxbenchmark utility generates output in three formats:csvjsonhtmlHere is the CSV for out session:(venv-dx-runtime) $ cat DXBENCHMARK_2026_05_11_143452.csvRuntime Version, Firmware Version, Device Driver Version,PCIe Driver Version,Model Name,FPS,NPU Inference Time Mean,NPU Inference Time SD,NPU Inference Time CV,Latency Mean,Latency SD,Latency CV3.2.0,2.5.0,2.1.0,2.0.1,ResNet50-1.dxnn,1009.46,2.94,0.05,0.02,5.93,0.39,0.07Here is the JSON for out session:(venv-dx-runtime) $ cat DXBENCHMARK_2026_05_11_143452.json{ "Runtime Version": "3.2.0", "Firmware Version": "2.5.0", "Device Driver Version": "2.1.0", "PCIe Driver Version": "2.0.1", "results": [ { "Model Name": "ResNet50-1.dxnn", "FPS": 1009.46, "NPU Inference Time": { "mean": 2.94, "sd": 0.05, "cv": 0.02 }, "Latency": { "mean": 5.93, "sd": 0.39, "cv": 0.07 } } ]}The most convenient output is the HTML output:
Edge AI Power 5: Measuring the Power Efficiency of DeepX
In this article, we use our independent power measurement methodology with the DeepX M1. By Mario Bergeron.
TL;DRAI
DeepX M1 achieves 1009 FPS on ResNet50 with independent power measurement validation, enabling FPS/W vendor comparison. Standardized power-efficiency benchmarking methodology guides CTO stack selection for edge AI deployment and multi-vendor ROI assessment.
2,325 words~11 min read