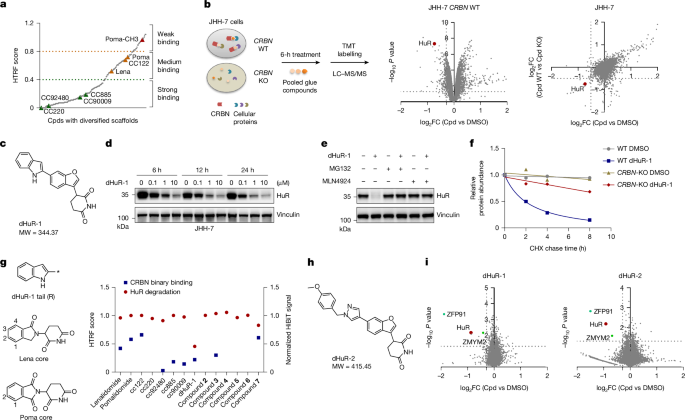
MainCRC harbouring BRAF mutations (approximately 10% of cases) represents one of the most aggressive and therapeutically challenging CRC subtypes4, with a median survival of less than 12 months under current therapies3. Unlike BRAF-mutant melanoma, where BRAF inhibitors (for example, vemurafenib and encorafenib) show remarkable efficacy, BRAF-mutant CRC exhibits intrinsic resistance due to EGFR-dependent feedback reactivation of the MAPK pathway. Although the US Food and Drug Administration (FDA)-approved combination of encorafenib (a BRAF inhibitor (BRAFi)) + cetuximab (an anti-EGFR antibody) improves response rates (20–26% versus 5% with BRAFi alone)5,6, most patients derive no benefit, and responders typically relapse within 4–6 months6. Consequently, more than 75% of patients with BRAF-mutant CRC lack durable treatment options7, underscoring the urgent need for novel therapeutic modalities that overcome resistance or alternative targeting strategies for BRAF or its critical co-factors.The human RNA-binding protein HuR is encoded by the gene ELAV-like RNA-binding protein 1 (ELAVL1; also known as HUR) and binds to AU-rich elements within the introns or 3′ untranslated regions of target mRNAs, thereby regulating pre-mRNA processing, mRNA stability and translation8,9. HuR has a critical role in modulating mRNA stability and translational control, serving as a key post-transcriptional regulator of specific RNAs across both physiological and pathological contexts, particularly in cancer progression10,11. HuR is frequently overexpressed and/or abnormally enriched in the cytoplasm of cancer cells. Its aberrant expression is associated with high tumour grades and poor prognoses across a spectrum of malignancies, including CRC12. HuR enhances the expression of proteins that drive cancer progression, such as vascular endothelial growth factor (VEGF) and cell cycle regulators, particularly in response to stresses such as oncogenic mutations and chemotherapy or targeted therapies10,13,14. Through its pleotropic effects, HuR promotes tumour growth, invasion, angiogenesis and resistance to therapeutic agents, making it an important target for cancer therapeutics15. The discovery of small molecules and small interfering RNAs that inhibit the function of HuR have provided proof of concept for potential therapeutic benefit of targeting HuR in many cancer types, such as colorectal, pancreatic, renal, ovarian, breast, liver and lung cancers, as well as malignant peripheral nerve sheath tumour16,17,18,19,20,21,22,23,24,25. However, none of these drug candidates has been advanced to clinical development to date, owing to poor potency or lack of efficient delivery to the tumour26.Molecular glue degraders (MGDs), a novel class of chemical compounds, have recently emerged as a promising strategy for selectively targeting and degrading disease-causing proteins, including those considered ‘undruggable’. By chemically inducing ternary complex formation between a target protein and a ubiquitin E3 ligase, MGDs trigger proximity-driven ubiquitination and subsequent degradation of the target protein. Of note, recent breakthroughs have expanded the cereblon (CRBN)-based MGD target landscape. Beyond classical immunomodulatory drugs (IMiDs) such as thalidomide analogues—which target the transcription factors IKZF1, IKZF3, ZFP91, ZMYM2 and SALL4 (refs. 27,28,29,30)—MGDs have also been identified against additional zinc-finger proteins (for example, IKZF2 and WIZ)31,32, kinases (for example, CK1α)33 and scaffold proteins (for example, GSPT1)34. In addition, cryo-electron microscopy (cryo-EM) structural studies of CRBN–MGD–neosubstrate complexes have revealed critical molecular determinants for ternary complex formation35,36,37, including β-hairpin stabilization and hydrophobic ‘glue patches’. Despite these advances, fundamental challenges persist in rational MGD development. Serendipity still drives most discoveries owing to limited predictive tools. This bottleneck stems from the transient nature of MGD-induced protein–protein interactions and the lack of universal structural signatures for ‘glueable’ target interfaces. Recent computational efforts using deep learning platforms (for example, AlphaFold38) for interface prediction show promise but require experimental validation.Fortunately, emerging proteomic technologies are now enabling systematic discovery of MGD-responsive targets. Here we utilized large-scale proteomic profiling of cells treated with rationally designed CRBN modulators and identified MGDs targeting HuR. Mechanism-of-action studies showed that dHuRs function as molecular glues to induce a CRBN–MGD–HuR ternary complex, leading to the polyubiquitination and proteasomal degradation of HuR. Through a series of bioinformatics analyses, in vitro cell-based assays and in vivo models, we discovered that BRAF-mutated CRC cells are particularly sensitive to the treatment of dHuRs. The mechanism leading to this activity is at least in part due to the effects of HuR degradation on BRAF RNA splicing and decreased BRAF protein level. The anti-proliferative effect of HuR degradation is also demonstrated in BRAFi-resistant cancer cells and is associated with decreased oncogenic protein BRAF and EGFR and sustained decrease of MAPK pathway signalling as measured by p-ERK level. This combination of HuR degradation with EGFR–BRAF–MEK inhibition resulted in synergistic antitumour effects. These data support the development of dHuR in BRAF-mutated CRC.dHuRs identified by proteomicsTo systematically identify neosubstrates engaging CRBN, a CRBN-based molecular glue library with more than 10,000 compounds was designed. Approximately 200 representative compounds with diversified scaffolds were applied to a homogeneous time-resolved fluorescence (HTRF) assay for measuring the CRBN binary binding affinity, which was reflected in the displacement of thalidomide-red from the CRBN-binding pocket. Commercially available CRBN E3 ligase-modulatory drugs were included as benchmarks, and N-methylated pomalidomide (Poma-CH3) was specifically designed to abolish CRBN binding, serving as a negative control. At a fixed compound concentration of 1.6 µM, the HTRF scores revealed three binding classes: weak (HTRF score > 0.8), medium (0.8–0.4) and strong (less than 0.4). Of the tested compounds, 87.4% showed medium-to-strong CRBN-binding affinity (Fig. 1a), which indicates that the majority of the library compounds are CRBN binders. In this case, CRBN wild-type (WT, CRBN+/+) and knockout (KO, CRBN−/−) cells were treated with a set of compounds pooled randomly from the library and then subjected to global quantitative proteomics. As shown in Fig. 1b, HuR was identified as one of the top candidates, with protein abundance reduced specifically in CRBN WT cells but not in CRBN-KO cells upon pooled compound treatment.Fig. 1: Identification of dHuRs.The alternative text for this image may have been generated using AI.Full size imagea, HTRF-based primary screen of a compound library (1.6 µM) for CRBN binders. Cpds, compounds. b, Schematic of the proteomic screen in CRBN WT versus CRBN-KO cells treated with compound pools (left), and volcano plots showing protein abundance changes in JHH-7 CRBN WT (middle) or CRBN-KO (right) cells. LC–MS/MS, liquid chromatography–tandem mass spectrometry; TMT, tandem mass tag. c, Chemical structure and molecular weight (MW) of dHuR-1 (1). d, Immunoblot of HuR in JHH-7 cells treated with dimethyl sulfoxide (DMSO) or dHuR-1. e, Immunoblot of HuR in JHH-7 cells treated with dHuR-1 (10 µM) with or without MLN4924 (1 µM; a NEDD8 inhibitor) or MG132 (10 µM; a proteasome inhibitor). f, Quantified immunoblot of HuR in JHH-7 CRBN WT and CRBN-KO cells treated with cycloheximide (CHX; 100 µg ml−1) in the presence or absence of dHuR-1 (10 µM) over time (0–8 h). g, Schematic of the chemical structures of 2–7 generated by appending the dHuR-1 tail moiety to the core scaffold of Poma or lenalidomide (Lena; left). HTRF-measured binding affinity of the indicated compounds to CRBN (left y axis) and HiBiT-based quantification of HuR degradation (right y axis) are also shown (right). h, Chemical structure and MW of dHuR-2 (8), an optimized degrader. i, Volcano plots of protein abundance changes in KP4 cells treated with dHuR-1 or dHuR-2 (10 µM, 2 h). P values were determined by two-tailed, unpaired Student’s t-test (b,i). Grey dotted lines indicate cut-off of fold-change (FC) and P value (b,i). For gel source data, see Supplementary Fig. 2.We next examined endogenous protein expression in response to individual compounds and identified that dHuR-1 (1) strongly decreased the abundance of HuR in a dose-dependent and/or time-dependent manner (Fig. 1c,d). Treatment with the Nedd8 enzyme inhibitor MLN4924 or proteosome inhibitor MG132 prevented the dHuR-1-induced decrease of HuR (Fig. 1e). The shortened protein half-life as determined by the CHX chase assay was observed upon dHuR-1 treatment in CRBN WT but not in CRBN-KO cells (Fig. 1f and Extended Data Fig. 1a). Instead, the mRNA level was just slightly reduced (Extended Data Fig. 1b), which might be caused by the self-regulation of HuR on its own mRNA39. A dual-fluorescence reporter (HuR–GFP–IRES–mCherry) assay confirmed target degradation at the post-transcriptional level (Extended Data Fig. 1c). All these data supported dHuR-1-mediated CRBN-dependent degradation on HuR. In addition, nuclear–cytoplasmic fractionation demonstrated pan-compartmental HuR degradation (Extended Data Fig. 1d).To have a stronger degrader of HuR for further biophysical or biochemical and biological functional assays, a small scale of structure–activity relationship study was conducted by modifying the core (the ring system directly attached to glutarimide) and tail (the extension group attached to the core) substructures based on dHuR-1. We found that the unique benzofuran core of dHuR-1 was critical for HuR engagement versus IMiD scaffolds. Although 2–7 (for compound names, see Supplementary Information) showed binding affinity to CRBN, they lost activity on HuR degradation with the core replaced (Fig. 1g and Extended Data Fig. 1e). The optimized analogue dHuR-2 (8) achieved superior CRBN-binding affinity (HTRF half-maximal inhibitory concentration (IC50) = 0.16 µM) and HuR degradation potency (half-maximal degradation concentration (DC50) = 3.8 nM, maximum degradation (Dmax) = 96% and time to degrade half the protein (T1/2) = 2.45 h; Fig. 1h). Proteomic profiling and immunoblot analysis revealed selective degradation of HuR and the known CRBN neosubstrates ZFP91 and ZMYM2 with comparable potency, whereas GSPT1 and Hu protein paralogues (HuB, HuC and HuD) were spared; Fig. 1i and Extended Data Fig. 1f–h).Characterization of the CRBN–MGD–HuR complexInspired by the conserved β-hairpin G-loop topology in CRBN neosubstrates32,34,40, we mapped two analogous structural motifs in HuR (G58/G144 loops) by molecular docking. We found that mutagenesis on G58 but not G144 of the HuR reporter abolished dHuR-1-mediated degradation (Extended Data Fig. 2a). In addition, comprehensive mutagenesis revealed a strict glycine requirement at position 58, mirroring the conservation of the G-loop mechanism (Extended Data Fig. 2b). The G58N mutation disrupted the CRBN–HuR interaction as demonstrated by NanoBRET and co-immunoprecipitation assays (Fig. 2a and Extended Data Fig. 2c). Regarding which amino acids of CRBN were engaged in HuR degradation, we found that reintroduction of WT CRBN via transfection in 293T CRBN-KO cells restored the dHuR-1-dependent degradation of HuR reporter, whereas CRBN mutants (E377V or V388I)34,41 displayed diminished activity, with the double mutants exhibiting a stronger effect (Extended Data Fig. 2d). Consistently, endogenous mouse HuR could not be degraded in Crbn WT mouse embryonic fibroblasts but could be degraded in CrbnI391V/V380E double knock-in (KI) mouse embryonic fibroblasts (Extended Data Fig. 2e). The two sets of data indicated the critical role of both E377 and V388 in the CRBN–HuR complex.Fig. 2: Characterization of CRBN–MGD–HuR ternary complex formation.The alternative text for this image may have been generated using AI.Full size imagea, NanoBRET assay comparing ternary complex formation between CRBN and either WT HuR or the HuR(G58N) mutant induced by 10 μM dHuR-1. Data are presented as mean ± s.d.; n = 3 biologically independent samples. P values were determined by two-tailed, unpaired Student’s t-test. BRET, bioluminescence resonance energy transfer. b, TR-FRET assay showing ternary complex formation between His–DDB1–CRBN and GST–HuR induced by various concentrations (8 to 0.0005 μM, fourfold dilutions) of dHuR-1 or dHuR-2. c, Western blot detection of polyubiquitinated HuR after incubation with recombinant E1, E2 and E3 enzymes ± 100 μM dHuR-2 (2 h at 30 °C). For gel source data, see Supplementary Fig. 2. Ub, ubiquitin. d, Cryo-EM map of DDB1–CRBN bound to HuR and dHuR-2 (the DDB1 BPB domain was masked out). e, Binding pocket of dHuR-2 in the ternary complex. Key interacting residues are shown in stick representation, and Cα of G58 is shown in sphere representation. Hydrogen bonds are depicted as dashed lines. f, dHuR-2 (green) induced a tight protein–protein interaction between CRBN (grey) and HuR (pink). DDB1 was omitted for clarity. g, Binding of dHuR-2 created an additional buried surface area at the protein–protein interface between CRBN and HuR. The buried surface from the binding of dHuR-2 (light brown) was compared with the buried surface between CRBN and HuR (purple).With the degron of HuR mapped, human HuR protein containing RRM1 and RRM2 domains was purified, as well as the DDB1–CRBN–TBD proteins. Surface plasmon resonance (SPR) quantified CRBN–MGD interactions, showing tighter binding of dHuR-2 (affinity constant (KD) = 4.6 µM versus 15.5 µM; Extended Data Fig. 2f). The negative signal detected with CRBN(W386A) demonstrated a strict dependence on intact CRBN–MGD interfaces (Extended Data Fig. 2f), excluding off-target binding mechanisms. dHuR-2 also triggered stronger formation of the ternary complex as demonstrated by SPR experiments showing that HuR binds to CRBN–DDB1 with KD = 434 nM versus 299 nM in the presence of dHuR-1 versus dHuR-2 (Extended Data Fig. 2g). Consistently, time-resolved fluorescence resonance energy transfer (TR-FRET) ternary complex analysis revealed enhanced cooperativity for dHuR-2 over dHuR-1 (half-maximal effective concentration = 0.13 µM versus 0.71 µM; Fig. 2b). To establish a functional linkage between ternary complex formation and degradation machinery activation, the E3-substrate tagging by ubiquitin biotinylation (ESTUB) assay was conducted to check the ubiquitination of HuR. As expected, the polyubiquitin chain was added to endogenous HuR in the presence of dHuR-2 (Extended Data Fig. 2h). The in vitro reconstitution ubiquitination assay also confirmed that dHuR-2 drives CRL4–CRBN-mediated HuR polyubiquitination (Fig. 2c).To have a better understanding of ternary formation, we solved the cryo-EM structure of the DDB1–CRBN–MGD–HuR complex to 3.3 Å (Fig. 2d and Extended Data Fig. 3b) following the workflow as shown in Extended Data Fig. 3a. The structure revealed that HuR interacted with CRBN–dHuR-2 through its G-loop, with G58 having a critical role. The glutarimide ring of dHuR-2 engaged the Tri-W pocket of CRBN using W380, W386 and W400, while forming a hydrogen bond with the sidechains of H378. The benzofuran moiety packed against W386, H378 and P352 on CRBN, whereas the pyrazole moiety was positioned near the G58 loop of HuR. The phenyl ring of dHuR-2 orients towards the F150 loop of CRBN, probably stabilizing a ‘closed’ CRBN conformation42. In addition, a key residue, R53, on HuR interacted with E377 on CRBN (Fig. 2e). Furthermore, our degrader not only induced conformational changes in HuR (Extended Data Fig. 3c–f) but also promoted CRBN–HuR interactions, burying a total surface area of approximately 780 Å2 (Fig. 2f,g). These interactions created potential contacts between CRBN and HuR, specifically between CRBN residues Y355, H397 and R373 and HuR residues V56, A57 and N30, respectively (Extended Data Fig. 3g).HuR degradation inhibits BRAF-mutant CRCTo identify HuR-dependent cellular vulnerabilities, we analysed DepMap consortium data (https://depmap.org/portal), which revealed a strong positive correlation between HuR and BRAF, as well as MEK1 (encoded by MAP2K1; Extended Data Fig. 4a). BRAF mutation status emerged as the strongest predictor of HuR dependency across cancer cell lines (Fig. 3a). BRAF is more frequently mutated in skin cancers and CRCs, and the co-dependency was particularly pronounced in CRCs (Extended Data Fig. 4b,c). These analyses suggested that BRAF-mutant CRCs may be uniquely sensitive to HuR degradation.Fig. 3: HuR degradation exhibited selective efficacy in BRAF-mutant CRC and suppressed MAPK signalling.The alternative text for this image may have been generated using AI.Full size imagea, DepMap analysis revealed preferential sensitivity of BRAF-mutant tumour cells to HuR deletion. Data represent the difference in HUR CRISPR scores between mutant and WT cell lines with case numbers indicated. P values were calculated by two-tailed, unpaired Student’s t-test. Data were from DepMap (DepMap_Public_23Q2+Score and Mutation_22Q2_Public; https://depmap.org/portal/). Dashed lines indicate cut-off for effect of gene aberration and P value. b, Growth inhibition of dHuR-2 in BRAF-mutant and WT cell lines over 8 days. Data were normalized to DMSO control. Data are presented as mean ± s.d.; n = 3 biologically independent samples. c, 3D spheroid growth assay of Colo205 cells stably expressing control single-guide RNA (sgRNA; sgCtrl) or HUR-targeting sgRNA (sgHuR) with or without doxycycline (Dox; 200 ng ml−1) induction (left). Data are presented as mean ± s.d.; n = 3 biologically independent samples. P values were determined by two-tailed, unpaired Student’s t-test. Immunoblot confirmed HuR depletion post-induction (right). d, Immunoblot analysis of HuR degradation in parental Colo205, CRBN−/− and HURG58A cells treated with dHuR-2 for 24 h. Vinculin served as a loading control. e, Corresponding 3D spheroid inhibition by dHuR-2 (0.001–1 μM) in Colo205 parental versus HURG58A cells over 8 days. f, Tumour growth curves in Colo205 xenografts (n = 6 per group) treated with vehicle or dHuR-2 (6.25–25 mg kg−1, b.i.d.) for 28 days. Data show mean tumour volume ± s.e.m. mpk, mg kg−1; p.o., oral administration. g, KEGG pathway enrichment analysis of downregulated genes in Colo205 cells treated with dHuR-2 (1 μM, 96 h) versus DMSO control. The top ten enriched pathways are shown (false discovery rate < 0.05). h, Immunoblot analysis of MAPK pathway components in Colo205 parental and HURG58A cells treated with dHuR-2 (0.1 or 1 μM, 6 days). For gel source data, see Supplementary Fig. 2.Source dataProof-of-concept studies across 13 CRC cell lines confirmed this hypothesis: dHuR-2 potently reduced viability in all 6 BRAF-mutant lines, whereas BRAF WT cell lines remained resistant despite efficient HuR degradation (Fig. 3b and Extended Data Fig. 4d,e). This selective vulnerability was further validated in colony formation assays (Extended Data Fig. 4f). Genetic corroboration via CRISPR–Cas9-mediated HUR KO recapitulated this phenotype (Fig. 3c and Extended Data Fig. 4g–i). To determine whether HuR degradation is responsible for dHuR-2-mediated proliferation inhibition, we introduced a HURG58A mutation in Colo205 cells by genetic KI. dHuR-2-induced degradation of HuR was completely abolished in this cell line, as was the case with CRBN depletion (Fig. 3d). Accordingly, CRBN-KO or HURG58A abrogated the dHuR-2-induced anti-proliferation in a 3D-spheroid assay (Fig. 3e). These data confirmed the CRBN-dependent and HuR-dependent effect of dHuR-2.Given the favourable physiochemical, in vitro absorption, distribution, metabolism and excretion (ADME) properties and oral bioavailability of dHuR-2 in mice (Extended Data Fig. 5a and Supplementary Table 4), we assessed its in vivo efficacy in a Colo205 xenograft model. Mice bearing Colo205 tumours were treated with dHuR-2 via oral gavage (6.25, 12.5 or 25 mg kg−1, twice daily (b.i.d.)) for 28 days, which resulted in dose-dependent tumour growth inhibition (Fig. 3f). Of note, dHuR-2 was well tolerated, with no significant changes in body weight or adverse clinical observations (Extended Data Fig. 5b). Pharmacokinetic and pharmacodynamic analyses were performed on day 14 (mid-study) and day 28 (final dose), respectively. Both plasma and tumour samples exhibited dose-proportional exposure and target engagement (Extended Data Fig. 5c,d), confirming the in vivo activity of the compound. In addition, the recovery rate of HuR in Colo205 tumours in vivo was correlated to that in vitro, where it took about 24 h for the HuR protein to fully recover after dHuR-2 removal from culture medium of Colo205 cells (Extended Data Fig. 5e).To elucidate the mechanism underlying HuR depletion-mediated tumour growth inhibition, we performed RNA sequencing (RNA-seq) on dHuR-2-treated Colo205 cells. Kyoto Encyclopedia of Genes and Genome (KEGG) pathway analysis demonstrated that dHuR-2 potently suppressed the MAPK signalling and cell cycle-related pathways (Fig. 3g), a finding further corroborated by gene set enrichment analysis analysis (Extended Data Fig. 6a). By applying additional proteomics profiling, cell cycle and DNA replication were also found enriched as top pathways in downregulated proteins of Colo205 treated with dHuR-2 (Extended Data Fig. 6b). Consistent with these observations, dHuR-2 treatment or genetic HuR depletion attenuated MAPK signalling and induced cell cycle (G1 phase) arrest (Extended Data Fig. 6c,d). To dissect the role of HuR in these pathways, we treated parental Colo205 cells and isogenic HuR(G58A) mutants with dHuR-2. In parental cells, dHuR-2 markedly reduced phosphorylation of ERK (an indicator of the MAPK pathway), and downregulated BRAF and EGFR protein levels (Fig. 3h). These effects were abolished in HuR(G58A)-mutant cells. Collectively, our data support a model in which loss of HuR disrupts MAPK signalling via BRAF–EGFR dysregulation, culminating in cell cycle arrest.HuR regulates BRAF alternative splicingTo uncover how dHuR-2-mediated HuR degradation suppresses BRAF, a mechanism that might explain why BRAF-mutant CRC is prone to respond to HuR degradation. First, we set out to confirm that treatment with dHuR-2 caused a dose-dependent reduction in BRAF protein levels across multiple CRC cell lines (Fig. 4a), without altering total BRAF mRNA abundance or stability (Extended Data Fig. 7a,b). Second, a pulse assay demonstrated diminished nascent BRAF synthesis after HuR degradation (Extended Data Fig. 7c). When looking into the RNA-seq data, alternative splicing of BRAF upon dHuR-2 treatment was noted (Fig. 4b, upper panel). Mechanistic studies revealed that HuR degradation promotes the skipping of exon 18 in BRAF pre-mRNA, as shown by isoform-specific PCR with reverse transcription (RT–PCR; Fig. 4b, lower panel). This regulation was HuR dependent, as confirmed by both HUR-KO and degradation-resistant HuR(G58A) cells (Fig. 4c). To define the molecular basis of this regulation, we identified direct HuR–BRAF RNA interactions through: (1) RNA immunoprecipitation and RNA pull-down assays, which mapped HuR binding to a U-rich element in BRAF intron 17, consistent with the analysis on the public eCLIP-seq dataset (https://www.encodeproject.org/, ENCSR296TSJ and ENCSR09OLNQ)43 (Fig. 4d,e and Extended Data Fig. 7d); (2) SPR analysis that quantified high-affinity binding of HuR and U-rich RNA (Fig. 4f); and (3) minigene assays, showing that U-rich element deletion or U-to-C mutation abolishes HuR degradation-mediated BRAF exon 18 skipping (Fig. 4g and Extended Data Fig. 7e). Of note, this mechanism is human specific, as mouse Braf lacks the conserved U-rich sequence. When replacing the human BRAF intron 17 with mouse Braf intron 17 in the minigene, HuR degradation-mediated BRAF exon 18 skipping was abolished. In mouse cells with human CRBN overexpressed, the Braf isoform with exon 18 skipped was not observed (Extended Data Fig. 7f). With the construction of an exon 18-included or exon 18-skipped isoform (designated as BRAF-X1 and BRAF-X2, respectively), we confirmed that the BRAF-X2 showed dramatically reduced protein expression and impaired function, failing to activate ERK phosphorylation (Fig. 4h,i). In addition, a proteasome inhibitor MG132, but not the lysosome inhibitor CQ, slightly increased the protein abundance of mCherry–X2, in which mCherry was fused to C-terminal region (E17–E19) of BRAF-X2 (Fig. 4j). We also conducted polysome fractionation assays and found that, unlike BRAF-X1, BRAF-X2 was more enriched in monosome fractions and had reduced association with polysomes, indicating significantly lower translational efficiency of this transcript (Fig. 4k,l). These observations are consistent with a previous publication44. Together, dHuR-2 increased the conversion of the BRAF-X1 to BRAF-X2 transcript (Fig. 4m), which could not be translated into BRAF protein efficiently and robustly. These results demonstrated that HuR degradation suppressed BRAF expression by promoting U-rich-dependent RNA binding and exon 18 skipping, unveiling a novel splicing-based mechanism governing oncogenic BRAF levels by HuR.Fig. 4: HuR regulated BRAF splicing through direct RNA binding.The alternative text for this image may have been generated using AI.Full size imagea, Immunoblot analysis of HuR, BRAF and EGFR protein levels in BRAF-mutant and WT CRC cell lines treated with DMSO or dHuR-2 for 8 days. Vinculin served as a loading control. b, RNA-seq tracks of the BRAF exon 17–19 region with percent spliced in (top). RT–PCR analysis of BRAF transcripts with exon 18 included or skipped in Colo205 cells treated with 1 μM dHuR-2 over time (6–24 h) (bottom). Red shading highlights the region (around BRAF exon 18) with number of reads altered notably upon dHuR-2 treatment. c, RT–PCR analysis of the abundance of BRAF transcripts with exon 18 included or skipped in HURG58A (top) or HUR-KO (bottom) Colo205 cells. sgNT, non-targeting sgRNA. d, Quantitative PCR (qPCR) analysis of bound RNAs from IgG or HuR pull-downs in Colo205 cells treated with or without dHuR-2. RIP, RNA immunoprecipitation. e, Immunoblot of HuR pull-downs using biotinylated BRAF intron 17 RNA (containing U-rich element) versus scrambled control. f, Sensorgrams of HuR binding to a U-rich element derived from BRAF RNA (3.84 to 0.03 μM, twofold dilutions). RU, response unit. g, BRAF minigene diagram (top), and RT–PCR analysis of BRAF minigene variants (WT versus U-rich mutant) in 293T cells treated with 1 μM dHuR-2 (24 h; bottom). For the U-rich mutant, the 20-bp U-rich sequence upstream of the 3′ splice site (SS) was mutated to UCUCUCUCUCUCUCUCUCUC. h, Schematic of the BRAF 3′ region showing exon 18-included (X1) and exon 18-skipped (X2) isoforms. Skipping of the 154-bp exon 18 shifts the stop codon by 127 bp, yielding a 27-bp shorter BRAF-X2. i, Schematic of FLAG–BRAF (X1 or X2)–IRES–eGFP reporter constructs (top). Immunoblot analysis of 293T cells expressing BRAF isoforms, showing FLAG–BRAF and p-ERK levels (bottom). j, Dual-fluorescence reporters of the BRAF C terminus (exons 17–19) for X1 or X2 (top). Flow cytometry of mCherry normalized to eGFP in cells treated with DMSO, CQ (10 μM, 24 h) or MG132 (10 μM) is also shown (bottom). k, Polysome profiling of Colo205 cell lysates (10–50% sucrose). The absorbance (optical density at 260 nm (OD260)) trace shows peaks of 40S, 60S and 80S monosomes and polysomes. Fractions analysed in subsequent panels are indicated along the x axis. Schematic created in BioRender; Wang, X. https://biorender.com/prnw9m6 (2026). l, Distribution of BRAF-X1 and BRAF-X2 mRNAs across polysome fractions quantified by RT–qPCR. ACTB mRNA served as a positive control for translationally active transcripts. Data are presented as the percentage of total mRNA in each fraction. m, RT–qPCR of BRAF isoform switch (X1/X2) in Colo205 cells ± dHuR-2 (1 µM, 24 h). Data are presented as mean ± s.d.; n = 3 biologically independent samples (d,j,l,m). P values were determined by two-tailed, unpaired Student’s t-test. For gel source data, see Supplementary Fig. 2.To further explore the effect of HuR degradation on splicing regulation, we conducted splicing analysis based on the RNA-seq data and revealed that dHuR-2 altered only 2% of the total junction-read events, and exon skipping was the major type of these alterations (68.7%; Extended Data Fig. 7g). To exclude indirect effect, we overlapped these HuR-controlled splicing events with potential HuR-bound RNAs from public eCLIP-seq datasets (https://www.encodeproject.org/, ENCSR09OLNQ) and found 288 genes in common. Meanwhile, to understand the consequence of splicing regulation on protein levels, we integrated whole-cell proteomics in Colo205 upon dHuR-2 treatment. Among the 288 genes, only 4 genes (BRAF, NSD2, SLC35B1 and GRB10) showed significantly decreased protein level, indicating that direct HuR-regulated splicing alteration might not always be translated into changes of protein abundance (Extended Data Fig. 7h). Considering that BRAF is not the only gene regulated by HuR degradation, a rescue experiment was conducted to determine the role of dHuR-mediated BRAF splicing and protein downregulation on its anti-proliferative activities in BRAF-mutant CRC. We generated a stable cell line (MDST8) with inducible overexpression of BRAF(V600E) (CDS) and confirmed that the overexpressed FLAG–BRAF(V600E) (CDS) failed to be downregulated by dHuR-2, and p-ERK levels remained unchanged upon dHuR-2 treatment. In this case, most of the anti-proliferation effect of dHuR-2 was rescued by the overexpressed BRAF(V600E) (with intron-less CDS). By contrast, overexpression of FLAG–BRAF(V600E) (with intron 17), which still responded to dHuR-2-mediated splicing regulation, failed to rescue the anti-proliferation effect of dHuR-2 (Extended Data Fig. 7i,j). Together, we came to a notion that HuR indeed modulates additional genes beyond BRAF. However, the effect of HuR degradation on splicing regulation and subsequent protein downregulation does not seem to be widespread in the context of BRAF-mutant CRC. In addition, BRAF splicing was demonstrated to be a major player in mediating the anti-proliferative effect of HuR degradation.In addition to our findings that established HuR-mediated splicing regulation on BRAF, previous studies have demonstrated that HuR binds to and post-transcriptionally regulates VEGFA mRNA14,45. Here we found that HuR degradation downregulated VEGFA mRNA and secreted protein levels (Extended Data Fig. 8a). Mechanistically, the pre-mRNA splicing efficiency was reduced, as the reduction of VEGFA mRNA expression was observed before reduction of pre-mRNA (Extended Data Fig. 8b–d). When looking into the public eCLIP-seq datasets (https://www.encodeproject.org/, ENCSR09OLNQ), we identified HuR-binding peaks on VEGFA (Extended Data Fig. 8e). Using RNA pull-down assays, a U-rich sequence within intron 5 of VEGFA was found to be required for HuR binding (Extended Data Fig. 8f,g). As a result of HuR-bound and HuR-regulated VEGFA splicing efficiency, upon dHuR treatment, less angiogenesis (indicated by mouse CD31 staining) in Colo205 CDX tumours was detected (Extended Data Fig. 8h). This anti-angiogenesis effect may contribute to the in vivo antitumour activity of dHuRs.dHuRs inhibit BRAFi-resistant cells and synergize with BRAFiCRC remains a major global health issue, particularly in patients with BRAF mutations, which are linked to poor prognosis. The systemic treatment options for these patients include BRAFi plus anti-EGFR with or without chemotherapy plus anti-VEGF6,46,47. Despite great progress, there remain substantial unmet needs for patients whose tumours harbour BRAF mutations due to rapid development of drug resistance to BRAF inhibition3.To assess HuR degradation as a resistance-overcoming strategy, we generated BRAFi-resistant lines (WiDr, HT29 and MDST8 for CRC, and SH4 for melanoma; all harbouring BRAF(V600E) or BRAF(V600K) mutations) by dose-escalated dabrafenib treatment for more than 3 months. All resistant lines showed resistance to encorafenib, a next-generation BRAFi, but retained sensitivity to dHuR-2 (Fig. 5a and Extended Data Fig. 9a,b). In BRAF(V600E)-mutant CRC, EGFR-mediated MAPK reactivation was regarded as one of the major resistance mechanisms. Consistent with the literature1,2, the induced resistant lines shared common features identified from clinical resistant patients, including increased expression of RTKs (EGFR, FGFR and MET) and RAS, among other proteins (Extended Data Fig. 9c). Higher EGFR levels were also observed in BRAF(V600E)-mutant or BRAF(V600K)-mutant CRC cell lines than in the melanoma cell line (A375; Extended Data Fig. 9d). BRAFi induced upregulation of p-EGFR, enhanced p-ERK signalling and compensatory MAPK-related gene expression via a feedback loop after 6 h (Extended Data Fig. 9e–g). By contrast, dHuR-2 sustained MAPK pathway suppression for at least 8 days, concomitant with reduced BRAF and EGFR protein (Figs. 4a and 5b). BRAFi-resistant cells could still respond to HuR or BRAF depletion, which might explain why dHuRs maintained anti-proliferative activity in BRAFi-resistant cells (Fig. 5c and Extended Data Fig. 9h). There were synergistic or at least an additive anti-proliferative effect of dHuR-2 combined with BRAFi across multiple BRAF-mutant CRC cell lines (Fig. 5d and Extended Data Fig. 10a). Similar phenotypes were observed in patient-derived xenografts when combing BRAFi and dHuR-3 (9) (Fig. 5e and Extended Data Fig. 10b), a close analogue of dHuR-2 showing less cytochrome P450 inhibition, which reduces the potential drug–drug interaction and therefore is more suitable for in vivo drug combination studies. Accordingly, there was more profound inhibition on the MAPK pathway upon combination treatment (Fig. 5f,g). Using HUR-KO and HuR(G58A)-mutant systems, we confirmed that a combination effect strictly requires HuR depletion or degradation (Extended Data Fig. 10c,d). In addition, by conducting an unbiased CRISPR screen with a kinome library in HT29 cells (Extended Data Fig. 10e), we found that EGFR ranked as the top gene whose depletion sensitized cells to dHuR-2. MAPK1 (also known as ERK2) was also included in the top candidates, emphasizing again the engagement of the EGFR–RAF–MEK–ERK pathway (Fig. 5h). Consistently, EGFRi or MEKi enhanced colony formation inhibition when combined with dHuR-2 in HT29 cells (Fig. 5i). The synergistic effect of enhancing the cytotoxicity between dHuR-2 and EGFRi or MEKi was also observed in Colo205, Colo201, HT29 and WiDr cells (Extended Data Fig. 10f).Fig. 5: HuR degradation overcomes BRAFi resistance through sustained pathway suppression.The alternative text for this image may have been generated using AI.Full size imagea, Dose–response curves for the cell viability of parental and BRAFi-resistant WiDr cells treated with dabrafenib (0.1–100 nM), encorafenib (0.1–100 nM) or dHuR-2 (0.01–10 μM) for 6 days. b, Immunoblot of HuR, BRAF and p-ERK levels in Colo205 cells treated with 1 μM dHuR-2 from 3 h to 8 days. HSP70 served as a loading control. c, Colony formation assay of parental and BRAFi-resistant WiDr cells transduced with sgCtrl or sgHuR after 14-day culture (left), and immunoblot confirmation of HUR-KO efficiency (right). d, Relative cell viability of Colo205 cells treated with dabrafenib (0.1−10 nM) ± dHuR-2 (0.1 or 0.3 μM) for 6 days. e, Tumour growth curves of BRAFV600E patient-derived xenograft (PDX) treated with vehicle, dHuR-3 (25 mg kg−1, q.d.), encorafenib (30 mg kg−1, q.d.) or a combination for 25 days. q.d., once daily. n = 6 animals pre group. Data show mean tumour volume ± s.e.m. f, KEGG signature score of the MAPK pathway in Colo205 cells treated for 96 h with DMSO, 1 μM dHuR-2, 3 nM dabrafenib or both. Sequencing was performed for biological duplicates. The boxplots show the median (centre line), interquartile range (box) and full data range (whiskers). Individual data points are overlaid. g, Immunoblot of MAPK pathway components in Colo205 cells treated with 1 μM dHuR-2, 3 nM dabrafenib or both. Vinculin served as a loading control. h, Scatter plot of synthetic lethal genes to dHuR-2. The x axis shows the gene essentiality score shown as log2 fold change (log2FC; DMSO day (D) 12 versus DMSO D0) and the y axis indicates the sensitive score shown as log2FC (dHuR-2 D12 versus DMSO D12). Synthetic lethal genes to dHuR-2 are marked with red dots. i, Colony formation in HT29 cells treated with dHuR-2 (1 μM), gefitinib (3 μM), MEK162 (10 nM) or both for 14 days. j, Diagram illustrating the mechanism of action of dHuRs synergy with BRAFi, EGFRi or MEKi via mediating BRAF exon 18 skipping. Diagram created in BioRender; Wang, X. https://biorender.com/wk9d06q (2026). For gel source data, see Supplementary Fig. 3.Source dataDiscussionCRC remains a notable global health burden, with a high mortality, especially in patients with specific genetic alterations such as BRAF mutations. Approved regimens for these patients often combine BRAF inhibitors with anti-EGFR and other targeted therapies. However, patients with BRAF-mutant CRC still face limited treatment options and rapid drug resistance3, highlighting unmet medical needs. In this study, we identified HuR as a vulnerability in BRAF-mutant CRC and reported on the development of the first-in-class MGDs: dHuR-1 and dHuR-2. The antitumour activities of dHuRs in BRAF-mutant CRC were thoroughly demonstrated through a series of bioinformatics analyses, in vitro cell-based assays and in vivo models. As shown in the diagram of Fig. 5j, we found that HuR degradation disrupted BRAF splicing, suppressed EGFR expression and inhibited VEGFA-mediated angiogenesis, thereby overcoming BRAFi resistance. Among them, HuR degradation disrupts the MAPK pathway by inducing exon 18 skipping in BRAF pre-mRNA, reducing oncogenic BRAF protein levels and downstream ERK phosphorylation. This finding elucidates a previously unrecognized post-transcriptional regulatory mechanism for BRAF, offering a novel therapeutic strategy for BRAF-mutant CRC. The dual inhibition of BRAF and EGFR by HuR degradation underscores its potential to overcome resistance to BRAFis, which often fail due to compensatory MAPK reactivation. These results support the development of dHuRs for the treatment of BRAF-mutated CRC. Although our findings are promising, there are still limitations. As our resistance cell lines used laboratory-induced rather than clinically derived resistant models, potentially oversimplifying the complex resistance mechanisms observed in patients, the effects of HuR degradation will also need to be comprehensively assessed preceding and throughout human clinical investigation.Beyond BRAF, HuR has been reported to regulate a network of oncogenic mRNAs, including VEGF, EGFR and cell cycle regulators, which influence tumour growth, angiogenesis and therapy resistance15,45,48. Our data showed that HuR degradation reduces VEGFA expression, impairing tumour angiogenesis and altering the tumour microenvironment. This pleiotropic effect suggests that HuR degraders could simultaneously target multiple hallmarks of cancer, offering advantages over single-pathway inhibitors. However, we also noted that the target mRNAs of HuR seem to be content dependent. As HuR acts as a sensor of stress, its regulation network might be altered under a stress microenvironment. Future studies should explore the broader transcriptomic and proteomic changes induced by HuR degradation to identify additional therapeutic opportunities and biomarkers of response.Conversely, the development of MGDs targeting the RNA-binding protein HuR represented a notable advancement in targeting undruggable proteins. A recent study49 has discovered two types of dHuRs: one is a CRBN-based proteolysis-targeting chimera (PROTAC) with HuR recruiters conjugated to thalidomide; the other is so-called bivalent glues, which engage both the E3 ligase and HuR through distinct binding sites on a compact scaffold, without necessitating a long linker. The study mentioned that the E3 that engaged with the bivalent glues is RNF165, but supporting data were not found in the article. Another HuR-targeting bioPROTACs (T21RBCC-VHHHuR)50 was used as a tool to evaluate the biology of HuR degradation. However, none of these laboratory tool compounds has been moved forwards into pre-clinical trial due to lacking full characterization or enough potency. Here we have disclosed the classic monovalent glues for HuR, with a distinguished mechanism, which bind to a E3 ligase (CRBN) and reshape its surface to recruit HuR. Dose-dependent degradation and antitumour activities were also demonstrated. In addition, our study elucidated the structural and mechanistic basis of MGD-induced HuR degradation. The cryo-EM structure of the CRBN–MGD–HuR ternary complex revealed critical interactions that stabilize the complex, including the engagement of the G-loop of HuR with CRBN and the hydrophobic ‘glue patch’ formed by dHuR-2. These structural insights provided a potential blueprint for rational design of MGDs targeting HuR, as well as for selectivity improvement.In conclusion, our study established HuR as a compelling therapeutic target in BRAF-mutant CRC, which paved the way for translational applications of dHuRs. Regarding safety assessments, the tool compounds used in this study (dHuR1–3) were determined to be inactive (IC50 > 30 µM) against the hERG ion channel. An exploratory tolerability study was conducted with dHuR-3 in both WT and humanized Crbn-KI mice, the latter of which enabled dHuR-3-induced HuR degradation in vivo. Treating these mice with dHuR-3 at an efficacious dose resulted in minimal body weight reduction despite efficient HuR degradation in multiple organs including the heart, liver, spleen, lung, kidney and brain (Supplementary Fig. 1). Standard toxicity and safety assessments were only conducted for DEG6498, the clinical candidate of HuR MGD from Degron Therapeutics. It has shown an acceptable toxicity and safety profile and has been approved by regulatory agencies for clinical development in advanced solid tumours, with BRAF-mutant tumours included as an expansion cohort (ClinicalTrials.gov NCT07244835).MethodsAny methods and additional references are included in the Supplementary Information.Reporting summaryFurther information on research design is available in the Nature Portfolio Reporting Summary linked to this article.
Molecular glue degraders of HuR suppress BRAF-mutant colorectal cancer - Nature
Molecular glue degraders of the RNA-binding protein HuR have therapeutic potential for BRAF-mutant cancers.
10,923 words~50 min read