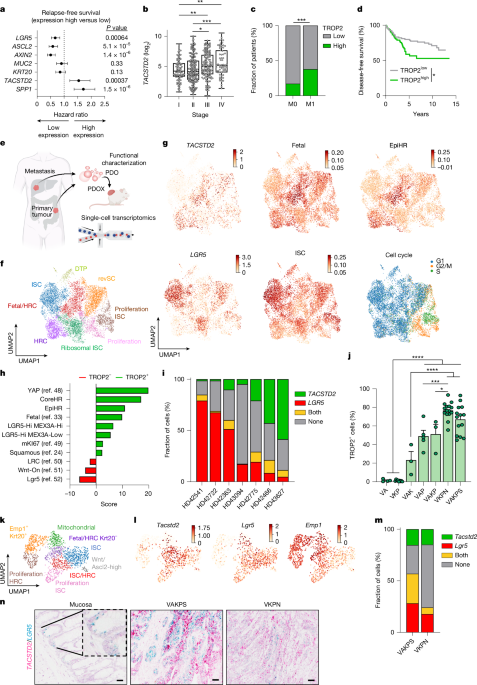
MainColorectal cancer (CRC) is the second leading cause of cancer-associated deaths worldwide. Its high fatality rate is primarily attributable to the presence of disseminated tumour cells at the time of diagnosis and ineffective systemic therapies2. The standard therapeutic intervention for microsatellite-stable CRC, which accounts for around 90% of CRC cases, is a combination of cytostatic agents, such as 5-fluorouracil (5-FU) with either irinotecan (FOLFIRI) or oxaliplatin (FOLFOX). Nevertheless, cellular plasticity seems to be a critical driver of therapy resistance. Furthermore, targeting vascular endothelial growth factor receptor or epidermal growth factor receptor increases clinical efficacy3,4. Approval of these combinatorial treatments was granted more than a decade ago3; however, the 12% 5-year overall survival rate for stage IV patients underscores the unmet need for improved treatment options for patients with advanced CRC5.Poor-prognosis CRC remains a drastic clinical challenge. Molecular characterization revealed that tumours with poor prognosis are particularly characterized by low WNT signalling and belong to the serrated subtype6,7,8. Further transcriptional subtyping approaches uncovered the existence of four consensus molecular subtypes (CMSs)9. Recently, single-cell sequencing refined the CMS into intrinsic CMS (iCMS), which highlighted that iCMS3 confers cancer cells with poor-prognosis features10. Another strategy to subdivide CRC was taken by pathway-derived subtypes (PDSs), in which PDS3 showed the worst prognosis in locally advanced disease11. All these poor-prognosis treatment-refractory subtypes display similarly low WNT-pathway activity. These classifications have not yet entered clinical space in terms of patient stratification or therapeutic approach.Cancer stem cells (CSCs) are cancer cell populations characterized by enhanced self-renewal capacities critical for cancer maintenance, therapy resistance and metastasis12. Derived from adult stem cells in the intestine, LGR5-expressing cells were initially defined as the cell of origin and CSCs in CRC13,14. Depletion of LGR5+ cancer cells revealed cellular plasticity with fast replenishment of the LGR5 CSC pool in a context-dependent manner14,15, driven by mTOR signalling activation16. Depletion of LGR5+ cells in liver metastases led to significant tumour reduction15. Tracing of cellular dynamics in the metastatic cascade by intravital imaging revealed that tumour cells leaving the primary tumour are mostly devoid of LGR5 expression17 while showing activation of YAP signalling18. Similarly, drug-tolerant persister cells regain expression of fetal-like cell markers19,20. Notably, fetal-like cancer cells are detected in many disease-relevant processes that are critical for patient outcomes, such as metastasis, whereas LGR5+ adult intestinal stem cells (ISCs) are absent21. Furthermore, those cells gain expression of L1CAM or EMP1, which also identify populations in a regenerative, MAPK-active or high-relapse cell (HRC) state22,23,24,25,26.Recent years have seen rapidly growing interest in antibody–drug conjugates (ADCs) as a targeted therapeutic strategy across multiple cancer types27,28. Trophoblast cell-surface antigen 2 (TROP2) is a transmembrane glycoprotein originally identified in mouse trophoblasts and encoded by the tumour-associated calcium signal transducer 2 (TACSTD2) gene. Notably, TROP2 has been shown to be abundantly expressed in various carcinomas while remaining absent in most adult tissues29. The description of the TROP2 antigen has sparked high interest in the development of TROP2-directed ADCs. These ADCs, such as the first-in-class product sacituzumab govitecan (SG/Trodelvy) or sacituzumab tirumotecan (Sac-TMT), consist of a humanized anti-TROP2 monoclonal antibody (hRS7) conjugated with topoisomerase inhibitors SN-38 or KL610023 (refs. 30,31). SG has already been granted regular approval for patients with metastatic breast cancer in 2021 (ref. 32). The success of TROP2-targeting ADCs led to the launching of numerous TROP2–ADCs that are in clinical development, ranging from phases I to III in various cancers21.The emergence of distinct cell states during CRC progression and therapy resistance highlights the need to therapeutically target these states. Our profiling of human CRC identified TROP2 as a clinically relevant candidate associated with CRC progression, fetal-like cells and the HRC state. Functional investigations have demonstrated that TROP2 marks tumour cells with enhanced self-renewal capacity in those devoid of WNT signalling. We observed a binary split between LGR5+ and TROP2+ cell states, with notable plasticity between them. Challenging CRCs with chemotherapy enhanced TROP2 expression. By contrast, combination treatment with TROP2-targeting ADCs and chemotherapy showed enhanced efficacy. Taken together, we demonstrate that targeting of specific cell states mediates therapy resistance, which can be overcome with mechanistically informed cell-state-selective combination therapies.TROP2 defines poor-prognosis CRC cellsAggressive CRC has been associated with tumours characterized by low WNT-signalling activity4,7,8. To define highly metastatic and drug-resistant cells in CRC, we analysed the WNT-signalling targets and stem cell markers LGR5, ASCL2 and AXIN2 in publicly available datasets. Expression of these genes was significantly associated with prolonged relapse-free survival (Fig. 1a and Extended Data Fig. 1a). To identify genes associated with shorter relapse-free survival and CRC progression, we next applied a fetal gene signature, which was previously shown to be associated with therapy resistance and enhanced in WNTlow serrated CRC4,7,8,33. We identified two fetal genes highly expressed in CRC and positively correlated with advanced tumour stage: TACSTD2, which encodes TROP2, and SPP1, which encodes osteopontin (Fig. 1a,b and Extended Data Fig. 1b–d). We focused on the analysis of the epithelium-expressed transmembrane protein TROP2, as osteopontin is a protein abundantly expressed in the stromal compartment of CRC (Extended Data Fig. 1e). In a case–control cohort of 246 patients matched according to tumour stage, grading and primary tumour site, we found that TROP2 expression significantly correlated with distant metastasis compared with the control group (37.8% versus 17.1%) (Fig. 1c and Supplementary Table 1). Further, high TROP2 expression correlated with shorter disease-free survival in advanced localized CRCs (Union for International Cancer Control (UICC) stage II, pT3/4) and in 16 publicly available cohorts comprising 1,336 patients with CRC (Fig. 1d, Extended Data Fig. 1f,g and Supplementary Table 2). In line with this, TACSTD2 expression was increased in the poor-prognosis subtypes iCMS3 and PDS3 (refs. 10,11), whereas LGR5 was negatively correlated (Extended Data Fig. 1h,i). To further define TROP2 expression and cancer cell programs, we performed single-cell RNA sequencing (scRNA-seq) on a collection of CRC primary tumours and liver metastases. For functional characterization, we generated patient-derived organoids (PDOs) and PDO xenografts (PDOXs), which were analysed by scRNA-seq (Fig. 1e and Extended Data Fig. 1j). Cell cluster annotation of the epithelial tumour compartment revealed the presence of previously defined clusters, such as revival stem cells (marked by CLU), proliferative and non-proliferative LGR5 ISC clusters and a distinct cluster enriched for MEX3A, which was associated with drug-tolerant persister (DTP) cells. Furthermore, two clusters with increased TACSTD2 expression were identified: one enriched for epithelial HRCs22 and the other for fetal-like cells (fetal/HRC)33 (Fig. 1f and Supplementary Table 3). Although TACSTD2 and EMP1 are expressed in similar clusters, only a small fraction of cells were double-positive (Fig. 1g and Extended Data Fig. 1k,l). Notably, TACSTD2-expressing and LGR5-expressing cells seemed to define two distinct cell populations in our datasets and in public datasets (Fig. 1g–i and Extended Data Fig. 1m,n). Taken together, these data show that TROP2 defines a cell population associated with poor prognosis in human CRC.Fig. 1: TROP2 defines poor-prognosis CRC cells.a, Forest plot showing relapse-free survival of indicated genes in 1,336 patients with CRC from 16 publicly available datasets. b, TACSTD2 expression analysis across stages of human CRC from the The Cancer Genome Atlas Colon Adenocarcinoma (TCGA-COAD) dataset (n = 468). Pairwise comparisons were performed using the Wilcoxon rank-sum test. c, TROP2 expression in a case–control study of non-metastatic (M0) and metastatic (M1) CRC (n = 246). Statistical analysis was performed using Pearson’s χ2 test. d, Kaplan–Meier curve displaying disease-free survival of patients with CRC (UICC stage II, pT3/4) (n = 189). Statistical analysis was performed using the log-rank (Mantel–Cox) test. e, Schematic indicating the strategy of biospecimen generation and subsequent scRNA-seq. f, Uniform manifold approximation and projection (UMAP) of annotated cancer cell states (n = 10,135 cells; seven donors). g, UMAP representation of normalized gene expression levels of gene set scores. Colour scale capped at 99th percentile. h, Enrichment analysis results of public gene sets significantly changing between TROP2+ and TROP2− cells from f using a univariate linear model. i, Tumour composition showing LGR5+ and TROP2+ abundance across donors from f. j, Flow cytometry analysis of TROP2 levels in MDOs (n = 4, 9, 3, 5, 3, 15 and 14). Statistical analysis was performed using ordinary one-way analysis of variance (ANOVA). k, UMAP embedding of annotated mouse epithelial tumour cells (n = 1,573 cells; three mice each for VAKPS and VKPN). l, UMAP representation with marker gene expression from k. Colour scale capped at 99th percentile. m, Tumour composition showing LGR5+ and TROP2+ abundance across GEMMs from k. n, In situ hybridization of normal or tumour tissue from GEMMs. Scale bar, 50 µm (n). *P < 0.05, **P < 0.01, ***P < 0.001, ****P < 0.0001. Schematic in e created in BioRender; Jackstadt, R. https://biorender.com/x995kgp (2026).We generated an array of genetically engineered mouse models (GEMMs) that define progression to CRC through either the classical route or the serrated route7. These models represent an excellent toolbox to investigate the stepwise progression towards advanced CRC. Consequently, we profiled the expression of TROP2 in genetically defined mouse-derived organoids (MDOs). In these MDOs ranging from benign models (Villin1–CreER Apcfl/fl, Villin1–CreER Apcfl/fl Trp53fl/fl, Villin1–CreER Apcfl/fl KrasG12D/+) to invasive adenocarcinoma models (Villin1–CreER Apcfl/+ KrasG12D/+ Trp53fl/fl (VAKP), Villin1–CreER KrasG12D/+ Trp53fl/fl (VKP)) to highly metastatic adenocarcinoma models (Villin1–CreER Apcfl/+ KrasG12D/+ Trp53fl/fl Smad4fl/fl (VAKPS), Villin1–CreER KrasG12D/+ Trp53fl/fl Rosa26N1icd/+ (VKPN)), we found higher TROP2 levels with increased oncogenic burden (Fig. 1j and Extended Data Fig. 2a). By contrast, Lgr5 or fetal-like markers, such as Ly6a or Anxa1, did not follow this stepwise increase (Extended Data Fig. 2a). In line with increased TROP2 expression, we also detected increased seeding capacities of single cells and organoid sizes (Extended Data Fig. 2b,c). Single-cell transcriptomics of tumours from the metastatic models VKPN and VAKPS confirmed the existence of independent Tacstd2+, Lgr5+ or Emp1+ cells and the association of Tacstd2 expression with fetal-like cells (Fig. 1k–n and Extended Data Fig. 2d–g). Together, we identified TROP2 as a marker of poor-prognosis cell states in human and mouse CRCs.TROP2 marks CSCs of WNTlow CRCNext, we sought to investigate the functional role of TROP2+ cells in cancer stemness, a feature inherently associated with poor prognosis. Thus, we separated TROP2− and TROP2+ (top 20%) cell populations and seeded them in vitro (Fig. 2a). In the aforementioned MDOs at various stages and in PDOs, TROP2+ cells demonstrated increased clonogenic capacity (Fig. 2b–d and Extended Data Fig. 3a–f). Notably, after 7 days in culture, organoids derived from TROP2− or TROP2+ sorted populations displayed similar TROP2 levels, indicating a high degree of plasticity (Fig. 2e). PDOs with a reduced number of TROP2+ cells (HD42541) did not show significantly increased seeding capacity of TROP2+ cells in vitro (Fig. 2d). By contrast, when we labelled these PDOs with a WNT/LGR5 reporter (STAR)34, LGR5/WNThi cells showed increased seeding efficacy (Fig. 2f and Extended Data Fig. 3g,h). Next, we assessed the tumour-initiating capacities of TROP2 cells in vivo. To that end, we separated TROP2− and TROP2+ tumour cells from MDOs or PDOs with low (HD42466/VKPN) and high (HD42541/VAKPS) WNT/LGR5 expression, followed by transplantation at serial dilutions. In the WNThi models, TROP2+ cells did not exhibit increased tumour-initiating capacities after transplantation, whereas in the WNTlow models TROP2+ cells displayed enhanced tumour-initiating capacity (Fig. 2g,h and Extended Data Fig. 3i–l). In both tumour types, high cellular plasticity led to a restoration of the TROP2+ cell pools over time (Extended Data Fig. 3m,n). These results highlight enhanced plasticity in CRC cells and suggest a potential dependency on the TROP2+ cell pool replenishment.Fig. 2: TROP2 marks CSCs of WNTlow CRC.a, Scheme of TROP2 cell population separation. b, Clonogenicity 5 days after seeding (n = 13, 15, 27 and 30 individual wells of up to five independent fluorescence-activated cell sorting (FACS) experiments). c, Images of organoid formation assays from b. d, Clonogenicity of PDO lines 10 days after seeding (HD42466, n = 8; HD42541, n = 8 individual wells of up to three independent FACS experiments). e, Histogram of TROP2− and TROP2+ cells after seeding. Parental cell lines served as a negative control. f, Clonogenicity of PDO lines 10 days after seeding (HD42541, n = 8 individual wells from three independent FACS experiments). Right, images from organoid formation assays. g, In vivo limiting dilution assay (LDA) with TROP2− or TROP2+ cells from HD42466 (n = 6 injections per dilution per group). Y axis represents the natural logarithm (ln) of tumour-free fraction. Stem cell frequency: 1 in 7,807 TROP2+ cells and 1 in 21,421 TROP2− cells. h, In vivo LDA with TROP2− or TROP2+ and STAR+ or STAR− cells from HD42541 (n = 6 injections per dilution per group). Y axis represents the ln of tumour-free fraction. Stem cell frequency: 1 in 291,712 TROP2+ cells, 1 in 276,161 TROP2− cells, 1 in 102,671 LGR5+ cells and undetectable in LGR5− cells. i, Scheme of the tdTomato knock-in and FACS separation. j, Seeding efficiency of LGR5–tdTomato+ and LGR5–tdTomato− cells 5 days after seeding (n = 15, 15 and 10 individual wells from three independent FACS experiments). k, Representative images of organoid formation assays from j 5 days after seeding. l, Histogram of the tdTomato signal 7 days after seeding; organoids derived from tdTomato− and tdTomato+ cells. Parental cell lines served as a negative control. m, Dot plot of LGR5–tdTomato levels in CD45−CD31−EPCAM+ cells. n, tdTomato+ cell abundance across genotypes. Statistical analysis was performed using ordinary one-way ANOVA. o–q, Kaplan–Meier plots of genotypes (n = 6 mice per group) for VAKPS (o), VKPN (p) and VAKPN (q). Statistical analysis was performed using the log-rank (Mantel–Cox) test. In b, d, f and j, statistical analysis was performed using unpaired t-test. In g and h, statistical analysis was performed using a likelihood-ratio test. NS, nonsignificant. Scale bars, 100 µm (c,k), 1,000 µm (f). Schematics created in BioRender: a, Jackstadt, R. https://biorender.com/0xjr0wt (2026); i, Jackstadt, R. https://biorender.com/uzzv89x (2026).To define the stem cell capacity of LGR5-expressing cells in our CRC models, we knocked-in a tdTomato fluorescent reporter after the STOP codon of the Lgr5 gene in VAKPS and VKPN MDOs (Fig. 2i and Extended Data Fig. 4a–e). Quantitative polymerase chain reaction (PCR) of isolated tdTomato− and tdTomatohi cells confirmed higher expression of tdTomato and Lgr5 in tdTomatohi cells, indicating selective labelling of Lgr5+ cells by tdTomato in hereafter called VAKPSLT and VKPNLT MDOs (Extended Data Fig. 4f,g). Separation of tdTomato− and tdTomato+ (top 20%) cells revealed increased clonogenic potential in tdTomato+ VAKPSLT cells. However, this difference was not detectable in WNTlow VKPNLT MDOs (Fig. 2j,k). Querying whether this effect was WNT-dependent, we used CRISPR–Cas9 gene editing to delete Apc in VKPNLT MDOs, hereafter VAKPNLT MDOs. These MDOs showed significantly higher tdTomato and WNT-target gene expression compared with VKPNLT MDOs (Extended Data Fig. 4h–o). The clonogenicity of tdTomato+ compared with tdTomato− cells was also increased in VAKPNLT MDOs (Fig. 2j,k and Extended Data Fig. 4p). Notably, the LGR5 population was quickly restored when plating tdTomato− cells (Fig. 2l).To further explore the stemness properties of the LGR5+ tumour cells in vivo, we separated the tdTomato− and tdTomato+ tumour cells from subcutaneous tumours and transplanted them in the flank of secondary recipient mice (Fig. 2m–q). Similar to the in vitro data, tdTomato+ cells had higher tumour-initiating capacities than the tdTomato− cells but only in Apc-deficient tumours (Fig. 2o–q). These findings suggest that LGR5 marks CSCs primarily in WNT-high (Apc-deficient) CRCs, whereas TROP2+ cells have stem-like tumour-initiating capacity in low WNT-signalling (Apc-proficient) CRCs.TROP2 defines metastasis-initiating cellsMetastasis-initiating cells (MICs) and micro-metastases represent a highly patient-relevant stage in CRC progression. Although loss of LGR5 was already observed at the tumour invasion front, a fetal-like state has been described as being critical for metastatic progression17,24. To define the relevance of TROP2+ cells in metastatic colonization and to interrogate the functional plasticity between cell states, we analysed the expression of TROP2 across metastatic stages ranging from micro-metastasis to small metastasis and macro-metastasis22 (Extended Data Fig. 5a–c). We detected LGR5 expression in larger lesions, whereas TROP2 was already present at the initial event of metastatic seeding (Extended Data Fig. 5a–g). To test the relevance of TROP2+ cells during metastasis formation, we separated tumour cells according to their TROP2 and LGR5 levels from VAKPSLT and VKPNLT tumours (Extended Data Fig. 5h). In a metastatic seeding assay, LGR5+ sorted cells of VAKPSLT tumours had a significantly higher metastatic capacity than the LGR5− cells (Extended Data Fig. 5h–k). Nevertheless, when we compared the potential of LGR5+/TROP2− and LGR5+/TROP2+ cells to generate macro-metastases, double-positive cells formed significantly more metastases (Extended Data Fig. 5h–k). Furthermore, when we assessed the metastatic capacity of LGR5− cells, previously defined as MICs17, we detected a significant increase in metastatic efficacy for TROP2+ cells (Extended Data Fig. 5i–l). In VKPNLT MDOs, both TROP2+ sorted cell populations had significantly higher metastatic capacity than the TROP2− cell populations regardless of LGR5 levels (Extended Data Fig. 5m–o), in line with their increased seeding efficiency in vitro. Together, TROP2+ cells have a higher metastatic capacity than TROP2− cells in both VAKPS and VKPN models. Additionally, all generated metastases swiftly restored a balanced cell-state equilibrium, demonstrating high plasticity of CRC cells (Extended Data Fig. 5l,p).TROP2 targeting and cell state remodellingOur results show that TROP2-expressing cells are associated with tumour cell populations linked to poor clinical outcomes. Hence, targeting these cells bears high clinical relevance. In recent years, the use of TROP2-targeting ADCs, such as SG, has shown striking efficacy and clinical success in triple-negative breast cancer35. Hence, we aimed to target TROP2-expressing cells in CRC. We used our biobank of patient-derived CRC samples, which showed heterogeneous TROP2 expression (Fig. 3a). PDOs and PDOXs generated from these samples recapitulated the expression and membranous localization of TROP2 found in primary tissue (Fig. 3a). Treatment of established PDOXs with SG highlighted a TROP2 expression-dependent survival benefit (Fig. 3b–e). This benefit was accompanied by reduction of TROP2 cell-surface protein levels (Fig. 3f,g and Extended Data Fig. 6a). Next, we considered that TROP2+ cell targeting might remodel the cellular state composition of tumours. Single-cell transcriptomics of SG-treated and vehicle-treated PDOX tumours revealed the existence of nine epithelial clusters (Fig. 3h). As previously detected, we identified a composition of ISCs (marked by LGR5), revival stem cells (marked by CLU), fetal-like cells (marked by TACSTD2) or HRCs (marked by EMP1) (Fig. 3h,i). Further analysis showed that SG treatment was linked to a marked reduction in HRC-like and fetal-like signatures and increased ISC/LGR5 signatures (Fig. 3j–l and Extended Data Figs. 6b,c and 7a). To resolve the temporal dynamics of this, we next analysed PDOs of an in vivo treatment time-course experiment (Fig. 3m). A single dose of SG led to a clear change in cell-state composition during the first 48 h, leading to an upregulation of the LGR5 program at the expense of TROP2+ and fetal-like cells (Fig. 3n–q and Extended Data Fig. 7b–d). Trajectory inference with Palantir further shows a shift from a TROP2hi state towards an ISC-like LGR5 cell state during SG treatment (Fig. 3r and Extended Data Fig. 7e,f). This cell state shift was reversible when the drug effect waned36,37 (Extended Data Fig. 7g–o). To validate this further, we used an in vitro time course of drug treatment followed by drug washout using both SG and an untargeted ADC control with identical payload IgG1–SN-38. SG treatment showed an upregulation of the WNT program under treatment, followed by pronounced reappearance of HRC-like, non-canonical-like and fetal-like programs upon drug release (Extended Data Fig. 7p). This plastic change in gene expression programs was not observed with the untargeted ADC, which instead presented mainly with the emergence of LGR5 signatures upon drug release. This provides compelling evidence for TROP2-targeted SG treatment dynamics. Together, we demonstrate that targeting TROP2+ cells causes a state remodelling towards ISC states.Fig. 3: Targeting TROP2 remodels cancer cell states.a, Immunohistochemistry of TROP2 in patient samples, PDOs and PDOXs. b, Scheme indicating the treatment regimen with vehicle or SG. c–e, Kaplan–Meier plots of survival of TROP2hi (HD42466, n = 6 and 6) (c), TROP2medium (HD42541, n = 4 and 5) (d) and TROP2low (HD43094, n = 6 and 6) (e) PDOXs after treatment with SG, as shown in b. Statistical analysis was performed using the log-rank (Mantel–Cox) test. f, Representative flow cytometry histogram of TROP2 levels after SG treatment in PDOXs (c–e). g, Abundance of TROP2+ cells upon SG treatment in TROP2hi (n = 6 and 6), TROP2medium (n = 3 and 3) and TROP2low (n = 3 and 3) PDOXs (c–e). Statistical analysis was performed using unpaired t-test. h, UMAP embedding with annotated tumour cell states after treatment of HD42466 PDOXs with vehicle or SG from c (n = 7,330 cells; four tumours per treatment). i, UMAP representation of marker gene expression levels. Colour scale up to 99th percentile. j, UMAP as shown in h (matching colours) split by treatment condition. k, UMAP showing clusters increasing or decreasing upon treatment with SG. l, Violin plots of gene set scores stratified by cluster-based treatment response shown in k with dashed lines indicating quartiles. Distributions were compared using a Wilcoxon rank-sum test with Benjamini–Hochberg correction for multiple testing. m, Scheme of in vivo SG metastasis treatment and sampling time points. n, UMAP representation of data in m showing TACSTD2 imputed expression values (up to 99.5th percentile) and ISC LGR5 gene set score (n = 11,385 cells; one to two mice per time point). o, UMAP colour-coded by time point. p, UMAP colour-coded cluster size differences between 0 h and 48 h time point. q, Violin plot showing gene set score changes over time with dashed lines indicating quartiles. Distributions were compared using a Wilcoxon rank-sum test with Benjamini–Hochberg correction for multiple testing. r, Normalized gene expression changes (min–max scaled) along pseudotime of main Palantir trajectory. N, normal; T, tumour. Scale bar, 100 µm (a). Schematics created in BioRender: a, Jackstadt, R. https://biorender.com/umdaj9r (2026); b, Jackstadt, R. https://biorender.com/3w435x2 (2026); m, Jackstadt, R. https://biorender.com/29u0lf3 (2026).Chemotherapy-induced TROP2 and plasticityNext, we sought to define mechanisms that may drive TROP2 expression in a setting that is clinically relevant with the goal of optimizing TROP2-targeting therapies to benefit a wider spectrum of patients. Previous reports demonstrate that fetal-like progenitor signatures are induced upon chemotherapy treatment19,20,24,38. When we treated various PDOs with FOLFIRI, we observed an induction of TROP2 expression, independent of baseline TROP2 levels in all models (Fig. 4a–f and Extended Data Fig. 8a–c). Even in tumours in which every cell expressed TROP2 at baseline, we found significantly enhanced TROP2 surface levels upon FOLFIRI exposure (Fig. 4d and Extended Data Fig. 8a). TROP2 induction was also detected upon FOLFIRI exposure of VAKP MDOs in vitro and in vivo (Extended Data Fig. 8d–f). This induction was reverted 96 h after drug withdrawal, indicating a high degree of plasticity (Extended Data Fig. 8g). Notably, the same FOLFIRI treatment of mouse or human normal tissue organoids and of mouse colon tissue in vivo did not show TROP2 induction (Extended Data Fig. 8h–m).Fig. 4: Chemotherapy-induced TROP2 and plasticity.a–c, Quantitative PCR results of PDOs treated with vehicle or FOLFIRI for 96 h for lines HD42466 (a, n = 3), HD42722 (b, n = 3) and HD43094 (c, n = 3). d, Quantification of TROP2 mean intensity in different PDOs treated with vehicle or FOLFIRI for 96 h. e, Representative flow cytometry dot plots from d. f, Immunohistochemistry of TROP2 from PDOXs treated with vehicle or FOLFIRI for 4 days. g, Scheme indicating recombination after 4-OHT application. h, Illustration of the lineage-tracing approach in TcT–AKP MDO liver metastasis. i, Quantification of tdTomato-labelled clone size as described in h (n = 5–6 mice per condition; n = 18, 19, 44, 65, 26, 50, 33, 49, 26 and 28 analysed clones). j, Representative image of tdTomato-labelled clones in liver metastasis. k, Schematic indicating the treatment regimen of PDOs (HD43478) with FOLFIRI. l, UMAP representing the time points of treatment and release (n = 1,173 cells; one replicate per time point). m, UMAP representing the Palantir pseudotime. n, UMAP representing the imputed expression levels of TACSTD2. o, Violin plots of imputed TACSTD2 expression levels over time. p, UMAP representing the imputed expression levels of LGR5. q, Violin plots of imputed LGR5 expression over time. r,s Treatment (r) and release trajectory (s) on entropy UMAP. t, TACSTD2 expression over pseudotime along trajectories (r,s). u, LGR5 expression over pseudotime along trajectories (r,s). In a–d, statistical analysis was performed using unpaired t-tests. Veh., vehicle. Scale bars, 50 µm (f), 100 µm (j). Schematics created in BioRender: g, Jackstadt, R. https://biorender.com/vqdkg63 (2026); h, Jackstadt, R. https://biorender.com/8psxkns (2026); k, Jackstadt, R. https://biorender.com/3w435x2 (2026).To define whether TROP2 expression is induced upon chemotherapy or whether TROP2-expressing cells were selectively enriched, we generated a Tacstd2CreER allele by introducing a CreER open reading frame in the 5′ untranslated region (5′UTR) of the Tacstd2 gene linked with a T2A site (Extended Data Fig. 8n–p). We introduced the Tacstd2CreER allele to LSL–tdTomato mice (TcT). Functional validation of the allele showed that only skin, in which TROP2 is expressed under homeostatic conditions, led to tdTomato labelling after tamoxifen injection, whereas small intestine, colon, liver and pancreas remained negative (Extended Data Fig. 8q,r). Additionally, we generated normal intestine-derived organoids and assessed the tdTomato labelling after 4-hydroxy-tamoxifen (4-OHT) addition (Extended Data Fig. 8s–u). After 10 days, the TcT allele did not show any tdTomato-labelled cells, whereas Lgr5GFP-CreER Rosa26LSL-tdTomato small intestinal organoids (LcT) showed efficient labelling (Extended Data Fig. 8u), demonstrating the lack of TROP2 expression in normal tissues.To transform these organoids, we used CRISPR–Cas9-mediated gene editing to knockout Apc and Trp53 (TcT–AP) and introduced the most prevalent Kras (G12D) mutation in CRC (TcT–AKP) (Extended Data Fig. 9a–e). We next characterized the response of TcT–AP and TcT–AKP MDOs to FOLFIRI treatment. This treatment induced TROP2 expression on mRNA and protein levels in both genotypes, along with the fetal-like markers Krt7 and Anxa1 (Extended Data Fig. 9f–i). By contrast, Lgr5 expression was reduced (Extended Data Fig. 9f,g). To test whether FOLFIRI treatment leads to a persister cell selection, we injected the generated TcT–AKP MDOs intrasplenically and lineage-traced the clonal expansion in the emerging liver metastases (Fig. 4g–j and Extended Data Fig. 9j–m). Longitudinal analysis of the tdTomato clones in vitro and in vivo revealed no apparent differences between treatment groups (Fig. 4i and Extended Data Fig. 9m), suggesting an upregulation of TROP2 levels by chemotherapy. To dissect the dynamics of the transcriptional cell state remodelling, we performed longitudinal treatment analysis in PDOs (Fig. 4k,l and Extended Data Fig. 10a,b). We detected a time-dependent increase in TROP2 protein and mRNA, along with downregulation of LGR5 (Fig. 4m–q and Extended Data Fig. 10c–l). Trajectory inference and pseudotime analysis suggests a FOLFIRI-induced increase of the TROP2hi state, whereas drug release uncovers a reversion to a LGR5/WNThi cell state (Fig. 4r–u and Extended Data Fig. 10k,l). In sum, we show that chemotherapy induces TROP2 expression, accompanied by a therapy-associated change in tumour cell states.Combination therapy enhances efficacyWe demonstrate that chemotherapy induces TROP2 expression, consistent with a therapy-induced cell state associated with resistance. Thus, we propose that combinatorial treatment with chemotherapy and SG might enhance therapeutic efficacy. To test this, we used a range of PDOs that expressed TROP2 at different basal abundance. FOLFIRI or FOLFOX treatment significantly enhanced TROP2 expression (Extended Data Fig. 11a–i). Both SG monotherapy and combination therapy resulted in a significant reduction of surface TROP2-expressing cells (Extended Data Fig. 11a–e). Upon transplantation of PDOs, we detected significantly increased survival of mice treated with FOLFOX and SG in comparison to each monotherapy (Extended Data Fig. 12a,b). Treatment of early metastasis versus established macro-metastasis revealed a TROP2-expression-dependent efficacy with strong effects on the TROP2hi cells (Fig. 5a,b and Extended Data Fig. 12c,d). Combinatorial treatment of either early or established metastasis resulted in reduced bioluminescence signal in TROP2low cells (Fig. 5c,d). Similarly, when we combined monotherapy or combinatorial standard-of-care chemotherapy with Sac-TMT, we observed delayed tumour outgrowth with no toxicity detected (Fig. 5e and Extended Data Fig. 12e–h). These data suggest that combination treatment with these drugs enhances tumour cell killing. In sum, these findings support a model in which LGR5+ and TROP2+ tumour cell populations co-exist in distinct states. Chemotherapy preferentially targets LGR5+ cells and induces TROP2 expression, resulting in a shift in tumour cell state. This creates an opportunity for directed targeting of TROP2+ cells. Our data support a therapeutic strategy in which chemotherapy combined with TROP2+ cell targeting enhances efficacy through cell-state-specific tumour cell killing (Fig. 5f).Fig. 5: Combined chemotherapy and TROP2 targeting in CRC.a, Bioluminescence measurements of indicated treatments started at early time points and HD42466 metastasis quantification (n = 5, 6, 6 and 6). BLI, bioluminescence imaging. b, Bioluminescence measurements of indicated treatments started at late time points and HD42466 metastasis quantification (n = 6, 6, 6 and 6). c, Bioluminescence measurements of indicated treatments started at early time points and HD42541 metastasis quantification (n = 6, 6, 6 and 6). d, Bioluminescence measurements of indicated treatments started at late time points and HD42541 metastasis quantification (n = 6, 6, 6 and 6). e, Schematic indicating the in vivo treatment regimen starting at HD43627 tumour size of 50 m3 for 28 days followed by tumour growth monitoring (n = 6, 6, 6, 6, 6 and 5). f, Summary of the key findings from this study, demonstrating cell-state-dependent CSC properties of CRC and therapy-induced cell state transitioning between WNThiLGR5+ and WNTlowTROP2+ cells as a mechanism of resistance. The experimental end point in a–d was on the last day of treatment as stated in the corresponding scheme. Schematics created in BioRender: a–d, Jackstadt, R. https://biorender.com/5t4xy1a (2026); e, Jackstadt, R. https://biorender.com/3w435x2 (2026); f, Jackstadt, R. https://biorender.com/wi6om3c (2026).Source dataDiscussionBy defining the cellular composition of CRC, we identified the cell surface receptor TROP2 as a marker of poor prognosis. Our data support a scenario in which TROP2 is a combined marker for both fetal and HRC populations, which have been associated with therapy resistance and metastasis. We define a therapeutic strategy to target TROP2-expressing cells using TROP2-directed ADCs. In addition to efficient tumour cell killing, we found that ADCs shape cellular states in the cancer cell continuum, resulting in increased ISC states. Targeting TROP2+ cells in combination with standard-of-care chemotherapy shows that TROP2 induction by chemotherapy enhances therapeutic efficacy.Transcriptional analysis indicates that TROP2 and LGR5 mark distinct cellular populations. Notably, TROP2+ cells exhibit CSC properties in WNTlow and LGR5low CRCs, supporting the notion that TROP2 marks an alternative CSC pool when LGR5+ cells are absent or depleted. In line with previous results in a lineage depletion assay39, our data show that LGR5+ cells have no bona fide CSC properties in serrated CRC. WNT activation through Apc deletion rescued this phenotype. This observation aligns with previously reported increased expression of fetal-like markers in serrated adenoma40,41. Tumour induction of APC-mutant tubular adenomas occurs through WNT-driven stem cell expansion, whereas serrated adenomas arise from differentiated cells undergoing gastric metaplasia40. Whether this dichotomy defines TROP2-expressing cells as the cell of origin of serrated adenoma warrants further investigations. Nonetheless, TROP2 expression as part of the fetal-like wound repair program in the intestine42,43 suggests its potential role in inflammation-driven CRC initiation. Further, our functional analysis of metastasis demonstrates that TROP2 labels MICs independently of WNT-signalling conditions, suggesting that cellular states and dynamics are different between MICs and CSCs.CRC metastasis and therapy resistance have recently been associated with fetal-like/wound-repair progenitor cell states in CRC24,44,45. In addition, HRCs were critical for the metastatic relapse of CRC22. We found that in human and mouse CRCs, TROP2 marks cells of both of these highly detrimental cellular populations. This distinguishes TROP2 from previously described markers and makes it an excellent target for therapeutic interventions.Resistance to ADCs can be mediated by reduced or absent target epitope expression46. Consistent with this, our data show that the efficacy of TROP2-directed ADCs depends on TROP2 expression levels. In addition, we demonstrate that ADC-mediated cell-state changes within tumours represent a previously unrecognized therapy resistance mechanism. This is relevant for clinical application and demonstrates the importance of companion diagnostics, particularly in CRC. The shift of cellular populations towards the ISC LGR5+ state suggests that cell-state-specific targeting is a critical step in overcoming treatment resistance in CRC. We show that the previously recognized equilibrium of cell polarization in CRC47 can be exploited to target cellular states along this continuum and that chemotherapy-induced TROP2 expression provides a clinically relevant avenue for future investigation.MethodsClinical cohortsAll patients in the M0/M1 case–control cohort were diagnosed with colorectal adenocarcinoma at the Institute of Pathology, Faculty of Medicine, LMU Munich, and were subsequently identified through a systematic database search in collaboration with the Munich Cancer Registry. Patients in the M1 group were histologically or radiologically diagnosed with local recurrence or distant metastasis to any site within a 5-year observation period after resection of a colorectal adenocarcinoma. To build the M0 group, a patient who did not progress within the same time frame was pair-matched to each M1 patient according to sex, age, disease stage, tumour grade and primary tumour site. Available patient and tumour characteristics, as well as survival data, were collected. Patients with secondary malignancies were excluded. The availability of sufficient analysable tumour tissue limited patient numbers to 82 per group. Clinicopathological details are listed in Supplementary Table 1. For the UICC stage II cohort, anonymized CRC specimens from patients who underwent surgical resection at LMU Munich between 1994 and 2017 were obtained from the archives of the Institute of Pathology LMU. Follow-up data were recorded prospectively by the Munich Cancer Registry. Specimens were anonymized. Clinicopathological details are listed in Supplementary Table 2. The studies were approved by the Institutional Ethics Committee of the Medical Faculty of the LMU (approval no. 18-105-UE) and carried out according to the Declaration of Helsinki. For both cohorts, TROP2 expression was detected on 4-µm-thick formalin-fixed paraffin-embedded sections using anti-TROP2 antibody (Abcam; ab227691; clone SP295) at a 1:100 dilution on a Ventana BenchMark ULTRA autostainer instrument. Normal human tonsil epithelia were included as positive controls in each staining run.PDOs and tissues were established from tumours or normal mucosa obtained at the University Hospital Heidelberg (ethical approval nos. S-136/2021 and S-871/2021), in accordance with ethical guidelines and regulations. All patients provided written informed consent. Clinical features and genetic driver mutations (identified by whole-exome sequencing) are provided in Supplementary Table 4.Kaplan–Meier plots of disease-free survival and relapse-free survival hazard ratios in 1,336 patients with CRC from 16 publicly available datasets were generated using the Kaplan–Meier Plotter tool (https://kmplot.com/analysis/). The automatic best cut-off was used, incorporating data from a previous study53. Results shown in Extended Data Fig. 1h,i were generated using SubtypeExploreR (https://subtypeexplorer.qub.ac.uk/).Animal experimentsAll mouse experiments were approved by the local authorities of Regierungspraesidium Karlsruhe under animal protocols G-148-20, G-27-22, G-159-22 and G-164-22. Tumour growth was monitored regularly, and mice were euthanized when tumours reached the maximum permitted tumour size or when humane end point criteria were met. These limits were defined in accordance with the approved animal protocols and were not exceeded in any of the experiments. The mice were housed at the DKFZ animal facilities in accordance with the local and latest standards with a 12 h dark and light cycle, a constant temperature (20–24 °C) and humidity (45–65%). They were provided with a rodent-specific diet and water ad libitum.
TROP2 targeting reveals therapy-driven cell state dynamics in colorectal cancer - Nature
TROP2 marks poor-prognosis colorectal cancer cells with fetal-like, therapy-resistant states, and therapeutic targeting of TROP2 with antibody–drug conjugates in combination with chemotherapy enhances treatment efficacy by modulating tumour cell plasticity and overcoming resistance.
16,984 words~77 min read