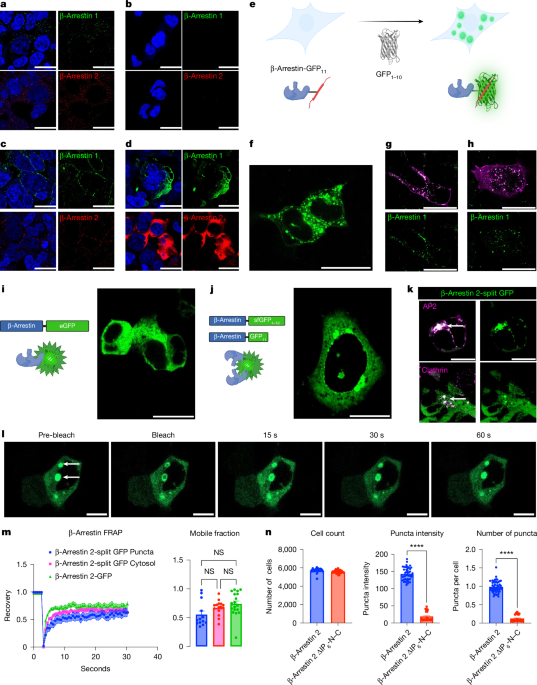
MainAfter agonist stimulation, GPCRs activate heterotrimeric G proteins, which promote signalling through second messengers, followed by the recruitment of GPCR kinases (GRKs) and β-arrestins. Receptor phosphorylation by GRKs promotes associations with β-arrestins, which regulate GPCR desensitization, signalling and trafficking. β-Arrestins perform these multiple tasks by sterically preventing G protein activation and by acting as scaffolding proteins for the endocytic machinery and signalling molecules (for example, Raf-1, MEK1 and ERK)3,4, interacting with hundreds of proteins5. Furthermore, β-arrestins can be catalytically activated by GPCRs, followed by translocation to the plasma membrane and clathrin-coated pits (CCPs)6. β-Arrestins interact with the receptor through finger loop insertion into the receptor core and/or through binding of their N-domain to the phosphorylated receptor C terminus7,8,9. This results in the release of the β-arrestin C-tail intrinsically disordered region (IDR) from the N domain, and promotes the active conformation of β-arrestin10 characterized by interdomain twisting between the N and C domains11,12. β-Arrestins are regulated by their cellular environment through binding to specific components; for example, inositol hexaphosphate (IP6) promotes the oligomerization of β-arrestin 1 into infinite chains8 and the oligomerization of β-arrestin 2 into trimers with a conformation that is similar to β-arrestin 1 (refs. 13,14,15,16) in complex with a GPCR8,17. β-Arrestins can homo- and hetero-oligomerize18, and ablation of IP6 binding sites results in dysregulation of β-arrestin nucleocytoplasmic shuttling, signalling and protein–protein interactions19,20. However, the biological significance of β-arrestin oligomerization and whether it promotes compartmentalization of receptor signalling is unclear.One mechanism that contributes to signalling compartmentalization by other receptor families is the formation of biomolecular condensates21,22. Biomolecular condensates are enriched with molecules that can engage in multivalent interactions through specific oligomerization motifs and IDRs23,24. These interactions reduce molecular solubility due to entropy-driven effects and promote liquid–liquid phase separation (LLPS) to produce condensates21. These condensates partition reactants to increase their local concentration and sequester signalling components22,25,26. Condensates have been described at membrane receptors such as receptor tyrosine kinases and T cell receptors26,27, in addition to their downstream effectors, such as PKA and WNK25,28. Notably, β-arrestins 1 and 2 have a C-terminal IDR and undergo oligomerization, features that are found in macromolecules enriched in biomolecular condensates.Here we demonstrate the formation of β-arrestin condensates to regulate GPCR activity. Upon GPCR activation, we demonstrate β-arrestin oligomerization that displays an orientation dependence. Finally, we demonstrate that mutations of the IDR and residues predicted to promote oligomerization alter the ability of β-arrestins to regulate GPCR signalling and internalization.The presence of endogenous β-arrestin condensatesWhen overexpressed, β-arrestin-GFP is observed in a diffuse cytosolic pattern; after agonist stimulation, β-arrestin-GFP is recruited to the plasma membrane29. To evaluate the pattern of endogenous β-arrestin expression, we used super-resolution microscopy and immunofluorescence with antibodies targeting both β-arrestins 1 and 2. In HEK293T cells, we visualized β-arrestins 1 and 2 in puncta throughout the cytosol (Fig. 1a). We validated antibody selectivity using β-arrestin 1–2 knockout (KO) cells, which had little to no observable signal (Fig. 1b). Next we assessed whether these puncta would change upon agonist stimulation. In HEK293T cells, angiotensin II (AngII) type 1 receptor (AT1R) was transfected and stimulated with AngII for 5 min. Indeed, both β-arrestin 1 and 2 puncta were largely localized to the plasma membrane (Fig. 1c). Fluorescently labelled receptors—β2 adrenergic receptor (β2AR), vasopressin receptor 2 (V2R) and AT1R—that were stimulated with their respective ligands showed β-arrestin puncta localization with receptors, although there were still puncta present in the cytosol (Extended Data Fig. 1a). We then performed immunofluorescence of overexpressed β-arrestins 1 and 2. We transfected 500 ng of untagged β-arrestin in HEK293T and, using immunofluorescence, we observed a diffuse cytosolic pattern (Fig. 1d), analogous to the diffuse cytosolic pattern observed for overexpressed β-arrestin-GFP. Overall, these findings highlight that endogenous β-arrestin puncta are recruited to the receptor and that overexpression of β-arrestin results in a diffuse cytosolic pattern.Fig. 1: β-Arrestins form condensates at endogenous and overexpressed levels of expression.The alternative text for this image may have been generated using AI.Full size imagea, HEK293T cells were fixed with 4% paraformaldehyde and immunofluorescence was performed for β-arrestin 1 or 2. b, Immunofluorescence for β-arrestins 1 and 2 on β-arrestin 1–2 KO cells. c, HEK293T cells were transfected with AT1R and stimulated with AngII (1 µM) for 5 min, fixed, and then β-arrestins 1 and 2 were subjected to immunofluorescence. d, HEK293T cells were transfected with 500 ng of either β-arrestin 1 or 2, which was then subjected to immunofluorescence. e, Schematic of endogenous β-arrestin CRISPR cell line. f, Representative image of CRISPR β-arrestin 1 puncta (GFP11 + GFP1–10). g,h, CRISPR β-arrestin 1 cells were transfected with either β2AR-mKO (g) or V2R-mKO (h) and stimulated with either isoproterenol (10 µM) or AVP (1 µM), respectively. i, Diffuse cytosolic β-arrestin 2-eGFP expression in HEK293T cells transfected with a β-arrestin 2 with eGFP fused to the C terminus. j, β-arrestin 2 was fused with the 11th β-strand of GFP, or the remaining β-strands of sfGFP1–10, on the C-terminus. k, Cells were transfected with β-arrestin-2-split GFP, AP2-mKO (β-subunit) or clathrin-mKO, and were stained with DAPI. l, FRAP was performed on β-arrestin 2-split GFP puncta. m, FRAP on β-arrestin 2-split GFP puncta was compared with cytosolic split GFP and β-arrestin 2-eGFP. Curves show normalized average fluorescent intensity with s.e.m. Mobile fractions are also shown. n, Quantification of cell count, as well as the size and number of puncta with β-arrestin 2-split GFP and IP6 mutants. P ≥ 0.05, *P = 0.01–0.05, **P = 0.001–0.01, ***P = 0.0001–0.001 and ****P < 0.0001 denote statistically significant differences by two-way ANOVA. For m, n = 13–18 cells; for n, data shown are for n = 16 wells over 3 experiments. The data are presented as mean ± s.e.m. Scale bars, 25 µm (a–d, f–l). NS, not significant. Panels e,i,j created with BioRender; Anderson, P. https://BioRender.com/k5g4hqy (2026).We next sought to evaluate the expression of endogenous β-arrestins using an orthogonal approach. To do so, we introduced the 11th β-strand of the split superfolder GFP (sfGFP; 16 amino acids), GFP11, on the C terminus of both β-arrestin 1 and 2 (ref. 30) via CRISPR–Cas9 in HEK293T cells, producing CRISPR β-arrestin-1-GFP11 and β-arrestin-2-GFP11 cell lines (Extended Data Fig. 1b). Endogenous β-arrestin can be visualized through transfection of the complementary 1–10 β-strands (GFP1–10) (Fig. 1e). We found endogenous β-arrestin 1 puncta predominantly in the cytosol (Fig. 1f). After overexpression and stimulation of β2AR or V2R, we found that β-arrestin 1 puncta translocated to the receptor (Fig. 1g,h). We also observed a similar recruitment of β-arrestin 2 puncta to the plasma membrane (Extended Data Fig. 1d).Next we sought to evaluate endogenous β-arrestin–β-arrestin interactions. To do so, we used the CRISPR β-arrestin-GFP11 and inserted GFP1–10 on the other β-arrestin allele, producing a CRISPR β-arrestin-split GFP cell line. At baseline, we observed puncta in the cytosol and upon receptor activation (β2AR, V2R and AT1R), we observed recruitment to the plasma membrane for both β-arrestin isoforms (Extended Data Fig. 1e). To evaluate exchange of β-arrestins in these condensates, we used fluorescence recovery after photobleaching (FRAP), which revealed that β-arrestin 2-GFP11 cell line was dynamic with a recovery of about 60% (n = 6) (Extended Data Fig. 1c). Intriguingly, FRAP of β-arrestin-split GFP resulted in recovery of about 80% (n = 12), which could represent a different dynamic population of β-arrestin–β-arrestin puncta. Together, data from immunofluorescence and CRISPR cell lines demonstrate that both β-arrestin isoforms form biomolecular condensates at endogenous levels at baseline and after agonist stimulation.β-Arrestin condensates are regulated by GPCRsTo test for the ability of β-arrestins to oligomerize when overexpressed, we compared patterns of β-arrestin labelling with monomeric and split GFP variants. Labelling of β-arrestins with enhanced GFP (eGFP) on the C terminus of β-arrestin 1 or 2 demonstrated diffuse expression in the nucleus and cytoplasm for β-arrestin 1, and in the cytoplasm alone for β-arrestin 2 due to the presence of a nuclear export sequence in β-arrestin 2 (Fig. 1i)29. To visualize potential interactions between β-arrestins, we co-expressed β-arrestin 2, which was labelled at its C terminus with the 11th β strand of split sfGFP, along with β-arrestin 2, which was labelled at its C terminus with the complementary sfGFP1–10 in HEK293T cells (Fig. 1j). Expression of β-arrestin GFP11 or β-arrestin sfGFP1–10 alone resulted in no observable signal (Extended Data Fig. 2a). With co-expression of both labelled β-arrestins, we observed the formation of puncta (Fig. 1j), consistent with an interaction between β-arrestins resulting in complementation of GFP11. These puncta localized with AP2 and clathrin, which are markers of CCPs (Fig. 1k). Notably, we did not observe visible puncta with overexpression of β-arrestin 1-eGFP and β-arrestin 2-eGFP (Extended Data Fig. 2b). Similarly, titration of split GFP-labelled β-arrestin 1 resulted in puncta near the endogenous expression of β-arrestin (Extended Data Fig. 2c,d).We then tested the effects of agonist stimulation of the β2AR or V2R on overexpressed eGFP- or split GFP-labelled β-arrestins in HEK293T cells. These receptors display distinct patterns of β-arrestin recruitment to the receptor after agonist stimulation, where the β2AR promotes a class A pattern, characterized by plasma membrane β-arrestin redistribution but minimal internalization with the receptor to endosomes. By contrast, the V2R promotes a class B pattern that is characterized by initial β-arrestin redistribution to the plasma membrane, followed by strong localization to endosomes with the receptor31,32. Agonist stimulation of the receptors transfected with β-arrestin 2-eGFP resulted in the expected patterns at 5 and 20 min (Extended Data Fig. 3a). Cells transfected with β-arrestin-split GFP resulted in signal largely limited to the plasma membrane at both receptors at 5 min, similar to that observed with eGFP-labelled β-arrestins (Extended Data Fig. 3b). By contrast, at 20 min split-GFP-labelled β-arrestins displayed distinct patterns from eGFP-labelled β-arrestins. Although we observed some puncta at endosomes at the V2R, we still observed split GFP signal at the plasma membrane 20 minutes after agonist stimulation (Extended Data Fig. 3b). This is consistent with distinct processes being monitored by eGFP- and split GFP-labelled β-arrestin, namely redistribution and oligomerization, respectively. Together, these data are consistent with β-arrestin oligomerization being dynamically regulated by receptor activation.To determine condensate fluidity, we next evaluated the dynamics of β-arrestin puncta with FRAP experiments (Fig. 1l,m and Supplementary Video 1). Cytosolic β-arrestin 2-eGFP showed a recovery of nearly 70% (n = 18) at 10 s. The β-arrestin 2-split GFP system showed that puncta and diffusible cytosolic pools dynamically exchange, as evidenced by similar recovery kinetics (cytosol n = 15; puncta n = 13). Quantification of the mobile fraction revealed that all three conditions showed similar patterns. We next tested whether β-arrestin oligomerization regulates the size and number of these puncta. Using previously published β-arrestin IP6 oligomerization mutants8, termed β-arrestin ΔIP6-N–C (Supplementary Fig. 1a), we found a significant decrease in both puncta intensity and number (Fig. 1n). We next tested the biophysical properties of these puncta by using 1,6-hexanediol (16HD), which disrupts π–π and hydrophobic interactions in condensates33, but can also have other off-target effects that impact cell signalling34. In cells overexpressing β-arrestin-eGFP, there was no change in the uniform distribution of β-arrestin-eGFP in the cytosol with 2.5% 16HD (Extended Data Fig. 2e). By contrast, in cells overexpressing β-arrestin-split GFP, there was a decrease in puncta intensity with 5% 16HD after 5 min (Extended Data Fig. 2e). Together, these findings are consistent with β-arrestins forming condensates that are regulated by IP6-mediated oligomerization.Optogenetic control of β-arrestin LLPSTo dissect the components of β-arrestin sufficient for condensate formation, we leveraged an optogenetic approach to modulate condensate formation35. In short, Cry2, upon exposure to blue light, induces oligomerization, and when fused with an intrinsically disordered region (IDR), drives LLPS to form condensates (Fig. 2a). Consistent with past reports, we found that wild-type (WT) Cry2 (Cry2-mCherry) alone was insufficient in driving condensate formation (Fig. 2b,f and Supplementary Video 2)36. Fusion with the N terminus of FUS (FUSN)—a well-characterized IDR37—to Cry2WT, led to light-induced clustering in both the cytosol and the nucleus (Fig. 2c,f and Supplementary Video 3). We next fused full-length β-arrestin 1 or 2, which we termed opto-β-arrestins. For opto-β-arrestin 1, light treatment promoted condensate formation within a matter of seconds, predominantly in the cytosol (Fig. 2d,f and Supplementary Video 4). By contrast, opto-β-arrestin 2 displayed a few puncta at baseline, with minimal impact from light activation (Fig. 2e,f and Supplementary Video 5). Together, this suggests that β-arrestins 1 and 2 may have different propensities to form condensates.Fig. 2: Opto-β-arrestin 1 forms condensates.The alternative text for this image may have been generated using AI.Full size imagea, Schematic of the OptoDroplet system. mCherry-Cry2 is shown, with either no IDR, FUSN, or β-arrestin 1 or 2, and under blue light visualization of mCherry. b–e, Representative fluorescence of light-activated Cry2WT (b), opto-FUSN (c), opto-β-arrestin 1 (d) and opto β-arrestin 2 (e). f, Quantification of the number of condensates. All cells were transfected with 500 ng of the respective construct, were shown to have similar expression and were activated under identical conditions. Confocal microscopy images are representative of n = 3 wells. For f, Cry2WT n = 5 cells, opto-FUSN n = 9 cells, opto-β-arrestin 1 n = 14 cells, opto-β-arrestin 2 n = 6 cells. The data are shown as mean ± s.e.m. Scale bars, 10 µm. Panels a–e created with BioRender; Anderson, P. https://BioRender.com/k5g4hqy (2026).Notably, the IDRs of β-arrestin are not accessible in the inactive β-arrestin conformation, as the β-arrestin C terminus is bound to its N domain38. Analysis of the β-arrestin sequence-dependent propensity of LLPS39 revealed that the intrinsically disordered C termini of both β-arrestin isoforms have a high likelihood of undergoing condensation (Supplementary Fig. 1b). As IDRs are a major driver of condensate formation, we sought to determine if the inclusion of β-arrestin IDRs alone with Cry2 was also sufficient to drive LLPS. Opto-β-arrestin 1 IDR formed condensates after about 30 s in both the cytosol and the nucleus (Extended Data Fig. 4a and Supplementary Video 6). With the opto-β-arrestin 2 IDR (Extended Data Fig. 4b and Supplementary Video 7), unlike the full-length β-arrestin 2, we observed condensate formation in both the cytosol and the nucleus. Kinetics of the number of condensates showed that opto-β-arrestin 1 IDR had faster kinetics compared with opto-β-arrestin 2 IDR (Extended Data Fig. 4e), which might explain why the opto-β-arrestin 1 is able to form condensates, unlike opto-β-arrestin 2. The β-arrestin IDR alone without a Cry2 domain was not sufficient to drive phase separation, with no observable condensate formation (Extended Data Fig. 4c,d). Overall, these findings suggest that β-arrestins can undergo LLPS, and that the IDRs can drive condensate formation when linked to an oligomerization motif.LLPS is specific to members of the arrestin familyThe arrestin family consists of four members: two visual arrestins (arrestin 1 and arrestin 4) and two non-visual arrestins (β-arrestin 1 (arrestin 2) and β-arrestin 2 (arrestin 3)). There is also a larger arrestin superfamily that includes proteins that share the same arrestin fold, including the α-arrestins40. As we observed that β-arrestin 1 was able to undergo LLPS, we next evaluated whether other members of the arrestin superfamily were able to undergo LLPS. Using the OptoDroplet system as a screening tool, we generated constructs with two well-studied α-arrestins: TXNIP41 and ARRDC1 (ref. 42) (Extended Data Fig. 5a,b). Opto-TXNIP localized to the plasma membrane, whereas opto-ARRDC1 was localized in the cytosol. Upon blue light stimulation, there was no condensate formation, suggesting that these α-arrestins do not undergo LLPS (Extended Data Fig. 5a,b).Given that arrestin 1 has been shown to oligomerize19, we tested its ability to form condensates. Upon blue light stimulation, opto-visual arrestin formed condensates (Extended Data Fig. 5c) unlike opto-ARRDC1 and opto-TXNIP (Extended Data Fig. 5d). Overall, these data suggest that LLPS is specific to members of the visual arrestin or β-arrestin family, and is not necessarily shared broadly in the arrestin superfamily.β-Arrestin oligomerization is orientation-dependentWe next sought to test how different modes of β-arrestin oligomerization could contribute to LLPS. Past studies have shown that β-arrestins interact through different orientations to generate diverse types of oligomers such as chains and trimers8,18,43. However, it is unclear whether there is a basal orientation of β-arrestin oligomers. We used a high-throughput confocal approach with the split GFP system, in which we fused GFP11 or the sfGFP1–10 to the N or C terminus of β-arrestin 1 to quantify β-arrestin condensates across tens of thousands of cells (Extended Data Fig. 6a). We found that that C–C orientation resulted in the largest and most puncta, followed by N–C and N–N (Extended Data Fig. 6b–d). To further validate these findings, we used an orthogonal NanoLuc Binary Technology (NanoBiT) split luciferase assay to evaluate β-arrestin orientation dependence44, which relies on the complementation of an 11-amino acid peptide small subunit (SmBiT) to a larger subunit (LgBiT). We fused the SmBiT and/or LgBiT to either the N or C terminus of β-arrestin 2. As there is a low affinity between SmBiT and LgBiT44, any observed signal is driven by the native protein–protein interaction. We transfected different combinations of β-arrestins with these tags on either terminus, for example, N–N (that is, SmBiT-β-arrestin 2 + LgBiT-β-arrestin 2), N–C (SmBiT-β-arrestin 2 + β-arrestin-2-LgBiT) or C–C (β-arrestin-2-SmBiT + β-arrestin-2-LgBiT) (Extended Data Fig. 6e). We observed a similar trend to our split- GFP data, in which luminescence was the highest for the β-arrestin C–C orientation, followed by N–C, and then much lower for the N–N orientation (Extended Data Fig. 6e). Together, these findings suggest that the C–C orientation is the predominant form of β-arrestin condensates under basal conditions.To determine whether GPCRs can promote orientation-dependent β-arrestin oligomerization, we used the NanoBiT system to evaluate GPCR-induced orientation. In this assay, we determined the luminescence signal at baseline and the percentage change after agonist stimulation (Fig. 3a). We compared two well-studied receptors—V2R and β2AR—given that the former has a high affinity for β-arrestin (class B pattern) compared with the latter (class A pattern)32. Agonist stimulation of the V2R resulted in a significant increase in signal with the N–N orientation, followed by the N–C and C–C orientations (Fig. 3b). At the β2AR, agonist stimulation increased the N–C interaction, with a significant decrease in C–C interactions (Fig. 3b). These findings suggest that different GPCRs promote distinct patterns of β-arrestin oligomerization with orientation dependence.Fig. 3: GPCRs regulate β-arrestin oligomerization with orientation dependence that occurs in proximity to the receptor.The alternative text for this image may have been generated using AI.Full size imagea, β-Arrestin split luciferase oligomerization assay. Luciferase fragments (LgBiT or SmBiT) were fused to the N or C terminus of β-arrestin 2 to evaluate receptor-induced β-arrestin oligomerization. HEK293T cells were transiently transfected with split luciferase β-arrestin and receptors, and then stimulated with an agonist or vehicle. b, Receptor-induced β-arrestin 2 oligomerization. Split luciferase signal of cells transfected with V2R (left) or β2AR (right) and stimulated with AVP (1 µM) or isoproterenol (10 µM), respectively. c, NanoBiT BRET monitoring of β-arrestin 2 oligomerization at the receptor or endosome. Cells were either transfected with split luciferase donors (β-arrestin 2) and mKO acceptor (receptor- or endosome-mKO). d, Net BRET of either V2R-mKO (left) or β2AR-mKO (right), which were stimulated with AVP (1 µM) or isoproterenol (10 μM), respectively. e, Similar experiment to d, except evaluating β-arrestin 2 oligomerization at V2R (left) or β2AR (right) endosomes that were stimulated with AVP (1 µM) or isoproterenol (10 µM), respectively. P ≥ 0.05, *P = 0.01–0.05, **P = 0.001–0.01, ***P = 0.0001–0.001, ****P < 0.0001 denote statistically significant differences by two-way ANOVA. For b–e, n = 3–5 separate replicates. The data are presented as mean ± s.e.m. AUC, area under the curve. Panels a,c created with BioRender; Anderson, P. https://BioRender.com/k5g4hqy (2026).These findings suggest that β-arrestin oligomerization was directed in part by GPCR activation, suggesting that it occurs in proximity to the receptor. To assess this, we leveraged an assay for assessing tripartite interactions, that is, NanoBiT bioluminescence resonance energy transfer (BRET)45, which monitors NanoBiT split luciferase between two proteins followed by BRET to a fluorescent protein acceptor, monomeric Kusabira orange (mKO). We performed NanoBiT BRET between the SmBiT- and LgBiT-labelled β-arrestins and mKO-tagged receptors (V2R-mKO and β2AR-mKO) or endosomes (2xFYVE-mKO) (Fig. 3c). Consistent with our NanoBiT assay, we observed a similar pattern with both the V2R-mKO and β2AR-mKO, with both receptors displaying an increase in N–N orientation followed by N–C and C–C orientations. We observed that β2AR-mKO had nearly a tenfold weaker signal than V2R-mKO (Fig. 3d). At endosomes, V2R promoted predominately the N–N, followed by the N–C and C–C orientations, whereas the β2AR promoted a similar amount of N–N and N–C oligomerization (Fig. 3e). We next investigated whether β-arrestins can form complexes at other intracellular locations such as the plasma membrane (CAAX-mKO) and CCPs (AP2-mKO) (Extended Data Fig. 7a). For the V2R, we found no observable difference in β-arrestin oligomerization at the plasma membrane and CCPs (Extended Data Fig. 7b,c). By contrast, β2AR induced a predominately C–C orientation at the plasma membrane while it promoted N–C and N–N orientations at CCPs. Overall, these results suggest that receptors mobilize β-arrestin oligomers to different intracellular compartments.We next explored whether this phenomenon was generalizable to other GPCRs, such as the AT1R and atypical chemokine receptor 3 (ACKR3). Both receptors, in response to agonist stimulation, induced β-arrestin oligomerization with predominately the N–N orientation at the receptor (Extended Data Fig. 7d,e). Next, we evaluated whether oligomerization had a bystander effect at other receptors (V2R and β2AR). When the AT1R was stimulated with AngII or ACKR3 was stimulated with WW36, we observed no oligomerization at the non-cognate receptor (V2R and β2AR, respectively), consistent with oligomerization being promoted at the agonist-activated receptor and not more broadly throughout the plasma membrane (Extended Data Fig. 7d,e). Together, these data demonstrate that numerous GPCRs can promote β-arrestin oligomerization with orientation dependence in proximity to the agonist-activated receptor.16HD diminishes GPCR endocytosisPhase separation is important for components of the endocytic machinery such as coating proteins, endocytic adaptors and membrane lipids. As β-arrestins are critical for GPCR internalization, we hypothesized that internalization is regulated by β-arrestin condensates. We first investigated whether 16HD alters the recruitment of β-arrestin to the receptor. Consistent with HEK293T cells pre-treated with 16HD (Extended Data Fig. 2e), there was no observable difference between the β-arrestin-GFP vehicle- and 16HD-treated cells. Upon vasopressin (AVP) stimulation, β-arrestin-GFP was recruited to the plasma membrane, and this recruitment pattern was blunted by pre-treatment with 16HD (Extended Data Fig. 8a). 16HD significantly reduced the initial (around 5 min) agonist-induced recruitment of both β-arrestins 1 and 2 to different receptors (V2R, AT1R and β2AR). By contrast, β-arrestin recruitment to the plasma membrane increased at the V2R and AT1R, but not the β2AR (Extended Data Fig. 8b,c). This difference in recruitment could be attributed to 16HD, given that its effectiveness peaks at around 5 min (ref. 46).As 16HD diminished β-arrestin recruitment, we next tested whether GPCR internalization was also inhibited by pre-treatment with 16HD (Fig. 4a–c). To control for endogenous β-arrestin expression, we used WT HEK293T cells and studied receptor internalization of two class B GPCRs that are known to require β-arrestins, the V2R and AT1R (Fig. 4a). Incubation with 2.5% or 5% 16HD for 5 min resulted in a near-complete ablation of receptor-mediated endocytosis at both the V2R and AT1R (Fig. 4a). To confirm these findings, we performed confocal microscopy of HEK293T cells transfected with V2R-mKO and AT1R-mKO incubated with 2.5% 16HD for 5 min and stimulated with their endogenous agonists for 30 min. We found that the receptor-mKO signal was predominately at the plasma membrane, whereas only vehicle-treated (agonist only with no 16HD) cells had internalized mKO-labelled receptors (Fig. 4b,c). These findings are consistent with phase separation being important for GPCR internalization.Fig. 4: Disruption of β-arrestin oligomerization motifs and IDRs impact GPCR internalization.The alternative text for this image may have been generated using AI.Full size imagea, Receptor internalization assay. HEK293T cells were transfected with receptor-RLuc bioluminescent donor, fluorescently tagged endosome acceptor, and pre-incubated with either vehicle, 2.5% 16HD or 5% 16HD for 5 min. AT1R-RLuc was stimulated with AngII (1 μM) and V2R-RLuc stimulated with AVP (1 μM). Internalization performed using (2xFYVE-Venus). b,c, Receptor-mKO transfected cells were treated with Hanks’ Balanced Salt Solution (b, upper), stimulated with ligand (c, upper), pre-incubated with 2.5% 16HD (b, lower), or pre-incubated with 2.5% 16HD and stimulated with ligand (c, lower). d, β-Arrestin chain, trimeric and IDR mutants. Left, β-arrestin 1 bound to IP6 structure (PDB: 1ZSH). Sequence alignment of β-arrestin 1 and 2 IP6 mutagenetic sites: ΔIP6-N, ΔIP6-C and ΔIP6-N–C. Middle, β-arrestin trimeric structure bound to ΔIP6 (PDB: 5TV1) and schematic of the N terminus trimeric mutant (ΔIP6-NT). Right, β-arrestin IDR mutants were designed with MobiDB; β-arrestin 2 IDR extends from 350 to 409 and includes ΔAP2, Δclathrin, ΔCT and ΔIDR. e,f, BRET receptor internalization assay. Similar to a, except β-arrestin 1–2 KO cells were transfected with β-arrestin mutants ΔIP6-N–C and ΔIP6-NT–C (e) or ΔCT and ΔIDR (f); AT1R-RLuc (AngII, 1 μM, left), V2R-RLuc (AVP, 1 μM, right). The internalization assays were performed using 2xFYVE-Venus (schematic to left of panels e,f). g,h, Similar experiment to e,f for ΔIP6-N–C and ΔIP6NT–C (g) or ΔCT and ΔIDR (h); but the BRET receptor internalization assays were performed using Venus fused to the plasma membrane (Myrpalm-Venus) (schematic to left of panels g,h). Figures showing the AUC display the mean, s.e.m. and replicates of the raw kinetic data presented in the preceding panels. P ≥ 0.05, *P = 0.01–0.05, **P = 0.001–0.01, ***P = 0.0001–0.001 and ****P < 0.0001 denote statistically significant differences between the AUC by two-way ANOVA. For a,e–i, n = 3 separate replicates. Confocal microscopy images are representative of n = 3 experiments. Panels a,d,e,g created with BioRender; Anderson, P. https://BioRender.com/k5g4hqy (2026).β-Arrestin IP6 and IDR mutants alter GPCR internalizationβ-Arrestins have an architecture with N and C domains followed by a C-terminal IDR (Fig. 4d). In the N and C domains, β-arrestin 1 and 2 have basic residues that bind to IP6 and are known to promote β-arrestin 1 chains8 and β-arrestin 2 trimers17. As oligomerization can drive LLPS, we generated β-arrestin mutants predicted to disrupt IP6 binding sites (ΔIP6) that promote oligomerization through chains or trimers. For the chain mutants, we generated three β-arrestin mutants: (1) N terminus (ΔIP6-N); (2) C terminus (ΔIP6-C); and (3) both N and C terminus (ΔIP6-N–C) (Fig. 4d). As the ΔIP6-C site is the same for the chain and trimer mutants, which share the same IP6 site, we generated only the N and C terminus mutant (ΔIP6-NT–C) to disrupt the potential trimer interaction (Fig. 4d). The ΔIP6-N–C mutant was therefore referred to as the chain mutant and ΔIP6-NT–C as the trimeric mutant. Notably, these mutations did not significantly alter protein expression (Extended Data Fig. 8d)47.As IDRs contribute to LLPS, we also sought to investigate the roles of motifs in the β-arrestin 2 IDR that are important for intracellular localization to CCPs and cytosol. We assessed the function of four different β-arrestin 2 IDR mutants, which we named ΔAP2 (ref. 48), Δclathrin49, ΔCT (refs. 7,50) and ΔIDR on the basis of the sites that were mutated or deleted (Fig. 4d). To determine the role of the IP6 and IDR β-arrestin mutants in GPCR internalization, we overexpressed these constructs in β-arrestin 1–2 KO HEK293T cells51. Internalization was quantified by monitoring BRET between GPCR-RLuc and endosomes tagged with Venus (Fig. 4e). At the AT1R and V2R, internalization was not affected by plasmid-cloning DNA (pcDNA) control, but was restored with transfection of WT β-arrestin 2. We found a significant decrease in AT1R internalization with the ΔIP6-N–C and ΔIP6-NT–C mutants compared with WT β-arrestin 2, and a non-significant decrease in V2R internalization with those mutants compared with WT β-arrestin 2. We observed no difference in AT1R or V2R internalization with the ΔIP6-N and ΔIP6-C mutants compared with WT β-arrestin 2 (Extended Data Fig. 9a). We next evaluated the contribution of β-arrestin 2 ΔIDR mutants to the internalization of AT1R and V2R. At the AT1R, we observed diminished internalization with all four IDR mutants (ΔAP2, Δclathrin, ΔCT and ΔIDR; Fig. 4f and Extended Data Fig. 9b). At the V2R, three of the four mutants resulted in diminished internalization, except for the ΔCT mutant. We did not observe complete ablation of internalization with ΔIDR mutant, consistent with studies demonstrating that class B GPCRs use motifs in both the IDR and the C lobe of β-arrestins to promote internalization52. Next, we used two different GPCR internalization assays to confirm these results: (1) monitoring a loss of BRET signal between the RLuc-labelled receptor and a Myrpalm-labelled Venus (Fig. 4g,h and Extended Data Fig. 9c,d); and (2) confocal microscopy (Extended Data Fig. 9e). Both of these assays showed similar results to our endosomal internalization assay. Overall, these results demonstrate that oligomerization motifs and IDRs within β-arrestins contribute to GPCR internalization.β-Arrestin IP6 and IDR mutants alter GPCR signallingWe next tested how β-arrestin oligomerization and IDR mutants affect the activity of extracellular signal-regulated kinases 1 and 2 (ERK1 and ERK2), which are key regulators of cell proliferation, survival and apoptotic signalling downstream of GPCRs. We used a BRET-based ERK activity reporter (EKAR) targeted to different subcellular locations53 (Fig. 5a,b). In HEK293T cells, uptitration of 16HD resulted in a decrease in AngII-induced cytosolic and nuclear ERK activity (Fig. 5b), which was confirmed by western blot (Extended Data Fig. 10a,b). As 16HD has notable off-target effects on kinase activity34, we sought to determine whether this also impacted GRK receptor recruitment. HEK293T cells were transfected with SmBiT-tagged AT1R and LgBiT-tagged GRK2 or GRK3 to evaluate agonist-dependent GRK recruitment to the receptor. We observed no change in GRK2 recruitment but we did observe a 16HD-induced dose-dependent increase in GRK3 recruitment (Extended Data Fig. 10d). As we observed diminished recruitment of β-arrestin in the presence of 16HD, we hypothesized that it may influence G protein desensitization. HEK293T cells were transfected with TRUPATH constructs54 to monitor Gαq and Gαs dissociation at two well-characterized class B GPCRs, the AT1R and V2R, respectively. For both receptors, there were no appreciable differences in G protein dissociation in the presence of 16HD (Extended Data Fig. 10e).Fig. 5: β-Arrestin IP6 and IDR mutants influence GPCR signalling.The alternative text for this image may have been generated using AI.Full size imagea, Top, schematic of BRET-based ERK biosensor that uses ERK-specific substrate that, upon phosphorylation, induces a conformational change and an increase in BRET. Bottom, net BRET readout from localized cytoplasmic ERK sensor (Cyto-EKAR) in HEK293T cells that were transfected with AT1R, stimulated with AngII (1μM) or vehicle, and pre-treated with 16HD for 5 min. NLuc, nanoluciferase; PAABD, phopshoamino binding domain. b, Top, β-arrestin-mediated Cyto-EKAR and nuclear ERK sensor (Nuc-EKAR) readout in cells incubated with 16HD. Bottom, net BRET readout from Nuc-EKAR in HEK293T cells that were transfected with AT1R, stimulated with AngII (1 μM) or vehicle, and pre-treated with 16HD for 5 min. c, Top, schematic of Gαq TRUPATH. Bottom, HEK293T cells were transfected with AT1R:Gαq TRUPATH components (β-arrestin WT and mutants) and stimulated with a AngII dose-response. d, Kinetic data and AUC quantification of cytoplasmic ERK sensor with β-arrestin WT and mutants, in HEK293T cells that were transfected with AT1R after stimulation with AngII (1 μM). e, Similar to experiment d, except nuclear ERK monitored with Nuc-EKAR. Figures showing the AUC display the mean, s.e.m. and replicates of the raw kinetic data presented in the preceding panels. P ≥ 0.05, *P = 0.01–0.05, **P = 0.001–0.01, ***P = 0.0001–0.001, ****P < 0.0001 denotes statistically significant differences between AUC by two-way ANOVA. For a–e, n = 3, except Nuc-EKAR (β-arrestin ΔIP6)) n = 5 replicates per condition. Data are presented as mean ± s.e.m. Panels a–e created with BioRender; Anderson, P. https://BioRender.com/k5g4hqy (2026).One of the chief functions of β-arrestin is to desensitize the receptor by sterically inhibiting G-proteins from interacting with the receptor55. As β-arrestin ΔIP6 oligomeric mutants had different internalization patterns, we next sought to investigate how this influenced G protein activation (Fig. 5c and Extended Data Fig. 10c). In HEK293T cells, Gαq dissociation for AT1R was significantly diminished by the expression of WT β-arrestin 1 or 2. Interestingly, the ΔIP6-N–C mutant had no significant effect on G protein signalling compared with the pcDNA control (Fig. 5c and Extended Data Fig. 10c). We then sought to investigate whether the IP6 and IDR motifs in β-arrestins affect AT1R-mediated ERK signalling56 (Fig. 5d,e and Extended Data Fig. 10f,g). Consistent with past studies4, overexpression of β-arrestin 2 in HEK293T cells resulted in less cytoplasmic ERK compared with pcDNA control (Extended Data Fig. 10f). There was no decrease in cytoplasmic ERK activity with the majority of β-arrestin ΔIP6 mutants except for β-arrestin ΔIP6-C. By contrast, all four β-arrestin 2 IDR mutants (ΔCT, ΔIDR ΔAP2 and Δclathrin) resulted in a small reduction in cytoplasmic ERK (Fig. 5d and Extended Data Fig. 10f). In the nucleus, β-arrestin 2 ΔIP6-NT–C overexpression resulted in more ERK activity compared with WT β-arrestin 2 (Fig. 5e and Extended Data Fig. 10g). Most of the IDR mutants resulted in a decrease in nuclear ERK activity, except for the ΔIDR mutant, which increased activity (Fig. 5e and Extended Data Fig. 10g). These findings suggest contrasting roles for specific IP6 binding and IDR motifs in the regulation of GPCR signalling, some of which may be related to their regulation of LLPS and others which may be related to other β-arrestin-mediated functions.DiscussionOur studies support a model in which β-arrestins form endogenous condensates at baseline and after GPCR stimulation to regulate GPCR function (Extended Data Fig. 11). The formation of condensates that compartmentalize GPCR signalling potentially explains how β-arrestins are capable of interacting with hundreds of effector proteins to regulate GPCR signalling. Hints that β-arrestins may themselves undergo LLPS have come from observations that endogenous β-arrestin puncta are associated with centrosomes and the primary cilium57, contrasting with the classical view of β-arrestins as diffusely distributed in the cytosol. Little has been known about the endogenous localization patterns of β-arrestins or their potential functional roles in condensate formation. Using orthogonal approaches, we observed that endogenous β-arrestins form condensates and are recruited to receptors following stimulation. Interestingly, overexpression of β-arrestin resulted in a diffuse cytosolic pattern. This could reflect either: (1) optical dilution due to the greatly increased total number of β-arrestin molecules; or (2) disruption of phase behaviour by exceeding the critical concentration for condensation. For example, if a limited number of endogenous β-arrestin condensates exist, transfection-driven overexpression could increase β-arrestin abundance by several orders of magnitude, giving the appearance of diffuse cytosolic distribution or potentially pushing the system beyond its critical point for LLPS.Some of the first evidence that β-arrestin could hetero- and homo-oligomerize was in cells; the evidence displayed an orientation dependence bias at baseline18. With the exception of arrestin 4 (cone arrestin), all arrestins have been shown to oligomerize, but the oligomers they form when purified are different19. Notably, β-arrestin 1 and 2 mutants that are unable to bind IP6 do not seem to oligomerize in vivo20. Recent structural work has shown phosphopeptide C tails (V2Rpp, C5a1Rpp and M2Rpp) induce a trimeric β-arrestin structure58, which suggests that oligomerized β-arrestin could interact with GPCR C tails. We show that β-arrestin oligomerization occurs near receptors that display a common orientation (N–N > N–C > C–C orientations) and that oligomerization mutants reduced internalization. β-Arrestin has recently been shown to associate with plasma membrane nanodomains following receptor activation, and phase separation has been proposed as a key mediator for this process59. Similarly, we show that β-arrestin condensates recruit to the plasma membrane following agonist stimulation. Further studies are required to assess the functional significance of these different β-arrestin orientations and the interplay between GPCR and β-arrestin condensates, and their influence on signalling outcomes.In summary, our findings demonstrate that β-arrestin can form condensates that regulate GPCR function. This finding addresses open questions regarding the function of β-arrestin oligomerization on GPCR function19. Given the importance of β-arrestins in GPCR regulation and drug discovery, these findings have translational and clinical implications, as context-dependent targeting of these condensates could be used to regulate physiologically relevant GPCR signalling2 that may aid in the development of more efficacious GPCR therapeutics.MethodsGeneration of constructsConstructs were developed using a modified overlap cloning technique60. Flexible linkers, consisting of glycine–serine repeats (GGGGS), with lengths ranging from 18 to 33 amino acids, were inserted between the coding sequences for fluorescent proteins or luciferases and those of receptors, transducers, biosensors or adaptor proteins. The creation of SmBiT-β-arrestin IP6, AP2 and clathrin mutants used a previously published overlap cloning strategy with SmBiT. The 2xFYVE-mKO construct was created by integrating Cyto-mKO into the 2xFYVE-LgBiT vector via overlap cloning.Generation of β-arrestin-split GFPβ-Arrestin-split GFP constructs were derived from pcDNA3.1-GFP(1–10) (Addgene no. 70219) and pEGFP-GFP11-Actin (Addgene no. 181966) and cloned into either SmBiT-β-arrestin or β-arrestin-SmBiT.Generation of stable cell linesβ-Arrestin knock-in cell lines were made by Cyagen. In short, the Arrb1–2 (C terminal linker-GFP11) knock-in HEK293T cells wereseeded into six-well plates and cultured for 24 h. Cas9 nuclease (0.2 nmol) and guide RNAs (0.1 nmol; sequences in Supplementary Table 1) were pre-incubated to assemble ribonucleoprotein complexes, and 0.5 nmol of donor vector was electroporated into the target cells. Within 24–48 h post-electroporation, the cell pool was sorted and tested for the cell condition using DAPI-negative staining. Cell pools with high editing efficiency were selected for monoclonal preparation. Single cells were deposited into 96-well plates by limiting dilution. After approximately 2 weeks of culture, well-growing single clones in good condition were expanded, and genomic DNA was analysed by PCR (primer listed in Supplementary Table 1) and sequencing (Genscript) to confirm precise C terminal-linker-GFP11 integration.Mutagenesis of β-arrestin IP6 and IDR mutantsMutation generation was performed using the QuikChange site-directed mutagenesis kit (Agilent). The mutations produced included ΔIP6-N, ΔIP6-C, ΔIP6-N–C, ΔIP6-NT, ΔIP6-NT–C, ΔIDR and ΔCT.Opto-β-arrestin constructsOpto-β-arrestin constructs were designed on the basis of those from a past work35. pHR-mCh-Cry2WT (Addgene no. 101221) and pHR-FUSN-mch-Cry2WT (Addgene no. 101223) were cloned into the pcDNA backbone. Overlap cloning was then used to generate all opto-β-arrestin constructs.ImmunofluorescenceHEK293T cells were fixed with 4% PFA for 20 min and then washed three times with phosphate-buffered saline (PBS). Cells were incubated with donkey serum blocking buffer with 0.1% Triton X-100 for 1 h and then washed three times with PBS. Cells were then stained with primary antibodies with β-arrestin 1 (BD Biosciences, 610550, 1:100) or β-arrestin 2 (Abnova, M06J, 1:500) overnight for 4 °C, and then washed three times with 1× PBS. Secondary antibodies (1:500) and Hoechst 33342 (1:1000) were then applied for 2 h at room temperature and washed three times with 1× PBS.BRET and split nanoluciferase assaysFor BRET and split luciferase assays, HEK293T cells were cultured in six-well plates and transiently transfected using polyethylenimine (PEI) as outlined previously. The β-arrestin association was analysed using split NanoLuc components (that is, SmBiT and LgBiT) to explore various protein-protein interactions, including amino–amino (N–N), amino–carboxyl (N–C) and carboxyl–carboxyl (C–C) interfaces. Specifically, 500 ng of the receptor and 100 ng of each β-arrestin construct were introduced into the cells. In the NanoBiT-BRET assay set-up, 500 ng of the receptor and 1 μg of location-specific tagged-mKO (including Cyto-mKO, CAAX-mKO, AP2-mKO and 2xFYVE-mKO) were co-transfected with 200 ng of each NanoBiT β-arrestin variant. Cyto-mKO and CAAX-mKO were used for the normalization of β-arrestin association studies (for example, N–C interactions). For β-arrestin recruitment assays, cells received 500 ng of receptor-LgBiT and 200 ng of N-terminally tagged SmBiT-β-arrestin. To ascertain β-arrestin’s recruitment to specific cellular locales, 500 ng of the receptor and 1 μg of either CAAX-LgBiT or 2xFYVE-LgBiT were used. Endocytosis assays were performed by co-transfecting 200–500 ng of receptor-RLuc with 11.5 μg of 2xFYVE-Venus. For EKAR assays, 25 ng of the biosensor was paired with 1 μg of the receptor and 200 ng of β-arrestin. For TRUPATH assay, 1:1:1:1 μg of receptor:Gαq:Gβ:Gγ were used. On the following day (day 2 after transfection), cells underwent washing with PBS and detachment via trypsinization; they were then seeded onto a Corning Costar 96-well clear-bottomed, white-walled plate at a density of 70,000–100,000 cells per well. The culture medium was replaced with clear minimal essential medium, enhanced with 2% foetal bovine serum, 1% penicillin–streptomycin, 10 mM HEPES, 1× GlutaMAX and 1× antibiotic–antimycotic (Gibco). On day 3, the culture medium was removed, and cells were incubated with 80 μl of 3 μM coelenterazine h in Hanks’ Balanced Salt Solution, further supplemented with 20 mM HEPES buffer for 5 min. Before ligand addition in split luciferase assays, three baseline reads were recorded to assess basal luminescence, which was then normalized to vehicle control conditions and shown as percent change in luminescence. Luminescence and BRET ratios were quantified using a BioTek Synergy Neo2 plate reader at 37 °C. For BRET measurements, a 480 nm wavelength filter for the donor and a 530 nm or custom mKO 542 nm long-pass emission filter for the acceptor were used. Net BRET was determined by subtracting the vehicle BRET ratio from the ligand-induced BRET ratio.Confocal microscopyHEK293T cells were seeded onto 35-mm dishes coated with poly-d-lysine and cultured until they reached 50–70% confluence. Following transfection using PEI, cells were incubated for an additional 16–24 h to ensure adequate expression of the transfected constructs. Cells were then washed with PBS and serum-starved for 1 h to synchronize cellular responses. Before imaging, cells were treated for 5 min at 37 °C with either 16HD or a control serum-free medium. After this pretreatment, cells were stimulated with ligands: 10 μM isoproterenol, 1 μM AngII or 1 μM AVP. After stimulation, cells were fixed using 4% paraformaldehyde (PFA) supplemented with Hoechst 33342 (1:1000, Thermo Fisher Scientific) for nuclear staining. Imaging was performed on a Zeiss 880 or 980 confocal microscope, using appropriate laser lines for Hoechst 33342 (400 nm), GFP (480 nm) and mKO (548 nm).Live cell microscopyFor live cell imaging, HEK293T cells were similarly prepared and transfected as described for confocal microscopy. After the serum starvation period, cells were placed in a live cell chamber system equipped with a temperature stage at 37 °C. All live cell imaging was performed using 63× objective. For optogenetic β-arrestin experiments, two laser wavelengths were used (488 nm for Cry2 activation and 560 nm for mCherry).Fluorescence recovery after photobleachingFluorescence recovery after photobleaching was conducted using a Zeiss 980 confocal microscope with a 63× objective, leveraging a 488 nm laser for targeted bleaching of regions of interest. The procedure aimed to observe fluorescence recovery within these regions of interest over 3 min at specified intervals. Small circular regions of interest were designated on either punctate structures or the diffuse cytosol, and bleaching was performed with the laser at 100% power to diminish fluorescence selectively. Following bleaching, fluorescence recovery was captured, allowing for the analysis of protein dynamics. Recovery data were processed using ImageJ for initial quantification. Microsoft Excel was then used to normalize the fluorescence intensity data, setting the five pre-bleach values to one for a standardized baseline and the immediate post-bleach intensity to 0.ImmunoblottingImmunoblotting procedures were performed in accordance with previously established protocols. HEK293T cells were cultured in six-well plates and transiently transfected with β-arrestin pcDNA constructs using PEI. Following a 24-h post-transfection period, cells underwent serum starvation using minimum essential medium. Cells were then cooled on ice, rinsed with ice-cold PBS, and lysed using a buffer containing protease inhibitors Phos-STOP (Roche) and complete EDTA-free (Sigma). Lysates were agitated at 4 °C for 45 min and then centrifuged at more than 12,000g for 15 min at 4 °C to remove insoluble debris. The resulting supernatant was processed further. Protein samples were separated on SDS-10% polyacrylamide gels and transferred onto nitrocellulose membranes for blotting. Primary antibodies targeting phospho-ERK (1:1000 dilution, Cell Signalling Technology) and total ERK (1:1,000 dilution, Millipore Sigma) were applied overnight to evaluate ERK activation. The A1-CT antibody, specific for β-arrestin isoforms, and α-tubulin (Sigma-Aldrich) as a loading control were also used. Detection was facilitated by horseradish peroxidase-conjugated secondary antibodies (mouse anti-rabbit IgG or anti-mouse IgG) at a 1:3,000 dilution. The detection of immune complexes on the membranes was achieved using SuperSignal enhanced chemiluminescent substrate (Thermo Fisher) and documented with imaging equipment.Imaging of β-arrestin punctaOn day one, HEK293T cells were transfected in six-well dishes and incubated for 24 h. On day two 70–100,000 cells were plated on 96-well poly-d-lysine-coated plates (Thermo Scientific). On day three, cells were fixed with 4% PFA. After 30 min of fixation, cells were washed with 1× PBS for 10 min × 3. For acquisition, Image Xpress Pico Automated Cell Imaging System (Molecular Devices) was used.Quantification and statistical analysisQuantification of split GFP-β-arrestin punctaFor analysis, Image Xpress Pico Automated Cell Imaging System (Molecular Devices) was used. Thresholds or size and image intensity were made to negative controls. Images were captured at 20× and about 5,000 cells were analysed per well. Puncta were normalized to each cell with the nuclear marker.Image analysisConfocal Images were visualized using ImageJ. All image adjustments performed were identical and consistent. The line scan analysis function was used to measure the intensity of each channel.Optogenetic puncta quantificationCondensates were quantified on a per cell basis on a single optical plane using the ‘Surfaces’ module in Imaris (Bitplane; v.10.2). Cell outlines were determined from the first 10 s of the time-lapse, before condensate formation. Condensate detection thresholds were determined on a per-cell basis using the mean intensity of the cell measured at the start of each time-lapse. The remaining surface detection parameters were held constant across cells and conditions (smoothing applied = true, surface grain size = 0.07 μm, largest sphere diameter = 3 μm). For each cell, the total number of condensates were quantified at 1 s intervals over a 120 s imaging period. Two to four cells were quantified across multiple independent images for an average of nine cells per experimental condition. For quantification, only cells with similar expression were used for quantification.Line scan analysisSpatial localization of β-arrestin and GPCRs were quantified using line scan analysis in ImageJ (National Institutes of Health; v.1.54f). For each condition, a straight line segment (18–20 μm) was drawn manually using the line tool such that each line extended from one side of the cell membrane to the opposite side, spanning the full width of the cell. Cell membrane was determined using the GPCR channel. Fluorescence intensity profiles for the β-arrestin and GPCR channels across the entire line segment were extracted using the plot profile function.Statistics and reproducibilityStatistical methods were not used to predetermine sample size. Blinding and randomization were not used. Data were analysed in Microsoft Excel and graphed in GraphPad Prism v.11.0 (GraphPad). Dose-response curves were fitted to log agonist versus stimulus with three parameters with the minimum baseline corrected to zero. Statistical tests were performed using a two-way ANOVA when comparing different β-arrestin mutants in time response assays AUC. Further details of statistical analysis and replicates can be found in the figure legend. Crucial plate-based experiments were independently replicated by at least two different investigators whenever feasible. Specific P values for Figs. 1–5 can be found in Supplementary Table 2.Materials availabilityAll plasmids generated in this study will be distributed on reasonable request.Experimental model and subject detailsAll cell lines are periodicially tested for mycoplasma commnication. HEK 293T cells, including a β-arrestin 1–2 KO variant, were cultured in Dulbecco’s modification of Eagle’s medium with 10% foetal bovine serum and 1% antibiotic–antimycotic solution from Gibco, under conditions of 37 °C and 5% CO2 humidity. The β-arrestin 1–2 KO cells, created through CRISPR–Cas9 genome editing, were authenticated by immunoblot analysis and obtained from A. Inoue.For experiments requiring confocal microscopy, both HEK293T and β-arrestin 1–2 KO cells were seeded on 35-mm glass-bottomed dishes pre-coated with either poly-d-lysine or rat tail collagen, aiming for a confluence between 40% and 70%. In the case of 96-well plate assays, cell density was adjusted to 70,000–100,000 HEK293T cells per well.Transient transfections were performed using OPTI-MEM and PEI at a PEI-to-DNA mass ratio of 3:1. Cells designated for confocal microscopy analysis were prepared and imaged after 16–24 h post-transfection, adhering to the same timeline for BRET and split nanoluciferase assays.Reporting summaryFurther information on research design is available in the Nature Portfolio Reporting Summary linked to this article.
β-Arrestin condensates regulate G-protein-coupled receptor function - Nature
β-Arrestins, multifunctional adaptor proteins that regulate G-protein-coupled receptors (GPCRs), form phase-separated condensates, suggesting that β-arrestin liquid–liquid phase separation organizes and diversifies GPCR signalling functions.
12,150 words~55 min read