Built on Postgres, Supabase is an open source, all-in-one backend platform for developers who want to ship applications without managing infrastructure. This makes it especially popular with frontend developers and vibe coders who may have little to no database expertise. Datadog’s Supabase integration provides high-level infrastructure metrics, but developers also need query-level visibility to easily diagnose, optimize, and trace performance issues back to their source. Without that visibility, it’s difficult to determine whether slowdowns originate in the service layer or in Postgres itself.
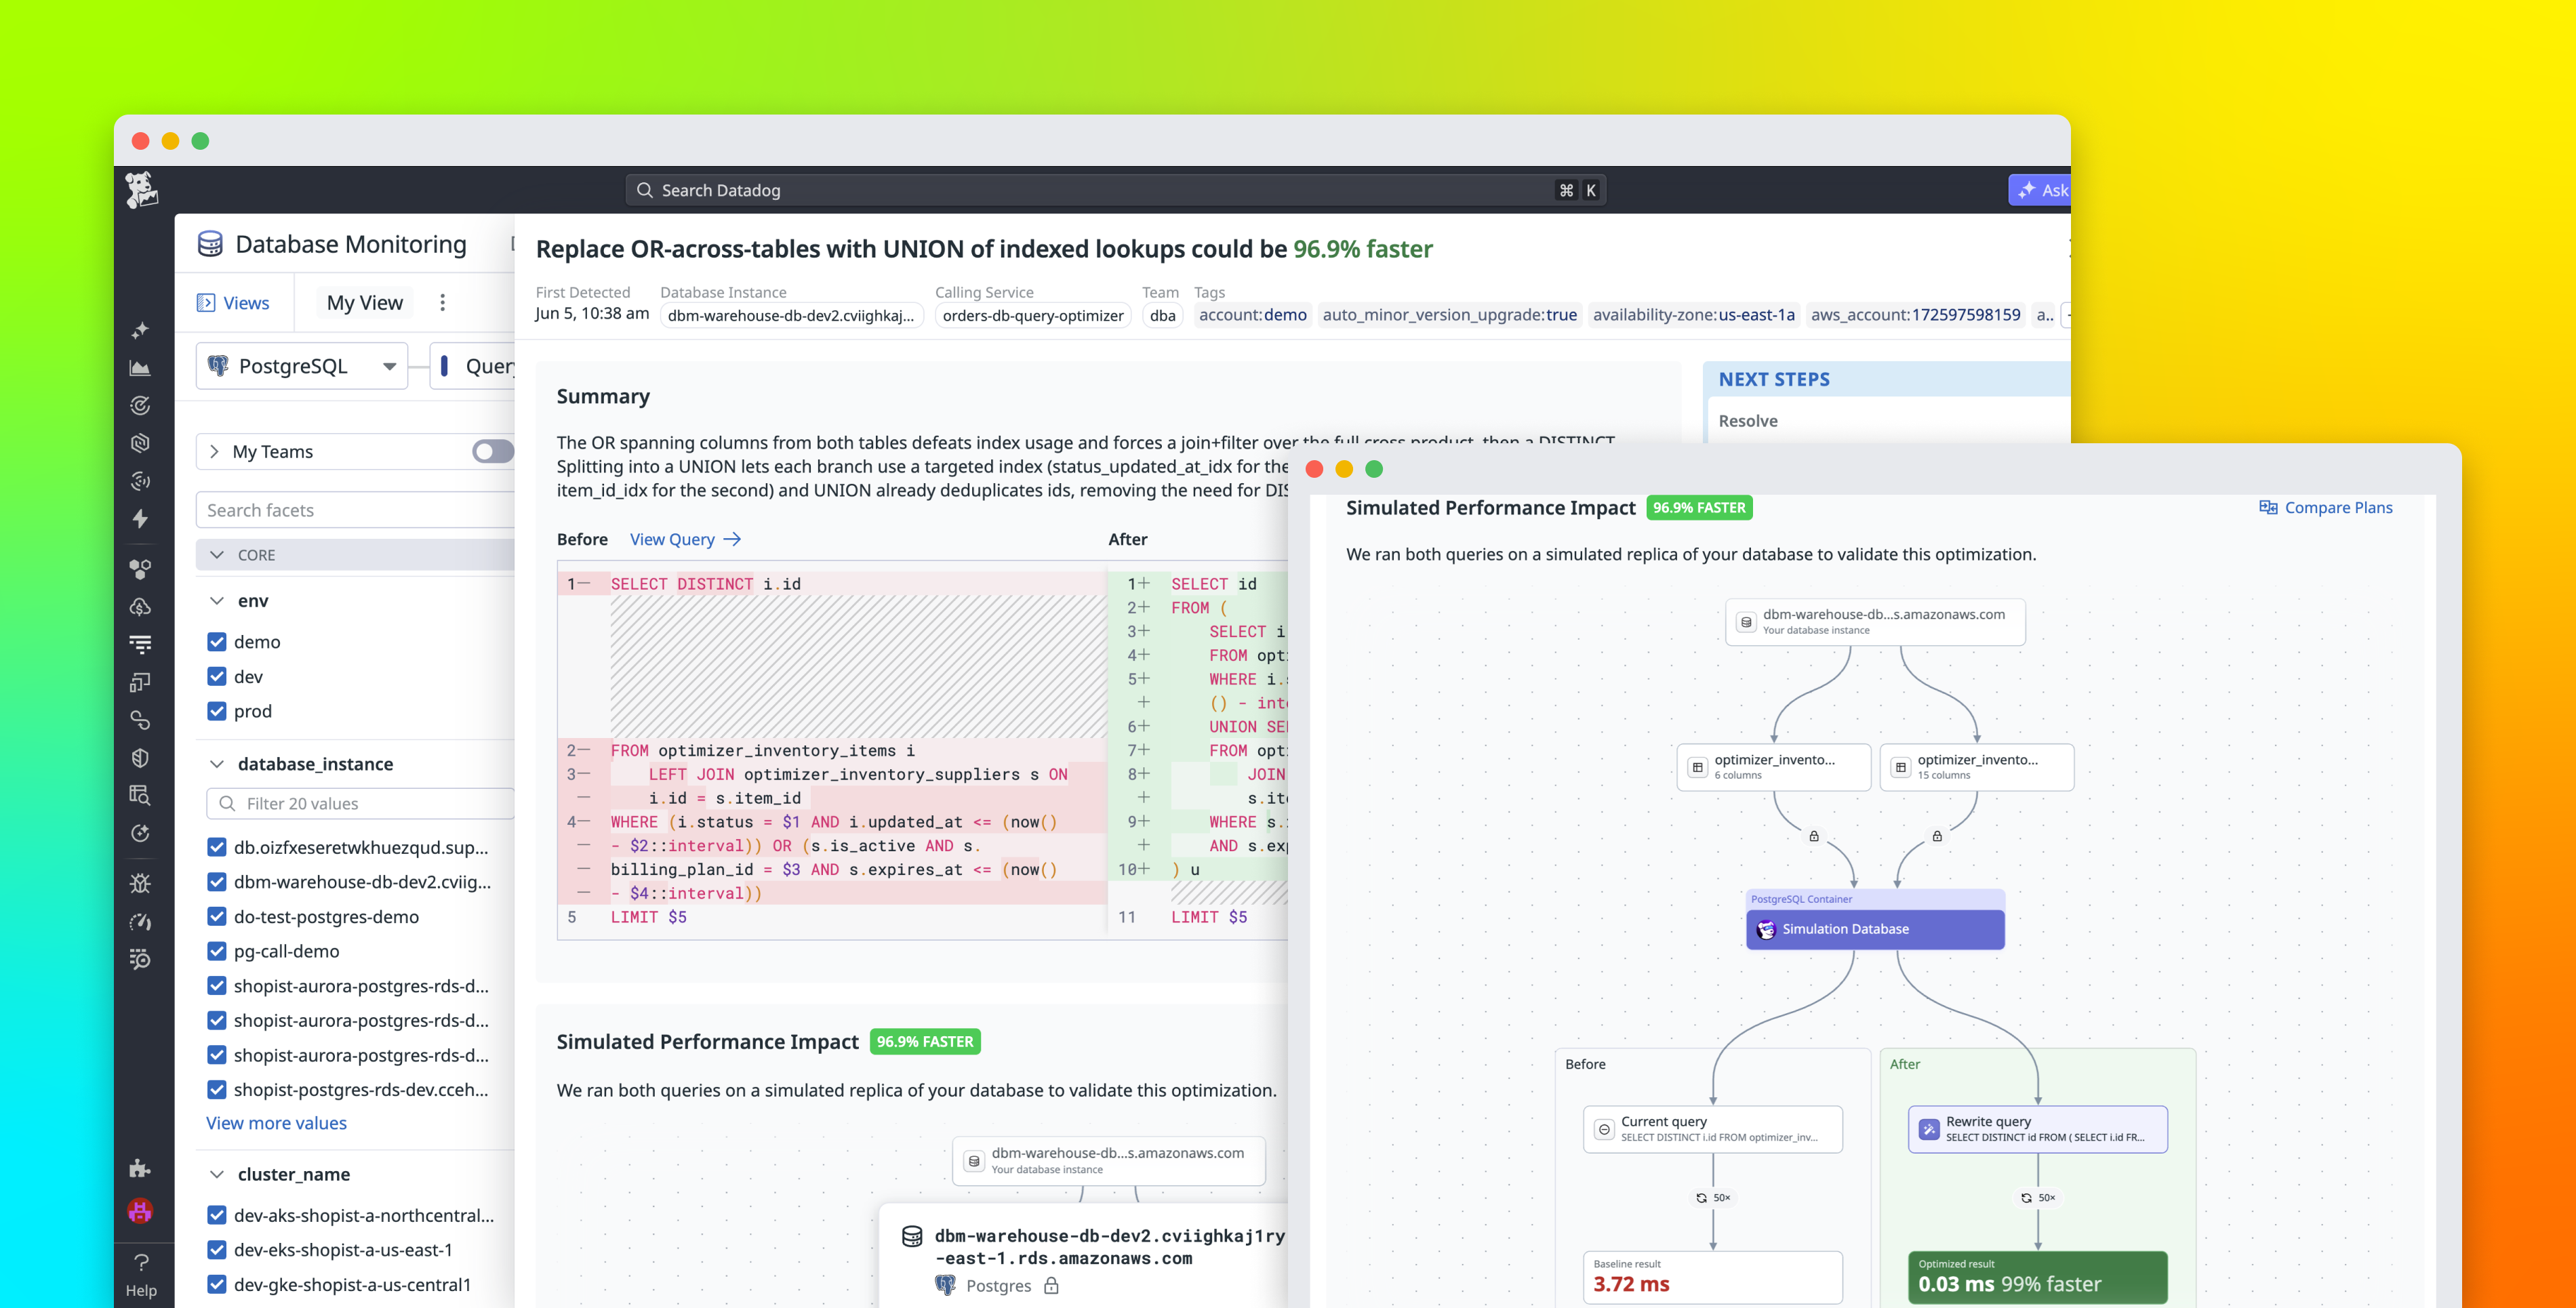
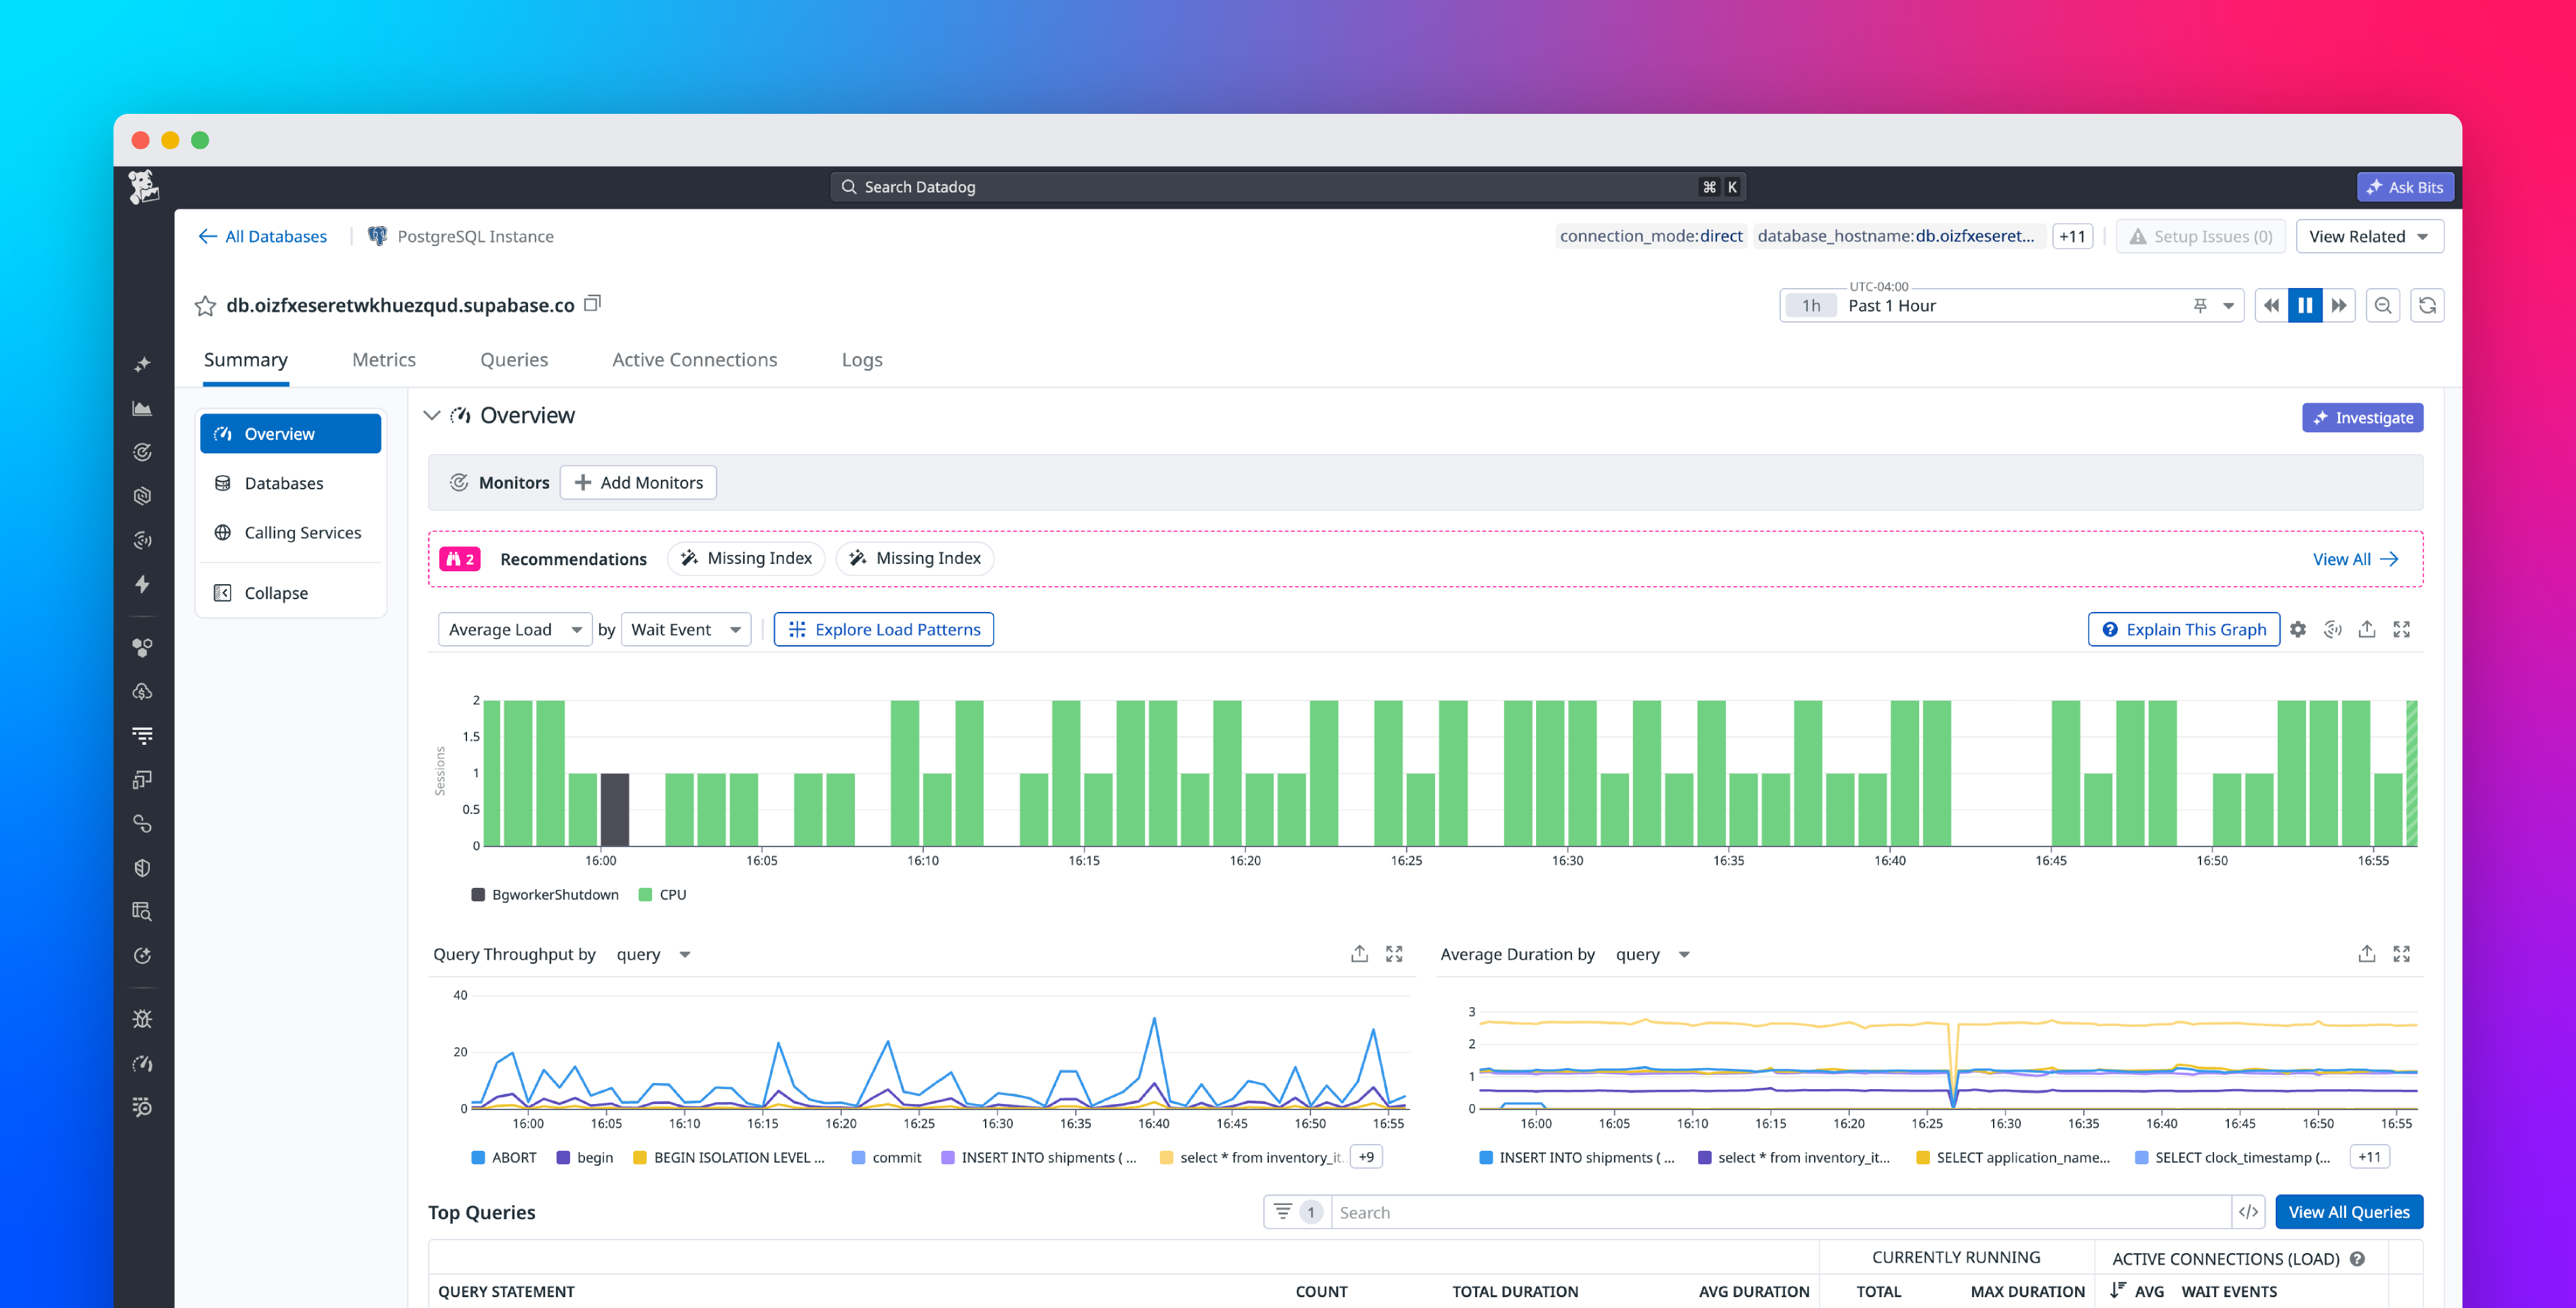
Datadog Database Monitoring (DBM) for Supabase gives developers query-level metrics, explain plans, and optimization recommendations in a single platform. Its setup is agentless and can be completed in one click. After setup, developers can detect regressions, trace slowdowns from the application layer to the database, and act on issues even if they lack deep Postgres expertise.
In this post, we’ll show how Database Monitoring for Supabase helps app developers:
Monitor Supabase instances with one clickCatch performance regressions as soon as they happenDiscover and test optimizations to improve performanceTrace application slowdowns to their source in the database