Today, we are launching Supabase Log Drains on the Supabase Pro tier. Supabase Pro users can now send their Supabase logs to their own logging backend, enabling them to debug in the same place as the rest of their stack.
When something breaks, you go to your logs. But your application does not stop at your application code. Behind every request is a Postgres query, an auth check, a storage operation, or an Edge Function invocation. Until today, Supabase logs remained in Supabase, separate from the tools where you debug everything else.
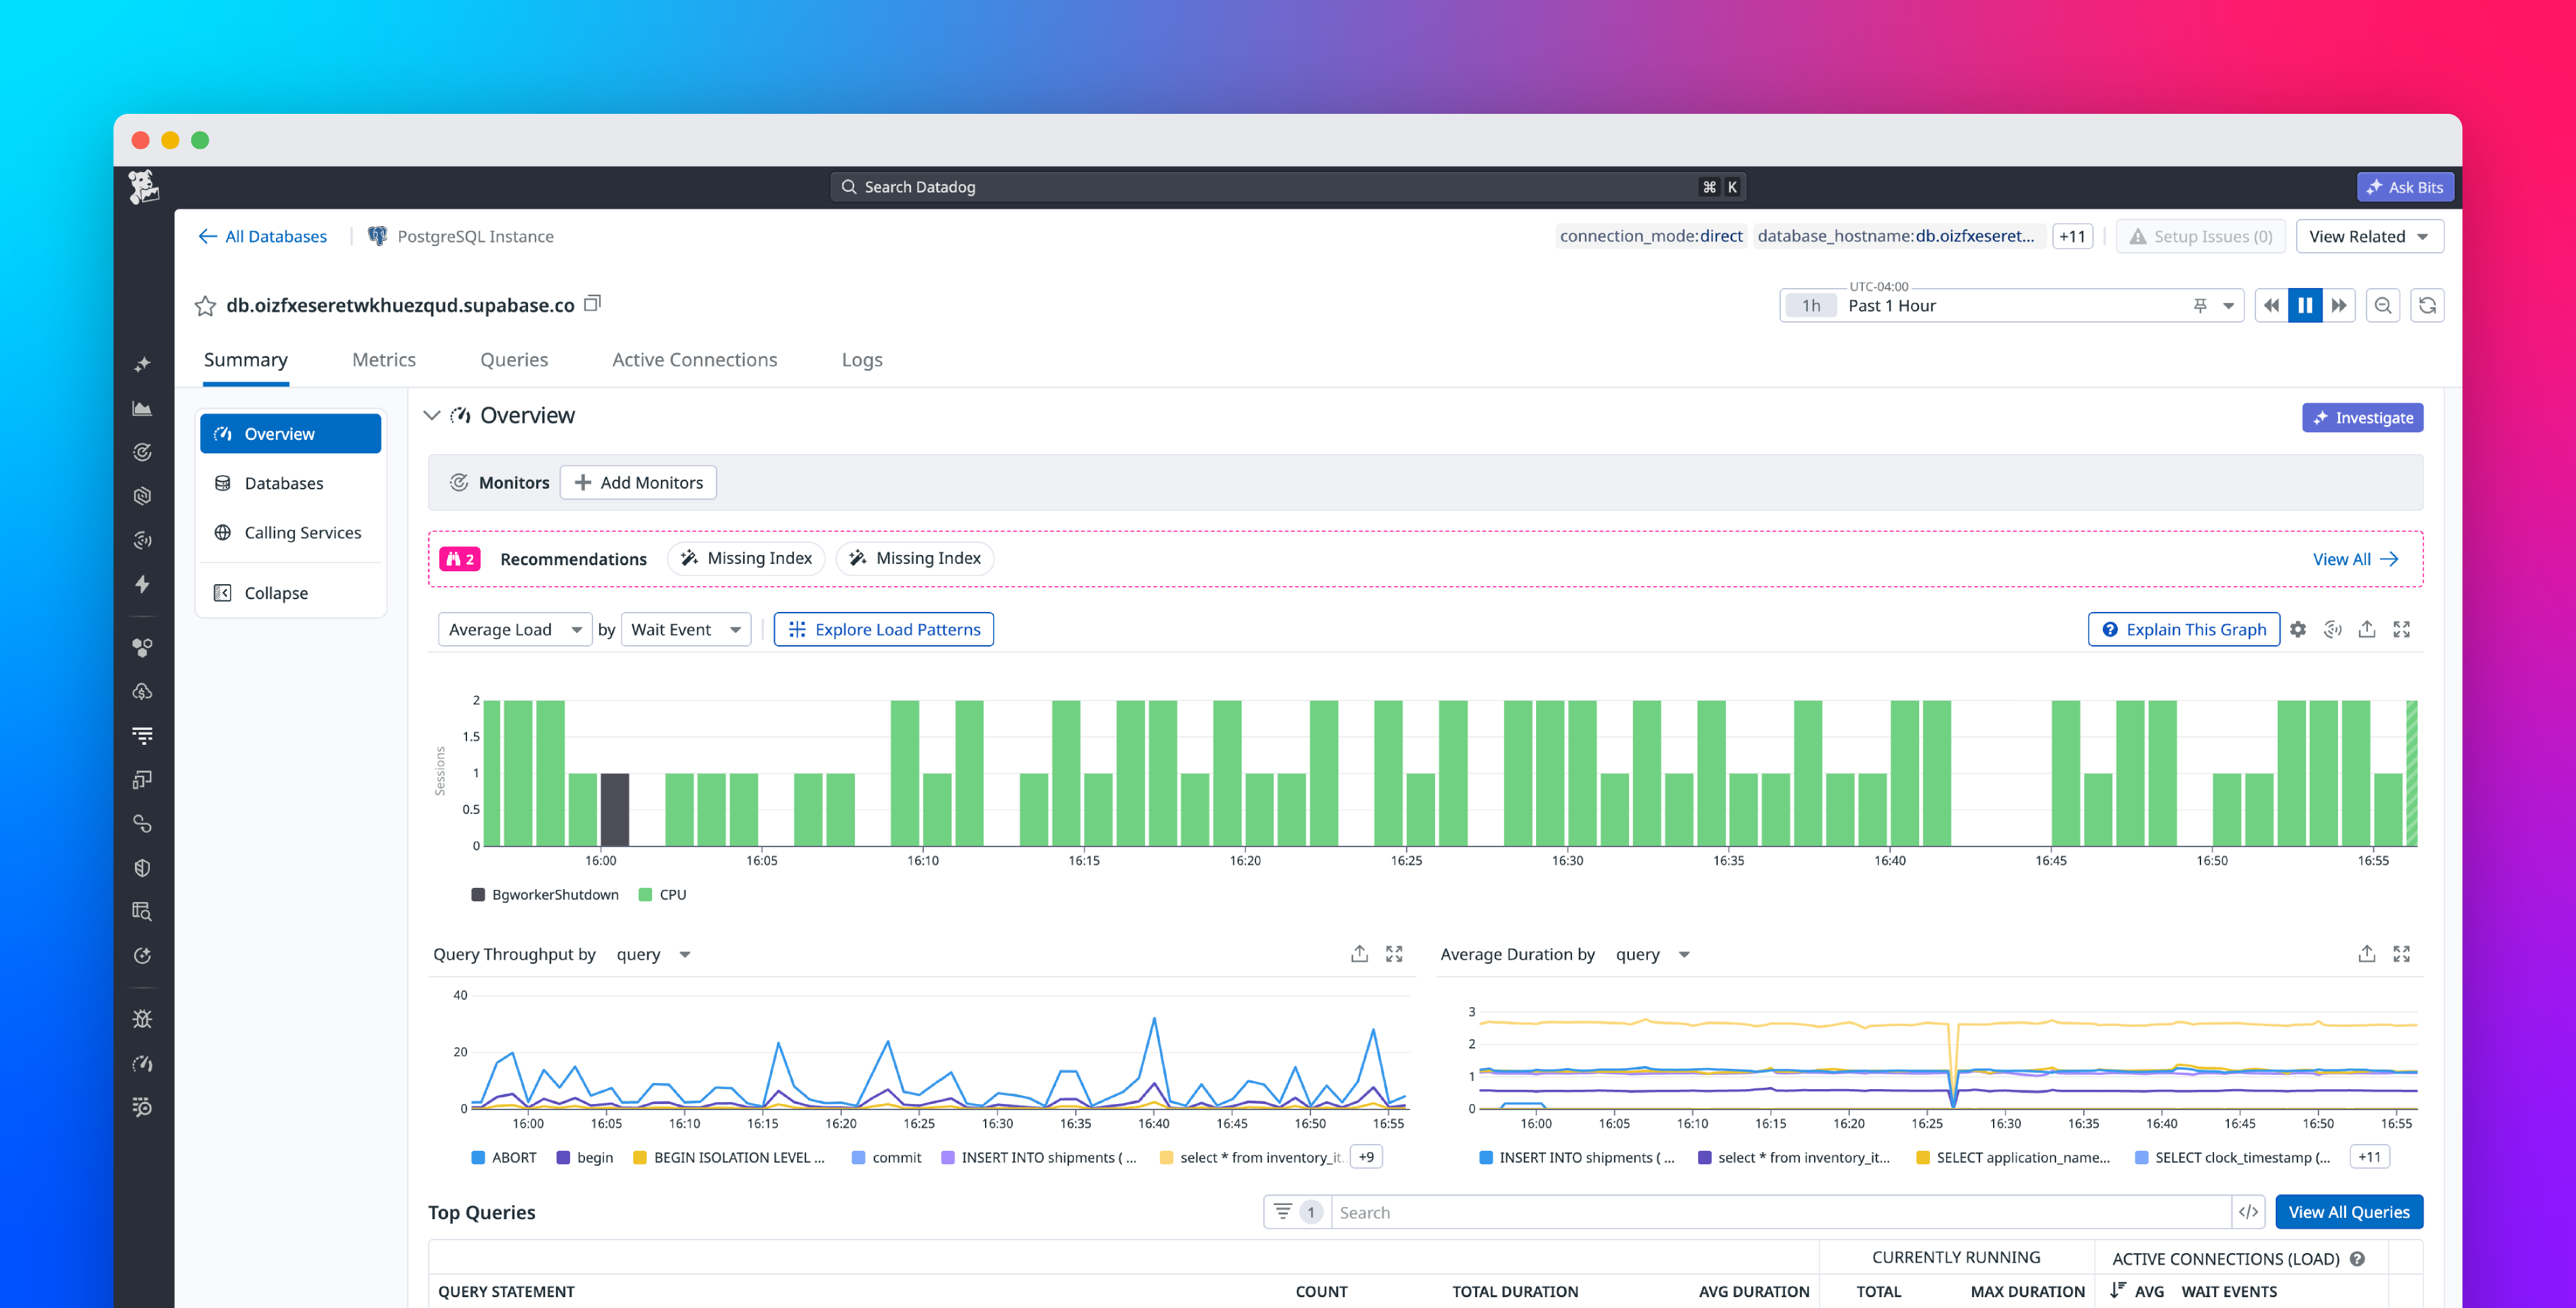
This separation costs you time. During an incident, you switch between your logging dashboard and the Supabase console, trying to correlate timestamps and piece together what happened. You build dashboards in Datadog or Grafana, but they only show half the picture.
Log drains eliminate this context switching. Your Postgres query errors appear next to your application exceptions. Your auth failures show up in the same timeline as your API errors. You build one dashboard that covers your entire stack.
Supabase captures logs from every layer of your infrastructure, not just your application code: