We've published enhanced documentation for the Metrics API so that you can stream your Supabase database telemetry into any Prometheus-compatible observability stack. Whether you use Grafana Cloud, Datadog, AWS Managed Prometheus, or a self-hosted setup, the Metrics API gives you full control over how you monitor, visualize, and alert on your database infrastructure.
Supabase Studio includes built-in observability dashboards. They work well for quick health checks. But production systems rarely exist in isolation.
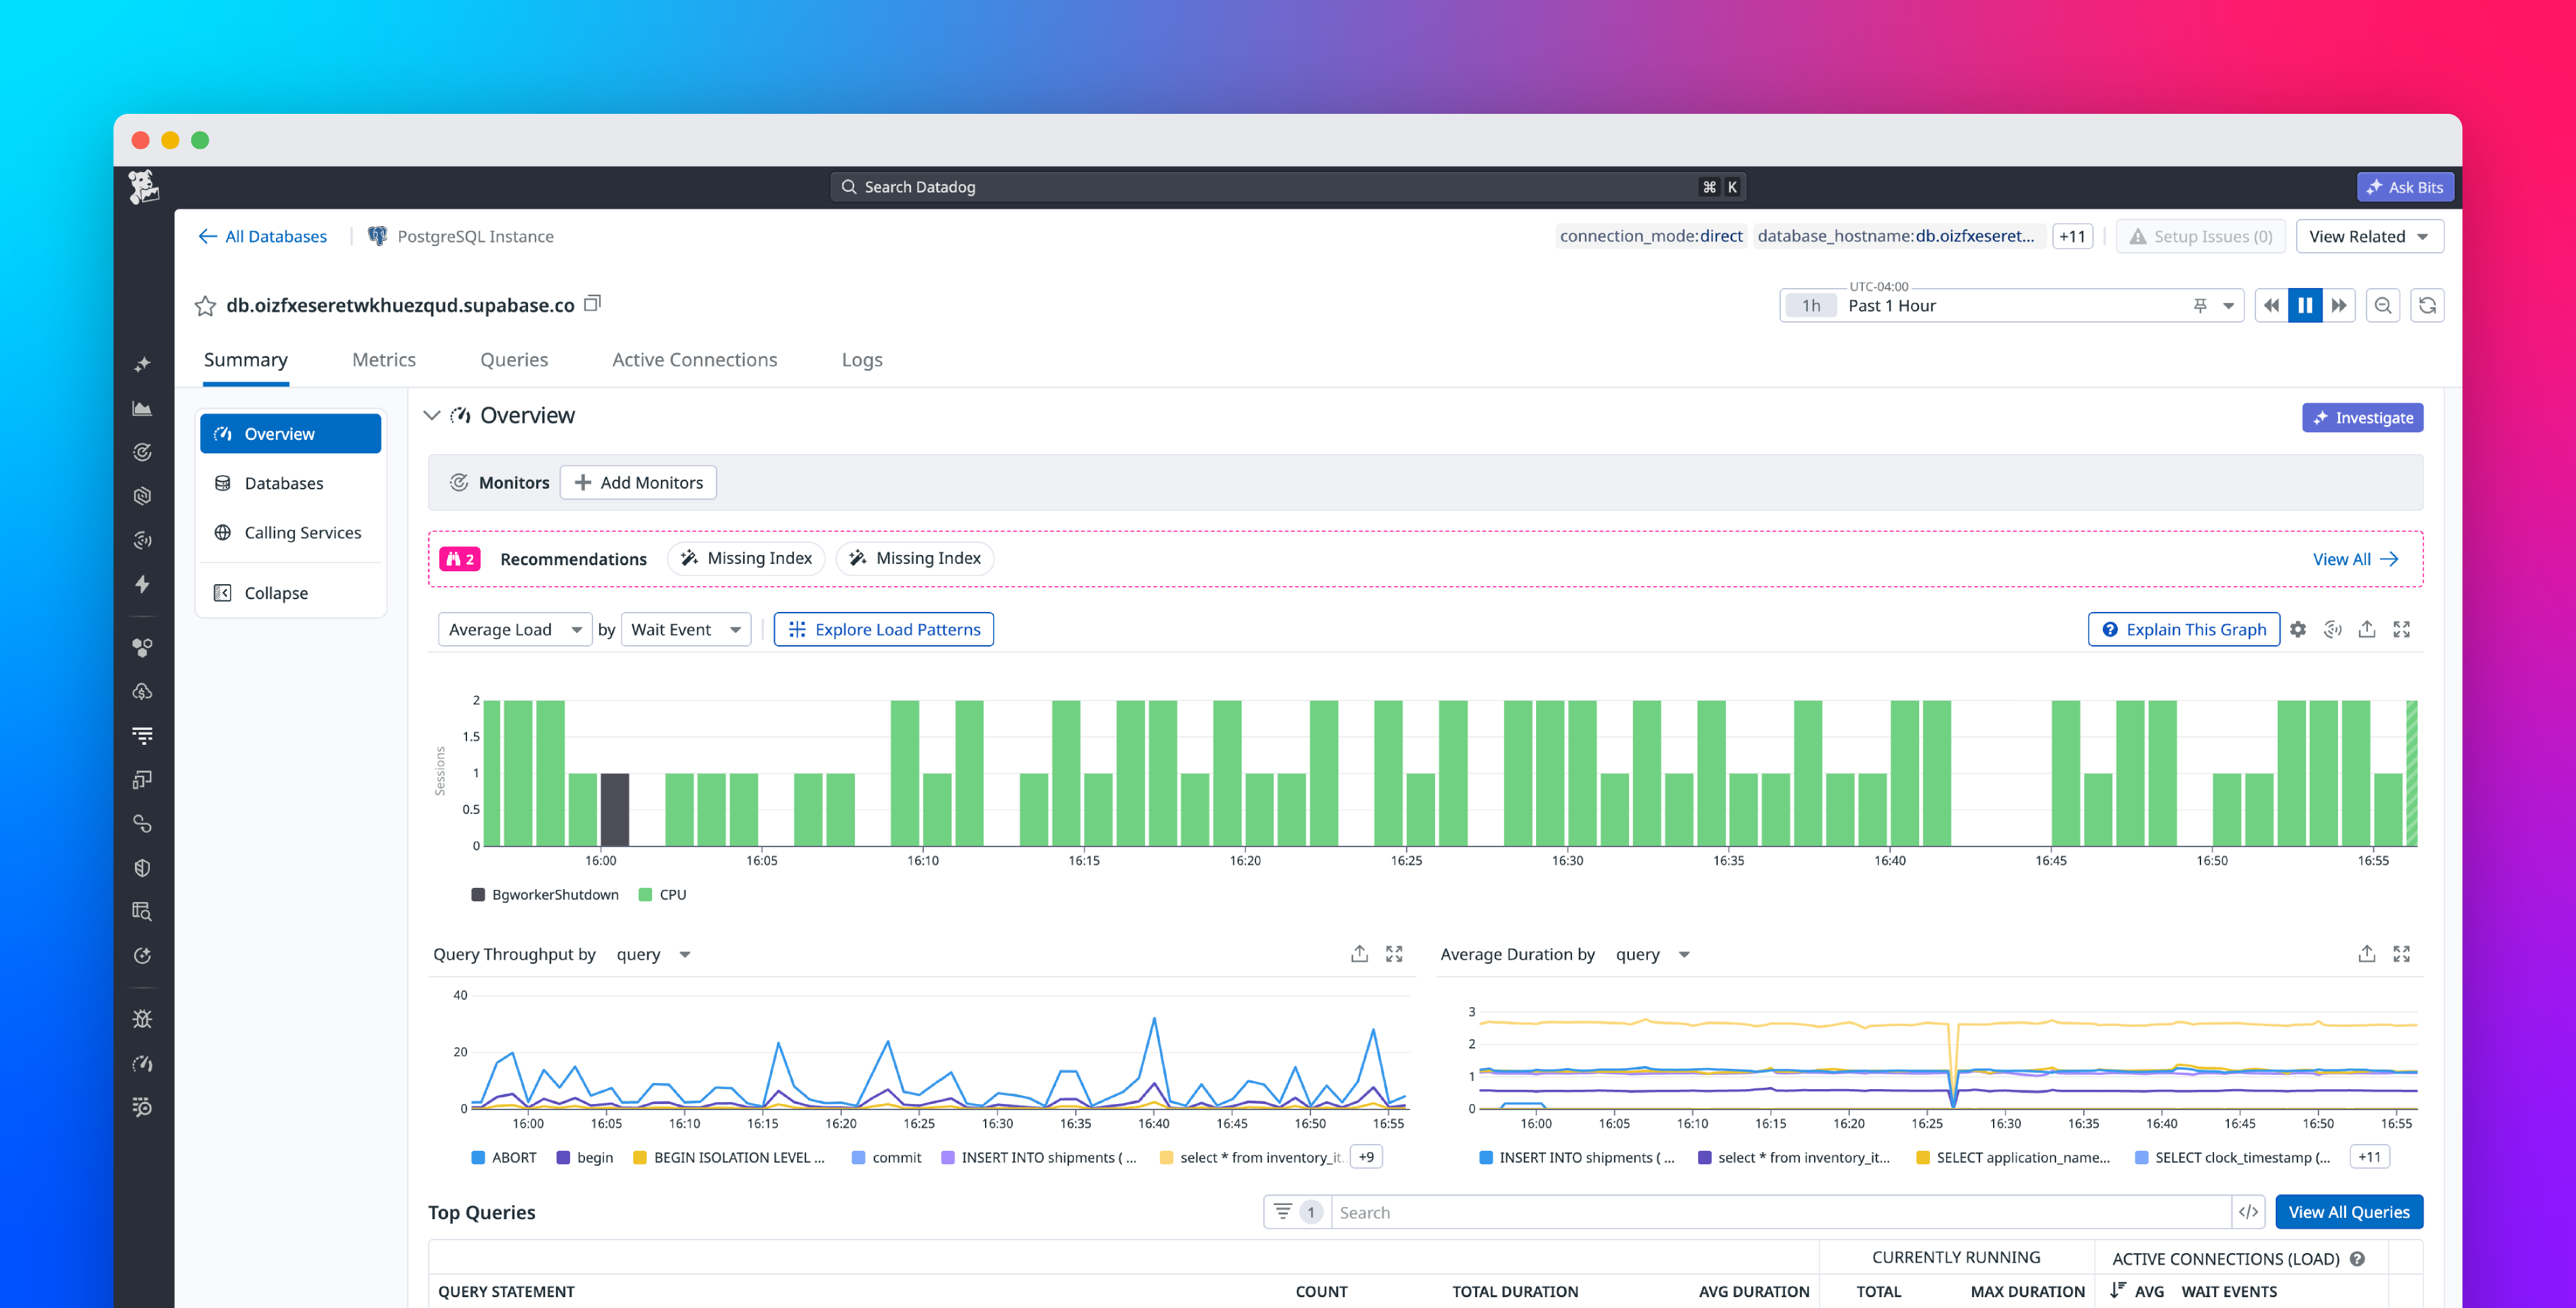
Your application probably already has an observability stack. APM traces flow into Datadog. Application logs land in Grafana Loki. Infrastructure metrics feed Prometheus. When your database metrics live in a separate silo, you lose context. You cannot correlate a spike in API latency with database connection saturation. You cannot overlay query performance against deployment events.
The Metrics API fixes this. It exposes roughly 200 Postgres performance and health metrics in Prometheus exposition format. One scrape job. One unified view of your entire stack.
Every Supabase project has a metrics endpoint: