Cloud cost data is most useful when teams can adapt it to their own reporting and planning needs. In addition to viewing cost breakdowns, FinOps teams often need to calculate forecasts, reshape datasets, and present tailored views to finance and leadership teams. In many workflows, those steps happen outside the observability platform. Once the data is exported, it quickly becomes outdated and requires repeated manual updates.
Datadog Sheets addresses this issue in combination with Datadog Cloud Cost Management (CCM). With Sheets, you can analyze CCM cost data across providers, services, and teams by using structured tables that support calculated columns and pivot tables. Sheets also offers flexible spreadsheet-style tabs (in Preview), where you can write formulas, reference table data, and design custom layouts while staying connected to live Datadog data.
In this post, we’ll show examples of how you can use Sheets and CCM to:
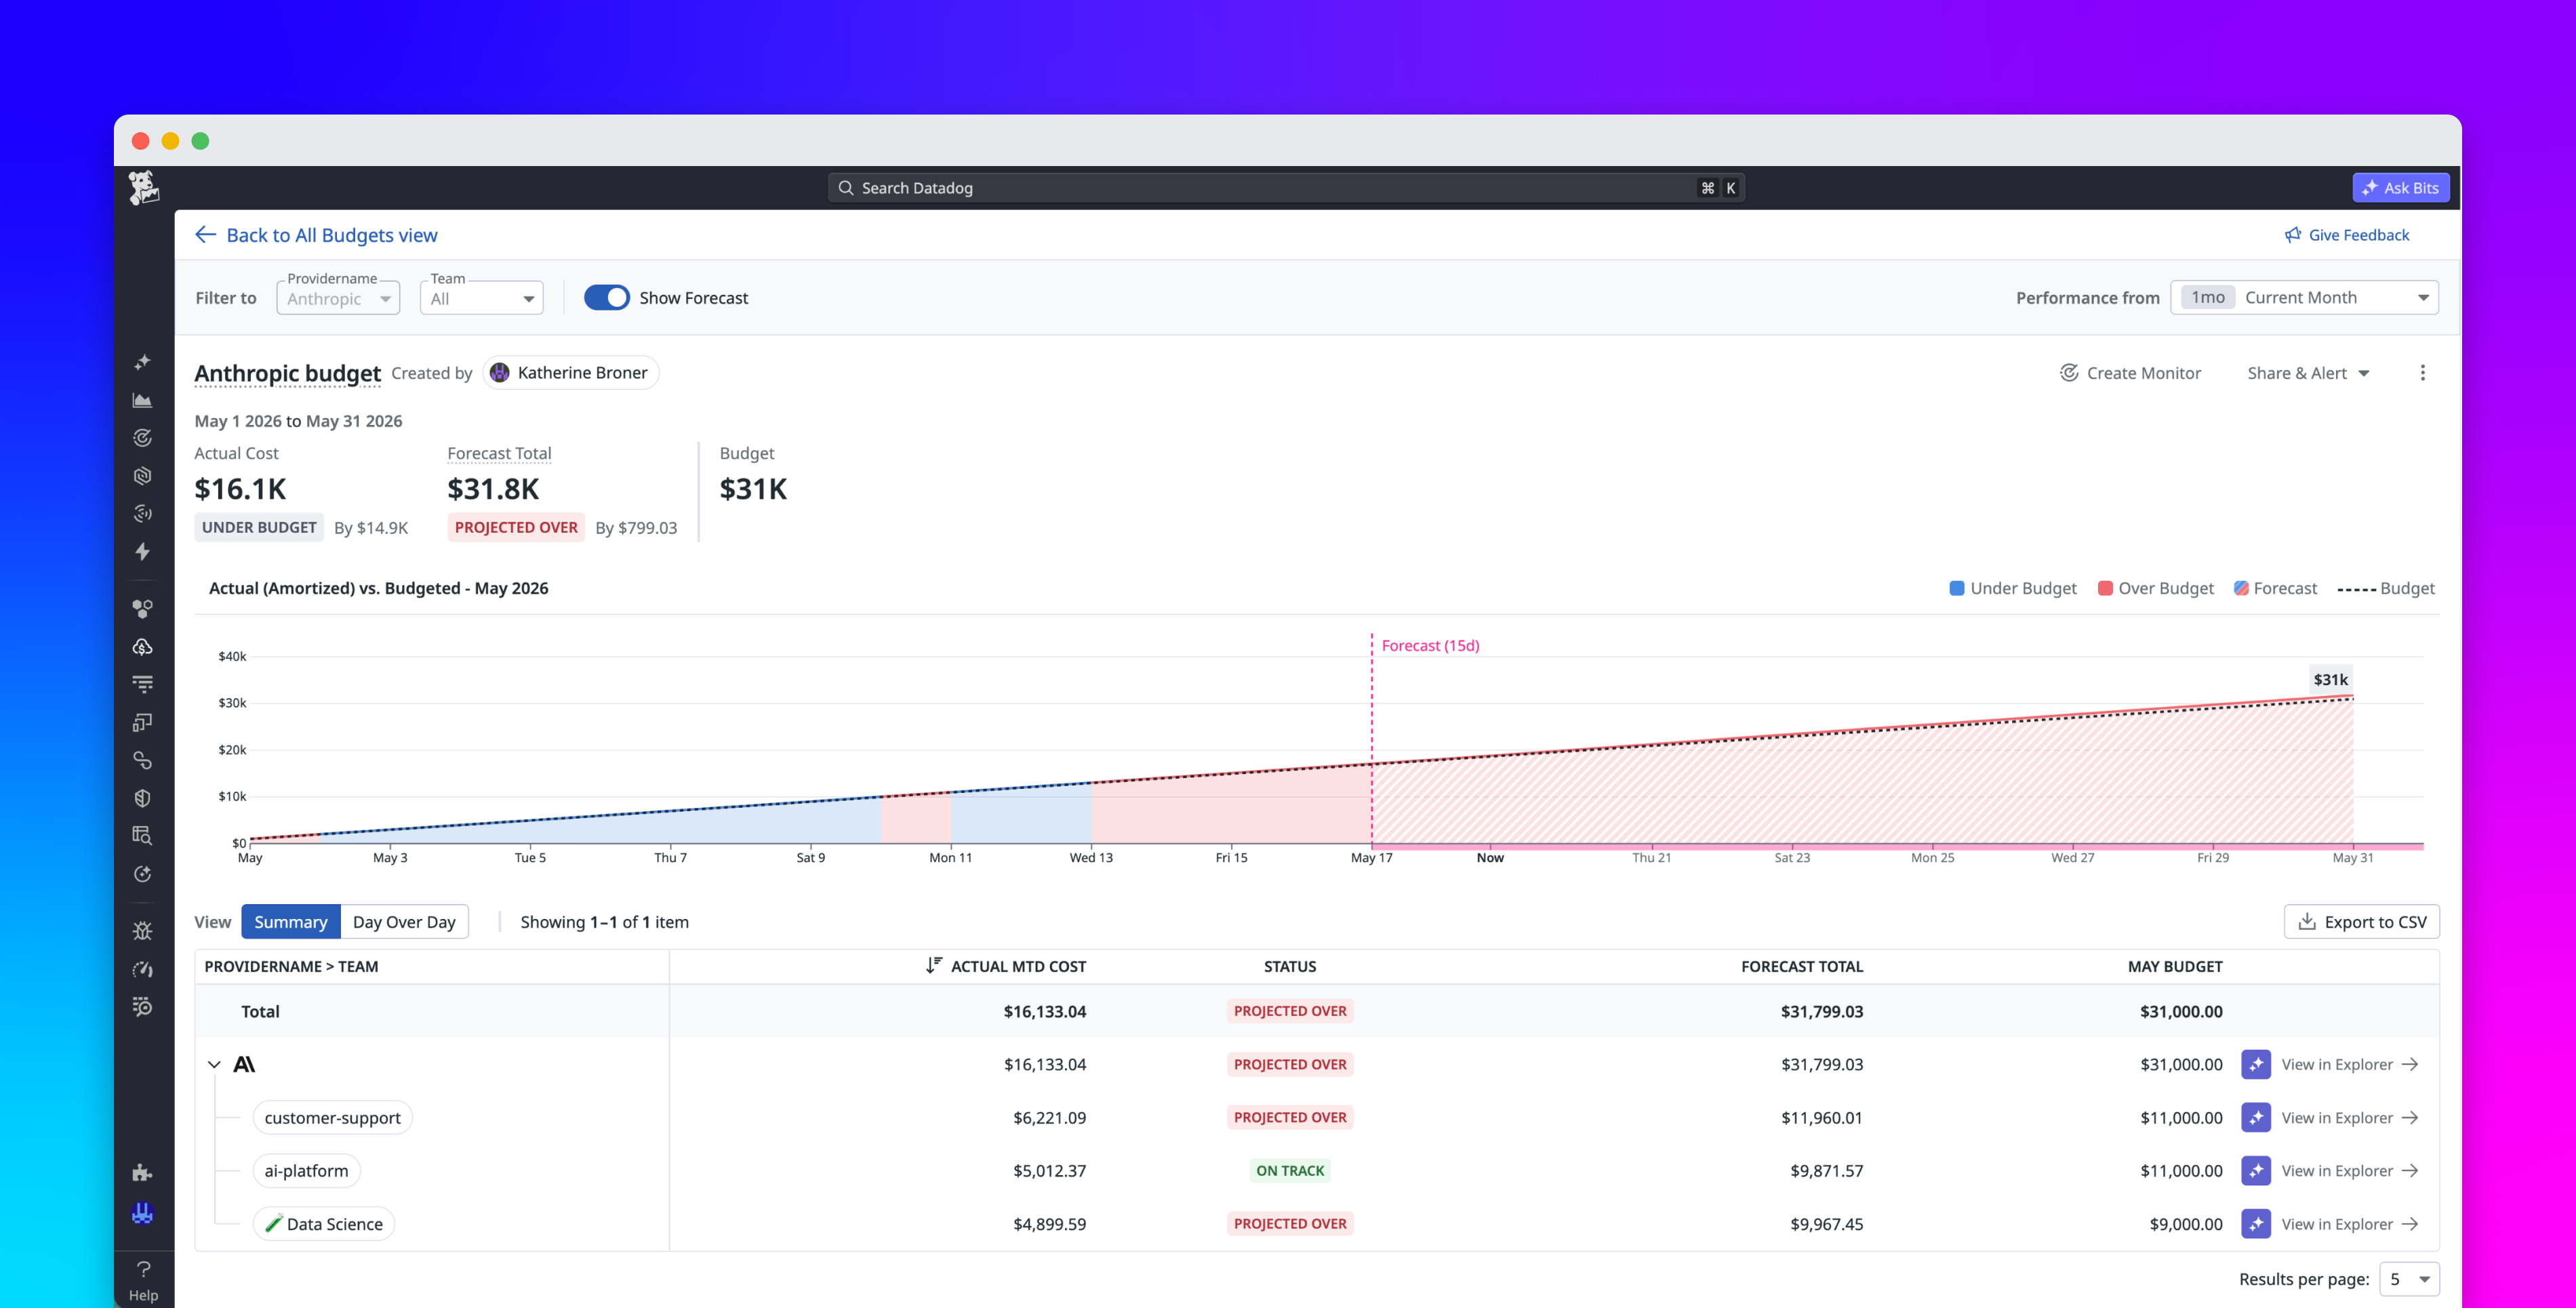
Track monthly cloud spend by providerForecast yearly cloud spend by team
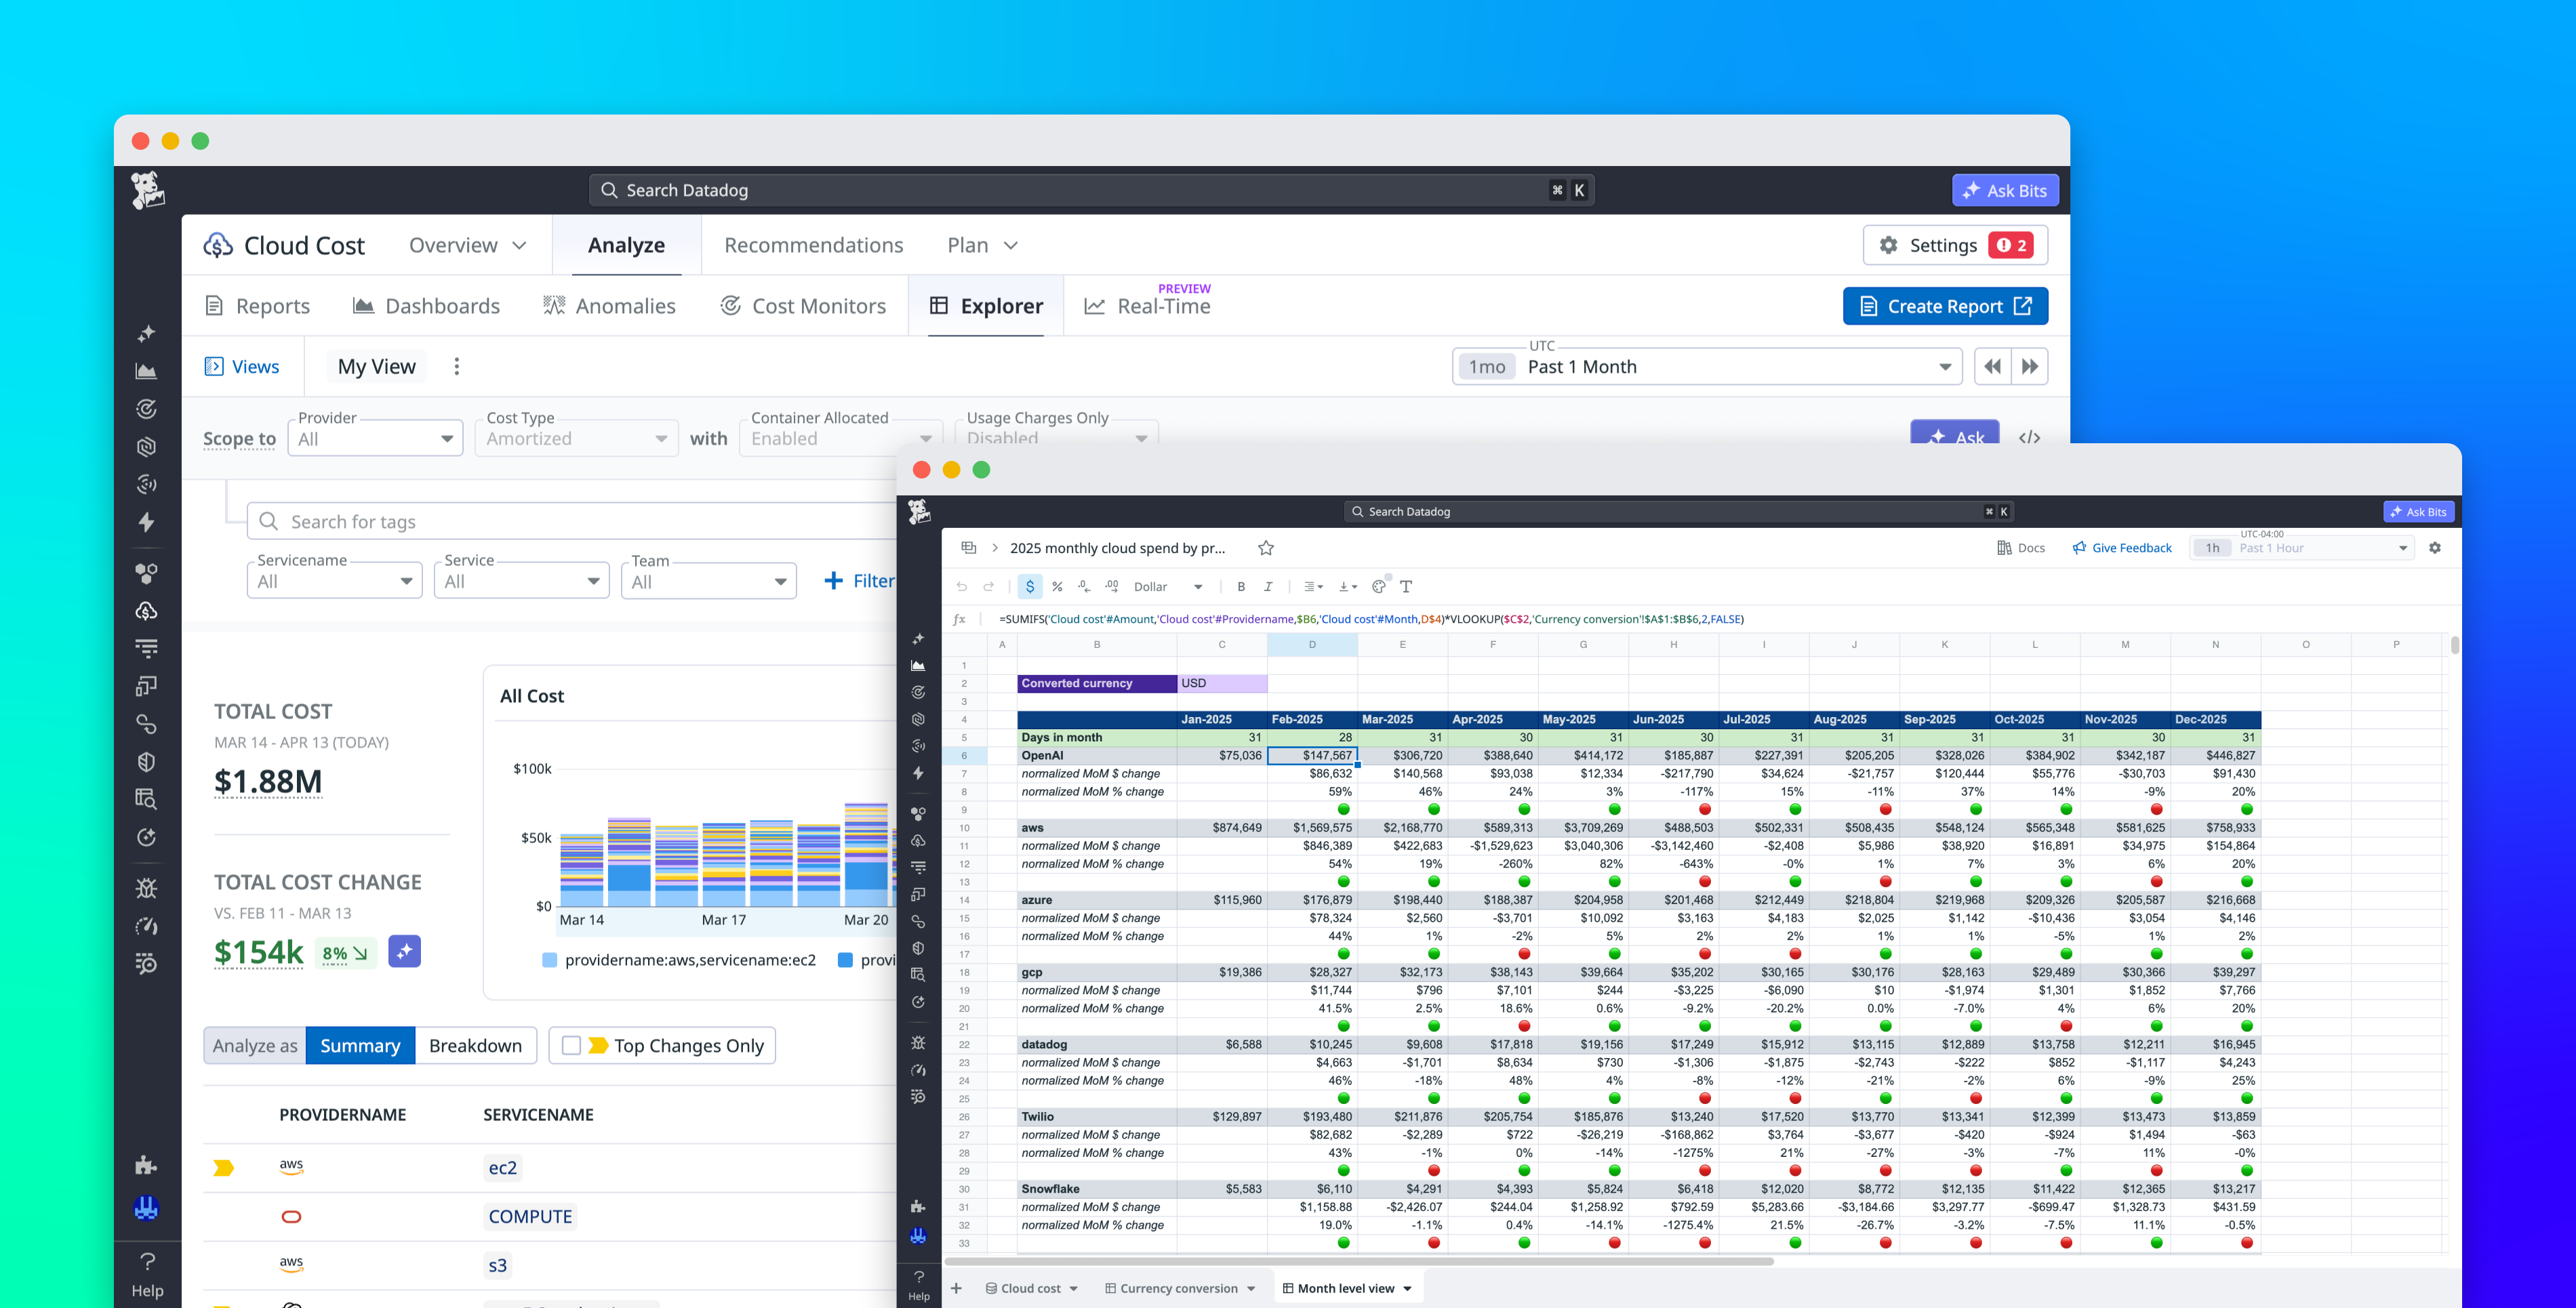
Track monthly cloud spend by provider