This article was originally published on LearnKube
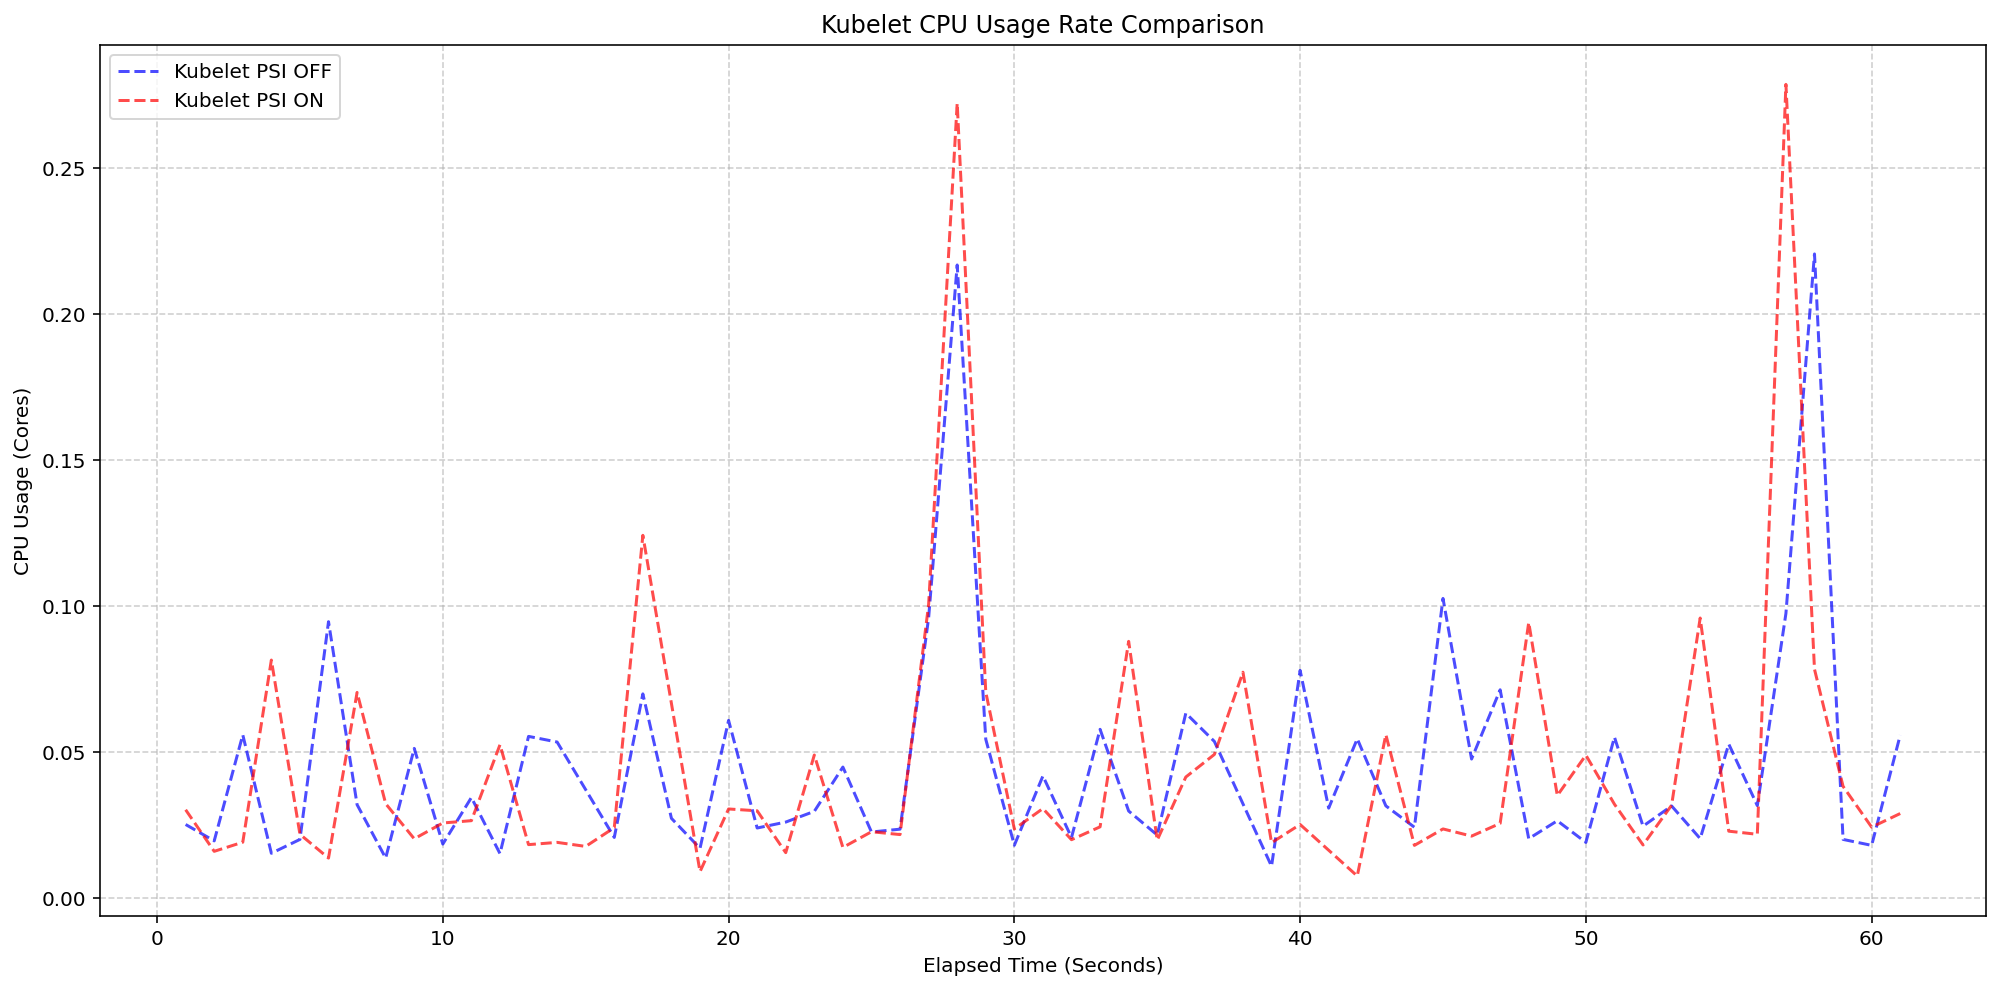
TL;DR: This article dissects the Kubernetes metrics pipeline through kubelet, cAdvisor, and CRI to show where your metrics actually come from and what breaks when the defaults change.
This article breaks down how Kubernetes collects container, pod, and node metrics, starting with cAdvisor and the Linux kernel, then shifting to a CRI-native model powered by gRPC.
You’ll see how kubelet exposes this data, what happens when you flip PodAndContainerStatsFromCRI, why container metrics on /metrics/cadvisor can be sourced from CRI instead of cAdvisor, and how to trace each metric back to its origin.
It also explains how kubelet talks to the CRI over gRPC, and why understanding this matters if you rely on Prometheus, Grafana, or any observability stack.