In the first two parts of this series, we explored how Karpenter’s architecture enables just-in-time provisioning and active node consolidation, and we identified the key Karpenter metrics you should track to keep your cluster performant and cost-efficient. In this post, we’ll look at vendor-agnostic tools you can use to capture these signals. We’ll show you how to:
Audit Karpenter’s current state by using native Kubernetes commandsCollect and visualize Karpenter metrics by using Prometheus and Grafana to track provisioning latency and consolidation trendsMonitor logs to audit Karpenter’s activity and understand its scheduling and disruption decisions
Use Kubernetes-native tools to spot-check Karpenter status
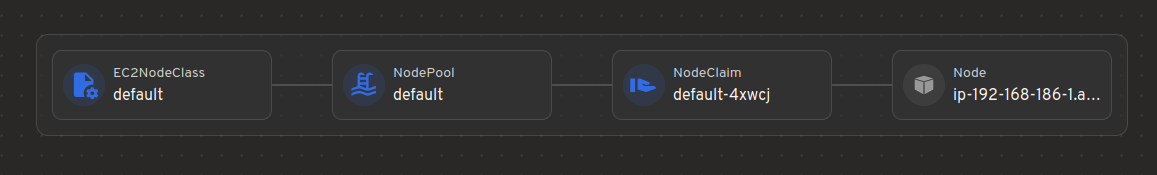
Before implementing a comprehensive observability pipeline, it can be helpful to use Kubernetes’ built-in tooling to do a quick, real-time check of what Karpenter is doing. These spot checks are especially handy when pods are pending and you’re quickly trying to understand why they haven’t been scheduled. A good first step is to use kubectl to look at the resources Karpenter creates and manages. Karpenter adds (and replaces) cluster capacity by creating NodeClaim Kubernetes objects that represent the compute it wants the cloud provider to provision. The following command can give you a high-level inventory of what Karpenter has created: kubectl get nodeclaims