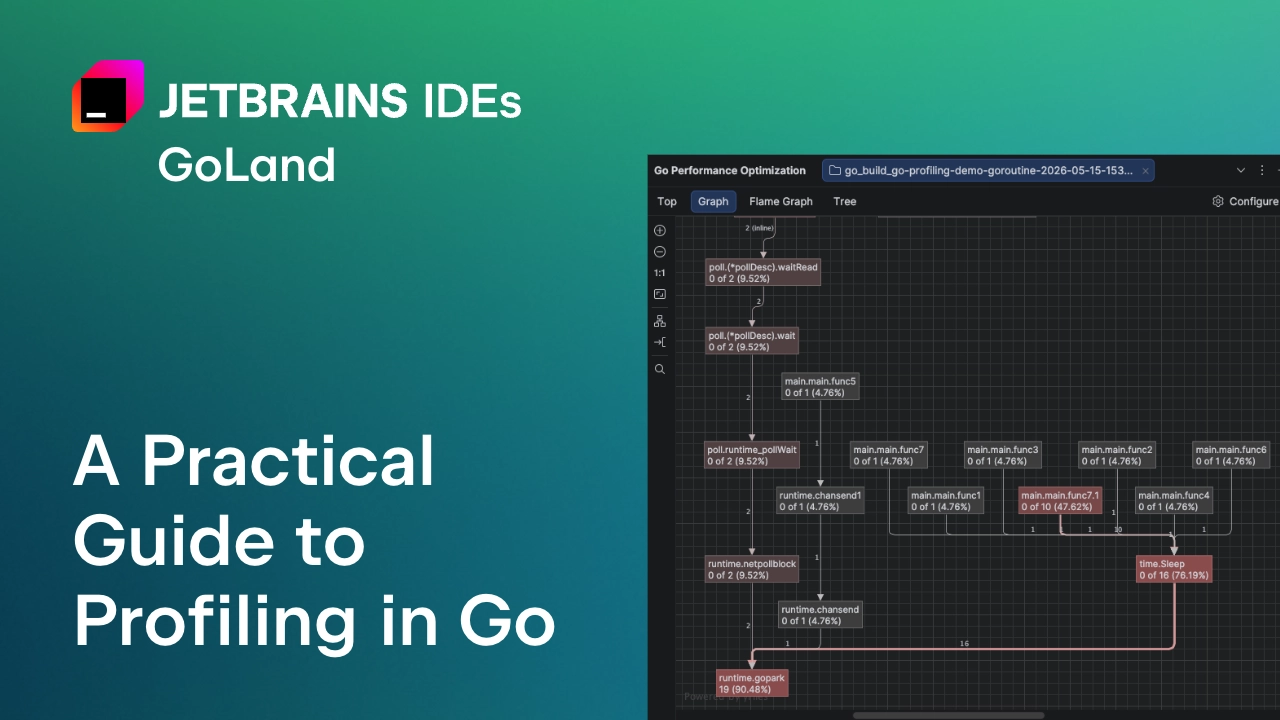
The IDE for professional development in Go
GoLandA Practical Guide to Profiling in Go
As is often the case with Go, the standard library comes with a great tool for profiling your programs – pprof. It samples your call stack, allowing you to later generate reports that help you analyze and visualize your software’s performance without installing any plugins. Everything you need is in the Go development kit.
The problem? It’s a bit of a hassle. In our discussions with Go developers, we’ve heard that some actually avoid it if they can. There could be a few reasons for this. For many developers, typical Go services perform well enough without optimizations, so when they do need to use profiling, it becomes a complex “rescue mission” tool they aren’t really experienced with. For some, the issue isn’t profiling in itself, but rather what to do with the results. Since pprof just shows developers a lot of low-level profiling data, it’s on them to make sense of it and find the root of the issue. On the other end of the spectrum, there are those who practice continuous profiling and use dedicated tools for it.
This article serves as a practical guide for those developers who would rather avoid dealing with Go’s confusing profiling tools. Profiling is incredibly useful – it helps you identify CPU bottlenecks, memory issues, and concurrency problems, all of which affect both your and your users’ experience with your product. So to help you make the best use of it, we will explain some of the main profiling types in Go (CPU, heap, allocs, mutex, block, and goroutine), as well as how to run and interpret them. And because you’re on the JetBrains blog, we’ll also show you how GoLand makes profiling as easy as pressing a single button. But first…