𝗜𝗻𝘁𝗲𝗴𝗿𝗮𝘁𝗶𝗼𝗻 𝗼𝗳 𝘀𝗼𝘀 𝗿𝗲𝗽𝗼𝗿𝘁 𝗶𝗻 𝗜𝗻𝗰𝗶𝗱𝗲𝗻𝘁 𝗠𝗮𝗻𝗮𝗴𝗲𝗺𝗲𝗻𝘁 𝗣𝗶𝗽𝗲𝗹𝗶𝗻𝗲𝘀.
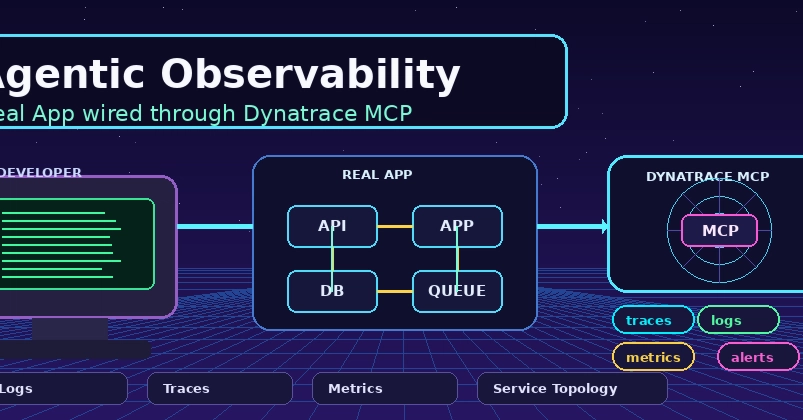
Monitoring and observability tools — Grafana, Prometheus, traces, logs — tell you that something is wrong and where. They do not tell you what the host operating system was doing at that moment: which processes were consuming memory, what the kernel OOM killer decided, whether a filesystem was having an I/O contention problem, what the block device queue looked like, what firewall rules were in effect. That data lives on the node, is often ephemeral, and disappears or changes as the system recovers.
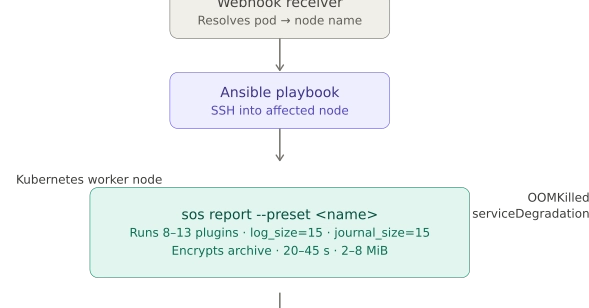
The purpose of integrating the widely available open-source 𝘀𝗼𝘀 𝗿𝗲𝗽𝗼𝗿𝘁 Linux command into the pipeline is to 𝗰𝗮𝗽𝘁𝘂𝗿𝗲 𝘁𝗵𝗮𝘁 𝗢𝗦-𝗹𝗲𝘃𝗲𝗹 𝘀𝗻𝗮𝗽𝘀𝗵𝗼𝘁 𝗮𝘂𝘁𝗼𝗺𝗮𝘁𝗶𝗰𝗮𝗹𝗹𝘆, 𝗮𝘁 𝘁𝗵𝗲 𝗺𝗼𝗺𝗲𝗻𝘁 𝗼𝗳 𝘁𝗵𝗲 𝗮𝗹𝗲𝗿𝘁, 𝗯𝗲𝗳𝗼𝗿𝗲 𝘁𝗵𝗲 𝗲𝘃𝗶𝗱𝗲𝗻𝗰𝗲 𝗱𝗲𝗴𝗿𝗮𝗱𝗲𝘀 without requiring a human to log into the node and collect it manually.
More specifically it achieves four things:
𝗦𝗽𝗲𝗲𝗱 𝗼𝗳 𝗱𝗶𝗮𝗴𝗻𝗼𝘀𝗶𝘀. The data is already collected and analysed by the time the SRE opens the alert. They review findings instead of gathering evidence.